Running Head: Centrilobular and Panlobular Emphysema Differences
Funding support: Supported by grants from the National Institutes of Health (U01 HL089897 and U01 HL089856, to COPDGene). Additional support is acknowledged from the COPD Foundation, AstraZeneca Inc, and GlaxoSmithKline Inc.
Date of acceptance: March 13, 2014.
Abbreviations: centrilobular emphysema, CLE; panlobular emphysema, PLE; computed tomography, CT; percentage ratio of low attenuation area to corresponding lung area, LAA%; wall area percentage for segmental bronchi, %WAsegm; wall area percentage for subsegmental bronchi, %WAsubsegm; forced expiratory volume in 1 second, FEV1; forced vital capacity, FVC; Hounsfield Units, HU; Global Initiative for chronic Obstuctive Lung Disease, GOLD; odds ratio, OR; confidence interval, CI; quantitative CT, QCT; picture archiving and communications system, PACS; analysis of variance, ANOVA; body mass index, BMI
Citation: Sverzellati N, Lynch DA, Pistolesi M, et al. Physiologic and quantitative computed tomography differences between centrilobular and panlobular emphysema in COPD. Chronic Obstr Pulm Dis. 2014; 1(1): 125-132. doi: http://doi.org/10.15326/jcopdf.1.1.2014.0114
Online Supplemental Material: Read Online Supplemental Material (325KB)
Emphysema and small airway disease represent the major determinants of chronic airflow obstruction in smokers.1,2 The variable combination of these two main structural changes can be assessed by computed tomography (CT) analysis, which, in turn, may improve definition of chronic obstructive pulmonary disease (COPD) phenotypes.3-7 A number of CT-studies objectively quantified the global extent of emphysema, gas-trapping and bronchial metrics, and correlated them with functional, clinical and prognostic features.8-11
Quantitative assessment of emphysema is most often based on the percentage of lung voxels below a specific threshold (density mask technique). These measurements can be performed globally for both lungs together or refined to an individual lung or lung region,12 and have been shown to be of relevance for surgical treatment planning and prognostication.13-15 However, other emphysema features such as the gross morphology and the pattern distribution within the secondary pulmonary lobule do not lend themselves to quantitation using current available CT automated technique. Such additional structural information can be captured by the visual inspection which, despite its inherent subjectivity, might improve the definition of COPD phenotypes.
Radiologic-pathologic correlation studies showed that the different pathological phenotypes of emphysema - centrilobular (CLE), panlobular (PLE), and paraseptal (PSE) emphysema - can be reliably distinguished on CT images.16,17 It has been shown that CLE increases with age and is more commonly observed in individuals older than 50 years, whereas PSE is more frequently observed among younger smokers.18 Previous studies showed that the frequency of CLE may overlap among smokers with and without COPD, whereas PLE is almost exclusively present in severe COPD.19 However, there is inconclusive data on the frequency of each emphysema pattern among COPD patients, especially for PLE not associated with alpha-1antitrypsin deficiency 19,20
The scarcity of radiologic data on the emphysema phenotypes is in contrast with that achieved by the pathologic studies. The latter suggest that CLE and PLE may be differently related to small-airway disease and airflow obstruction and that they may display different inflammatory changes. 21-25 However, several questions on the significance of the emphysema phenotypes are still unanswered. It is unclear whether PLE is a more advanced stage of CLE or a completely different disease process. Furthermore, it would be interesting to understand whether CT can confirm noninvasively the correlations observed between pathologic changes and functional findings.
The aim of this study was to define the demographic, physiologic and quantitative CT (QCT) differences between CLE and PLE phenotypes of emphysema in smokers.
Methods
The research protocol was approved by the institutional review board at each participating institution, and all participants provided written informed consent. This study is based on quantitative and qualitative analyses performed on a population of 400 participants during an international, 4-day workshop held at the American College of Radiology Education Center (Reston, Virginia,). Workshop details can be found elsewhere.26
CT and Visual Assessment of Emphysema Patterns
Contiguous or overlapping axial sub-millimeter reconstructed CT slices were loaded on the picture archiving and communication system (PACS) server at the Education Center where 51 reviewers (29 pulmonologists, 22 radiologists) visually scored the CT images for several abnormalities by using a standardized electronic score sheet as previously described (further details also in the online supplementary material).26
The presence of emphysema was assessed by dividing the lungs into three zones (upper zone above the carina, mid zone between carina and inferior pulmonary veins, lower zone below the inferior pulmonary veins). Right and left lung were considered together. The score sheet recorded also the predominant pattern of emphysema (CLE or PLE) in upper, mid and lower zones. Global paraseptal emphysema was scored independently of CLE and PLE as follows: none, mild, moderate, severe.
Study Participants
This paper focuses on smokers with COPD and without alpha-1 antitrypsin deficiency, who had emphysema extent greater than 4.8% measured by QCT. Such a threshold corresponded to the 90th percentile value for emphysema percentage in normal individuals.26 Therefore, individuals with QCT measurements exceeding this value were regarded as being affected by emphysema.
The median observer score was used for establishing the presence or absence of either CLE or PLE in each lung zone. Coexisting severe paraseptal emphysema was regarded as a potential confounding factor and these participants were therefore excluded from the study cohort. Individuals with any paraseptal emphysema who did not have CLE or PLE and individuals without visual evidence of emphysema were also excluded from the data analysis. Since participants could be scored as having more than one type of emphysema in different lung zones, predominant PLE and CLE patterns were defined as follows: individuals with CLE in any lung zone and none-to-moderate paraseptal emphysema were classified as having pure CLE; individuals with PLE in at least one of the three lung zones (regardless of the coexistence of CLE) and none-to-moderate paraseptal emphysema were classified as having PLE.
Quantitative CT Analysis of Emphysema and Gas Trapping
Quantitative analysis was performed on segmented lung images by trained analysts using the VIDA Pulmonary Workstation, version 2.0. For the whole lung as well as for each lung lobe, emphysema extent was defined as % low attenuation area (LLA%) less than or equal to -950 Hounsfield units (HU) on inspiratory CT (%LAAinsp-950).27 Gas trapping percentage in non-emphysematous lung parenchyma was defined as the change in relative lung volume with attenuation values from -856 HU to -950 HU (%RVC -856 to −950) between paired inspiratory and expiratory examinations.10,11 (Further details on RVC -856 to −950 are given in the online supplementary material.) In addition, expiratory-to-inspiratory ratio of mean lung density (EI-ratioMLD) was also calculated and presented as a percentage.28, 29
For the distribution analysis, the right middle lobe was incorporated into the upper lobes. The ratio between the %LAAinsp-950 or %RVC -856 to −950 for upper and lower lobes was used to define the distribution pattern of these parameter as follows: the distribution was considered upper lobe predominant if the result of the ratio was >1 and was considered diffuse or lower lobe predominant if it was ≤1.30
The virtual airway tree was generated using an automated region-growing technique and detailed airway analysis to the subsegmental bronchi in six selected airway paths (RB1, RB4, RB10, LB1, LB4 & LB10) was performed. The wall area % (bronchial wall area as percentage of total bronchial area, %WA) was calculated for segmental (%WAsegm) and subsegmental bronchi (%WAsubsegm) (see also online supplementary material ).
Data Analysis
Inter-observer agreement for the assessment of CLE and PLE in the final study population was calculated by the multi-reader Kappa analysis.31 Comparative analyses were obtained using Student’s unpaired, two-tailed t-test, the analysis of variance (ANOVA), Mann-Whitney U-test, or Chi-square test as appropriate to evaluate differences in selected demographic, functional and CT features across Global Initiative for chronic Obstructive Lung Disease guidelines (GOLD) stages and between CLE and PLE patterns. Logistic regression analysis was performed to assess the factors influencing the emphysema phenotype (with PLE as the dependent variable).Those factors that presented statistically significant differences in the bivariate analysis were included as the independent variables in the first step.
Spearman correlations were used to describe correlations among QCT indexes for CLE and PLE separately. Univariate and multivariate linear regression analyses were performed to investigate the relationship between FEV1% of predicted, FEV1/FVC and QCT variables.
A p value less than 0.05 was considered to be statistically significant. All statistical analyses were performed using MedCalc statistical software (version 9.5.2.0).
Results
A total of 116 out of 400 (29%) cases met the study inclusion criteria. Comparisons of demographic, physiologic and QCT data stratified by the emphysema pattern are summarized in Table 1. Amongst the 61 cases with PLE predominant pattern, PLE was the only pattern scored in any of the 3 lung zones in 29 (47.5%) cases, while PLE combined with CLE was scored in the remaining 32 (52.5%). Mean kappa scores across reading groups for presence or absence of CLE and PLE were 0.16 and 0.3, respectively.
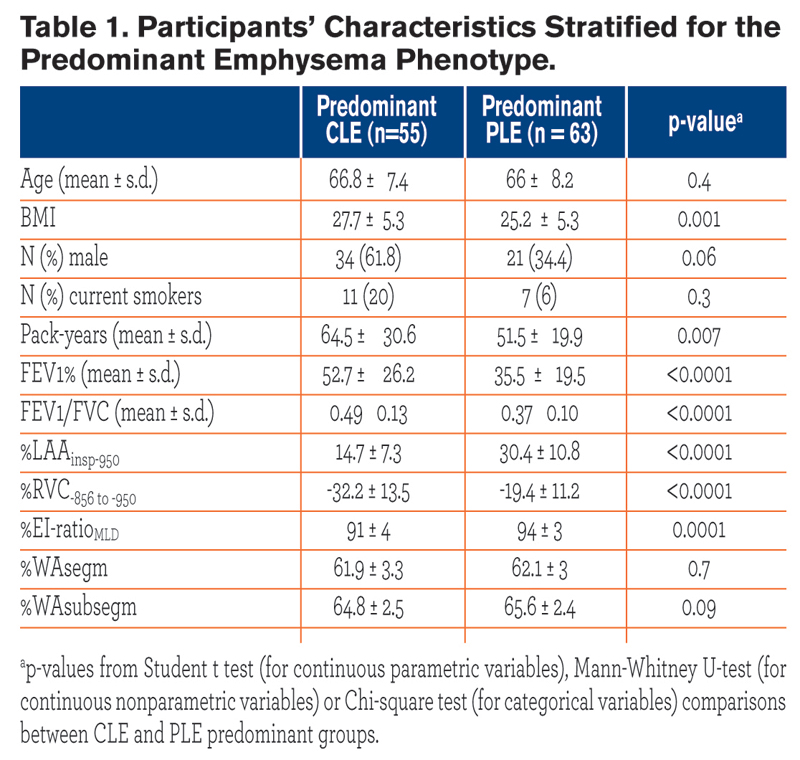 All participants were white individuals. CLE and PLE individuals were similar for age and gender proportion. Individuals with CLE had a greater body mass index (BMI) and were heavier smokers as compared with those with PLE. Cases with PLE, compared with those with CLE, exhibited lower FEV1% and FEV1/FVC, greater %LAAinsp-950, %RVC -856 to −950,%EI-ratioMLD (p = ≤ 0.0001), but similar %WAsegm and %WAsubsegm (p = 0.09 to 0.7). Cases with PLE, as compared to those with CLE, exhibited greater %LAAinsp-950 and %RVC -856 to −950 in each lobe (p = 0.03 to < 0.0001).
 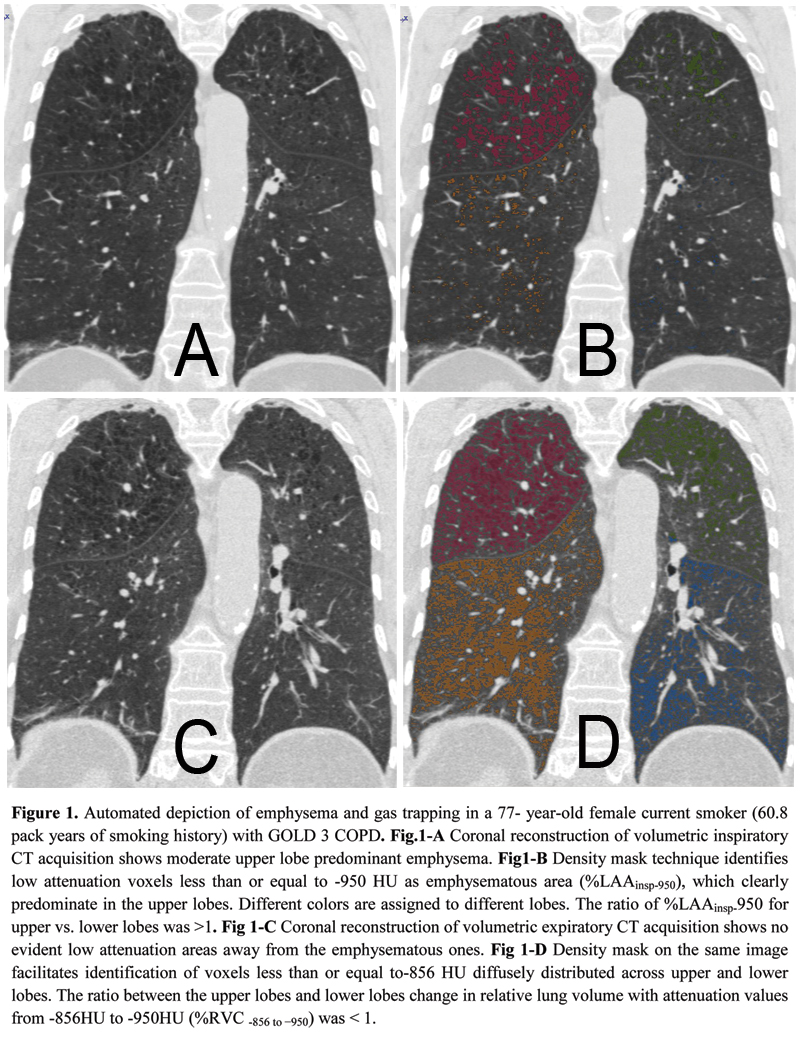 The distribution of %LAAinsp-950(p = 0.3) and %RVC -856 to −950(p = 0.2) was similar between CLE and PLE: upper lobe predominant %LAAinsp-950 was found in 51/55 (92.7%) CLE and 52/61(85.2%) PLE cases (p = 0.1), whereas diffuse or lower lobe predominant %RVC -856 to −950 was found in 43/55 (78.2%) of CLE and 40/61 (60.6%) of PLE cases (p = 0.2) (Fig. 1). At logistic regression analysis, only %LAAinsp-950 (OR = 1.18, 95% CI: 1.12 to 1.27, β coefficient = 0.17, p = <0.0001) and pack-years of smoking (OR = 0.97, 95% CI: 0.95 to 0.99, β coefficient = -0.02, p = 0.03) were factors that respectively showed a direct and an inverse significant association with PLE.
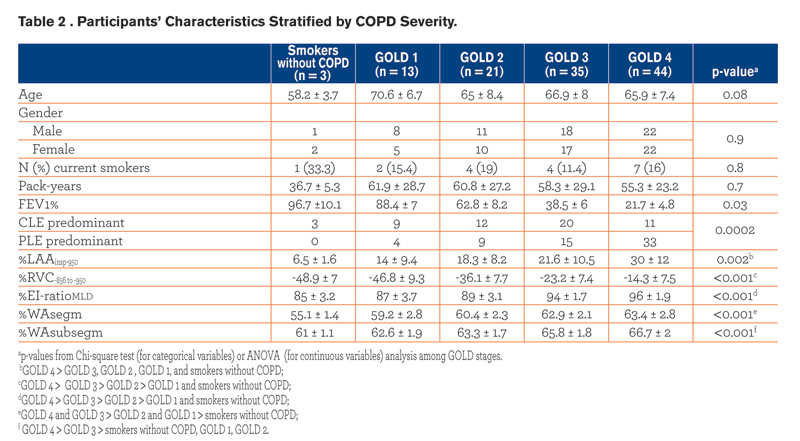 Demographics, pulmonary function test results, smoking history and radiologic data of the study population are summarized against GOLD stages in Table 2. The frequency of CLE and PLE across GOLD stages was different (p = 0.0002), with PLE being strikingly more frequent in individuals with GOLD 4. Specifically, we found that PLE was more frequent than CLE in combined GOLD 3-4 stages (p = 0.01), whereas PLE and CLE frequencies were not significantly different in smokers without COPD compared to GOLD 1-2 stages (p = 0.3).
 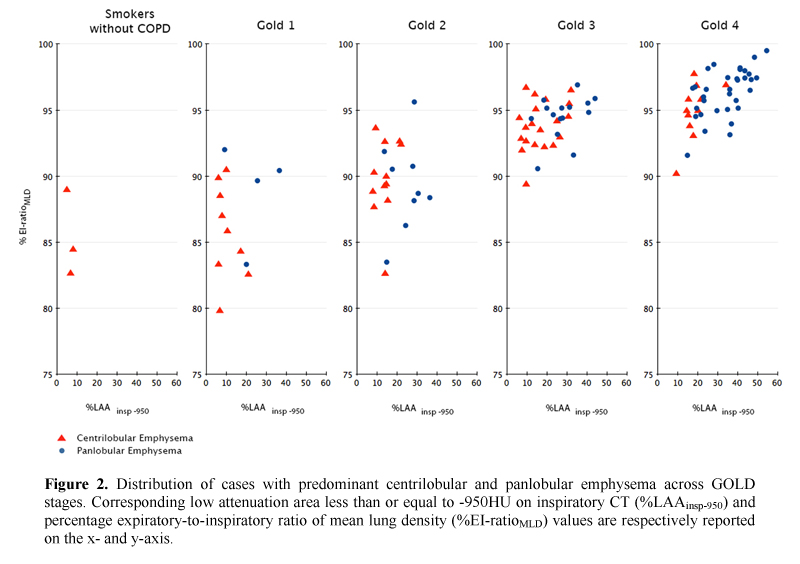 PLE was identified as the predominant pattern in 4/13 (30.8%) GOLD 1 and 9/21 (42.8%) GOLD 2 individuals; in these cases the median %LAAinsp-950,%RVC -856 to −950, %EI-ratioMLD were respectively 25.5% ± 8.6 (median %LAAinsp-950 in the whole study population = 20.5%),-33.3% ± 7.7 (median %RVC -856 to −950 in the whole study population = -23%), and 89.6% (median %EI-ratioMLD in the whole study population = 94.2%). All QCT indexes increased with increasing COPD severity (Fig. 2).
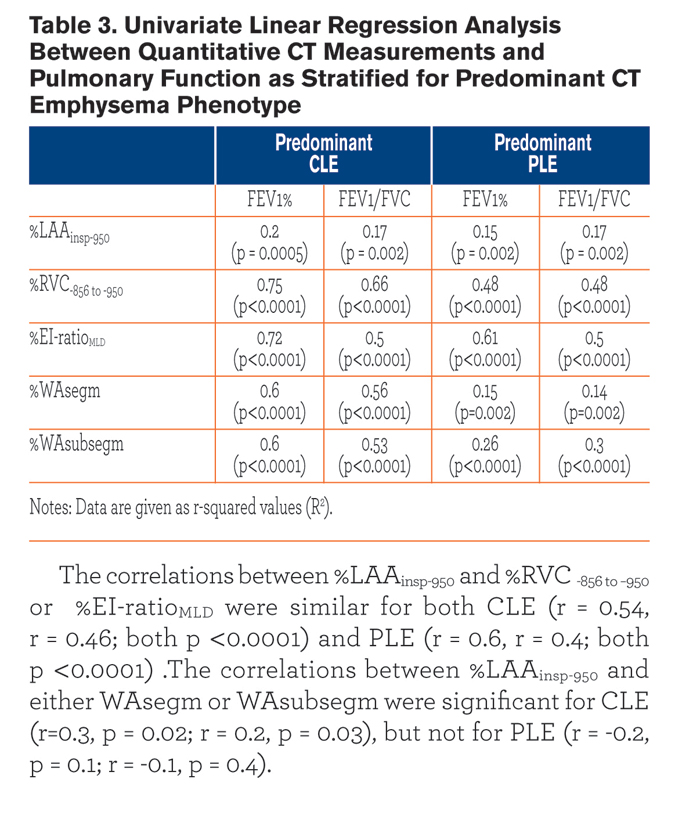
The correlations between %LAAinsp-950 and %RVC-856 to −950 or %EI-ratioMLD were similar for both CLE (r = 0.54, r = 0.46; both p <0.0001) and PLE (r = 0.6, r = 0.4; both p <0.0001) .The correlations between %LAAinsp-950 and either WAsegm or WAsubsegm were significant for CLE (r=0.3, p = 0.02; r = 0.2, p = 0.03), but not for PLE (r = -0.2, p = 0.1; r = -0.1, p = 0.4).
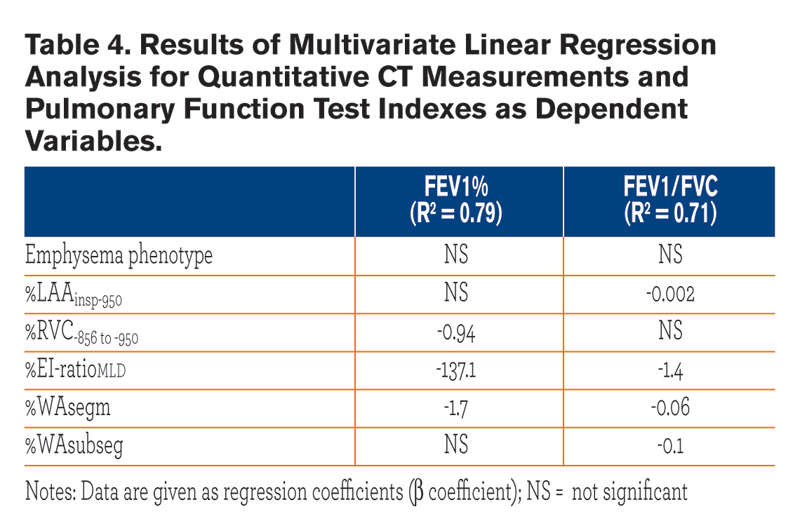
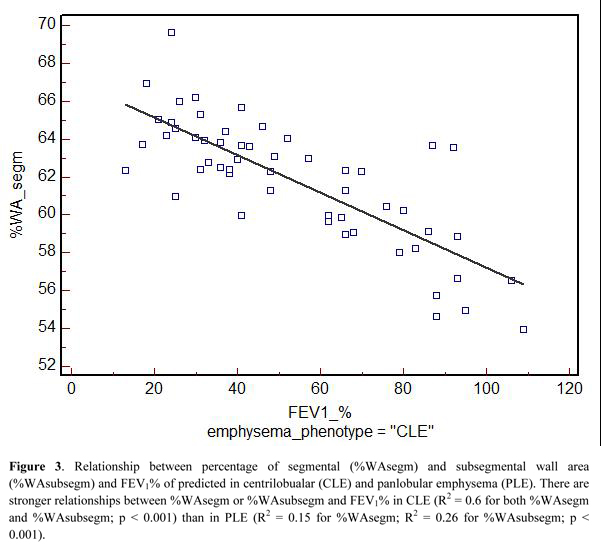
Table 3 summarizes the univariate relationships between QCT indexes and both FEV1% and FEV1/FVC. Most of these relationships were similar between the two emphysema phenotypes, but %WAsegm and %WAsubsegm were more strongly associated with both FEV1% and FEV1/FVC in CLE(R2= 0.53 to 0.6, p < 0.0001) as compared to PLE (R2 = 0.14 to 0.3, p =0.002 to < 0.0001) (Fig. 3). At multivariate analysis, both QCT gas trapping indexes and %WAsegm largely explained the variability in both FEV1%(R2 = 0.79) and FEV1/FVC (R2 = 0.71); the emphysema phenotype was not included in the predictive equation for both indexes (Table 4).
Discussion
Several observations support the hypothesis that CLE and PLE might represent different stages of the same disease in smokers: 1) whole-lung %LAAinsp-950 was greater in PLE; 2) %LAAinsp-950and %RVC -856 to −950 showed similar craniocaudal distribution in both CLE and PLE; 3) the prevalence and extent of PLE increased as COPD severity increased.
The relationships between FEV1%, FEV1/FVC , %LAAinsp-950 and either %RVC -856 to −950 or %EI-ratioMLD were also similar for CLE and PLE. Nevertheless, we reported different relationships between %LAAinsp-950, FEV1%, FEV1/FVC and bronchial metrics for CLE and PLE. Specifically, CLE displayed stronger associations between both %WAsegm and %WAsubsegm and the airflow obstruction indexes. This seems in line with previous pathologic, correlative studies that showed that in individuals with CLE, airflow obstruction was more closely related to small airway disease than to extent of emphysema whereas the opposite was true both for smoking-related and alpha-1antitrypsin deficiency-related PLE.6,21,23
 Furthermore, weak but significant correlations were observed between %WAsegm or %WAsubsegm and %LAAinsp-950 only in CLE. This finding is in keeping with that reported by Kim, et al, who found similar pathologic correlations between the emphysema extent and small airway wall thickening in CLE but not in PLE. 22 It is possible that direct CT bronchial measurements, although more proximal, might better reflect the correlative pathologic findings as compared to CT indirect indexes of small airway disease (i.e. gas trapping).
Despite the greater prevalence of PLE in GOLD 3 and 4 stages, the distinction between PLE from CLE was a factor that did not sufficiently influence the disease functional impairment as suggested by the multivariate analysis of the present study. Aziz, et al, also reported no relation between FEV1 and CT pattern of emphysema (CLE or PLE).32 Importantly, a consistent proportion of our cases with PLE had mild to moderate COPD (38.2% of combined GOLD stages 1 and 2 cases). This observation, as well as the negative relationship between PLE and pack-years of smoking and the greater prevalence of former smokers among individuals with PLE, suggests that some individuals with predominant PLE may have a stronger genetic susceptibility to emphysema or to a more rapid progression of the disease.
This study has several limitations. In keeping with prior studies, 26, 33 we obtained poor to fair inter-observer agreement levels for the visual identification of both CLE and PLE. Nevertheless, the final consensus was the median score of a large number of observers with diverse specialty training (chest radiology and pulmonary medicine), which may mitigate such scarce levels of agreement. We adopted strict classification criteria in order to identify relatively pure patterns of CLE and PLE, but this significantly reduced the size of our evaluable study population. Furthermore, although we excluded individuals with severe paraseptal emphysema, the coexistence of mild to moderate paraseptal emphysema (as categorized by the visual score) might have biased the differential analysis between CLE and PLE. Future studies might provide additional information by assessing the LAA size through the cluster analysis. This has been proven to be a better index for detection of terminal airspace enlargement that occurs in early emphysema and could be used to find other differences among the emphysema subtypes. 34 A more complete functional assessment, including measurements of either carbon monoxide diffusing capacity or lung elastic recoil, would have improved the robustness of our findings. The low prevalence of current smokers in the study cohort made impossible a robust analysis of the relationship between smoking status and emphysema CT characteristics.
We conclude that the CT pattern of PLE represents a more advanced phase of emphysema, which may show QCT features and functional relationships different than CLE. We suggest that PLE may comprise several subtypes (particularly in mild disease) in smokers, thus highlighting that QCT and visual assessments should be combined to properly evaluate COPD.
Acknowledgments
Dr. Sverzellati had full access to all of the data in the study and takes responsibility for the integrity of the data and the accuracy of the data analysis. All the Authors contributed to the creation and final approval of this manuscript. Additionally,the members of the COPDGene® CT workshop group who visually evaluated the CT scans are as follows: R. Graham Barr, MD, DrPH, Eugene A. Berkowitz, MD, PhD, Francesca Bigazzi, MD, Frederick Bode, MD, Jessica Bon, MD, Russell P. Bowler, MD, PhD, Caroline Chiles, MD, James D. Crapo, MD, Gerard J. Criner, MD, Jeffrey L. Curtis, MD, Chandra Dass, MD, Asger Dirksen, MD, MS, Mark T. Dransfield, MD, Goutham Edula, MD, Leif Erikkson, MD, PhD, Maya Galperin-Aizenberg, MD, Warren B. Gefter, MD, David S. Gierada, MD, Jonathan Goldin, MD, PhD, Philippe A. Grenier, MD, MeiLan K. Han, MD, MS, Nicola A. Hanania, MD, MS, Nadia N. Hansel, MD, MPH, Francine L. Jacobson, MD, MPH, Hans-Ulrich Kauczor, MD, Vuokko L. Kinnula, MD, PhD, David A. Lipson, M.D., William MacNee, MBChB, MD, Barry J. Make, MD, A. James Mamary, MD, Howard Mann, MD, Nathaniel Marchetti, DO, Mario Mascalchi, MD, PhD, James R. Murphy, PhD, David Naidich, MD, Hrudaya Nath, MD, John D. Newell, Jr., MD, Massimo Pistolesi, MD, Elizabeth A. Regan, MD, PhD, John J. Reilly, MD, Robert Sandhaus, MD, PhD, Joyce D. Schroeder, MD, Frank Sciurba, MD, Saher Shaker, MD, PhD, Amir Sharafkhaneh, MD, PhD, Edwin K. Silverman, MD, PhD, Robert M. Steiner, MD, Charlton Strange, MD, Nicola Sverzellati, MD, PhD, Joseph H. Tashjian, MD, Edwin JR van Beek, MD, PhD, Lacey Washington, MD, George R. Washko, MD, Gloria Westney, MD, MS, Susan A. Wood, PhD, Prescott G. Woodruff, MD, MPH.
Declaration of Interest
No conflict exists for any author
Role of Sponsors
The sponsors had no role in the design of this study, collection and analysis of data, or in the preparation of the manuscript.