Running Head: CT Findings in Nonobstructed Spirometric Smokers
Funding support: This study was supported by a grant (NIH/NHLBI R01 HL089856 and R01 HL089897) from the Genetic Epidemiology of COPD.
Date of acceptance: March 18, 2014.
Abbreviations: Global Initiative for chronic Obstructive Pulmonary Disease, GOLD; computed tomography, CT; interstitial lung disease, ILD; forced expiratory volume in 1 second, FEV1; forced vital capacity, FEV; GOLD-nonobstructed,GOLDU; body mass index, BMI; total lung capacity,TLC; diabetes mellitus, DM; ground glass opacity, GGO; qualitative CT, QCT; Hounsfield units, HU: emphysema index, EI%; wall area percentage, WA%; luminal area, LA; standard deviation, SD; pulmonary function test, PFT
Citation: Kim SS, Yagihashi U, Stinson D, et al. Visual assessment of CT findings in smokers with nonobstructed spirometric abnormalities in the COPDGene® study. Chronic Obstr Pulm Dis. 2014; 1(1): 88-96. doi: http://doi.org/10.15326/jcopdf.1.1.2013.0001
Chronic obstructive pulmonary disease (COPD) is a progressive and debilitating lung disease and an important cause of morbidity and mortality, characterized by airflow limitation that is not fully reversible after administration of bronchodilators, according to the Global Initiative for chronic Obstructive Lung Disease (GOLD) and other guidelines.1-3 The spirometric definition of COPD typically requires a ratio of forced expiratory volume in 1 second to forced vital capacity (FEV1/FVC) of less than 0.7. However, it has been determined that within cohorts of cigarette smokers, about 8-14% of individuals present with a normal FEV1/FVC ratio, but a reduced FEV1.4-6 A recent study comparing this group, called GOLD-nonobstructed (GOLDU), with spirometrically normal smokers demonstrated that GOLDU status was associated with increased body mass index (BMI), reduced total lung capacity (TLC), higher rates of non-white individuals and diabetes mellitus (DM), as well as increased bronchial wall thickness; however, substantial heterogeneity within this group was observed.7 GOLDU individuals are usually regarded as having restrictive lung disease, but many individuals have total lung capacity values within the normal range. Individuals with nonobstructed spirometric abnormalities have not been fully characterized by imaging, and it remains unclear how these individuals are radiologically different from smokers with normal FEV1 values. 4,6,8,9 Therefore, the purpose of our study was to identify the differences in CT findings between this GOLDU group of individuals and a control group of smokers with normal lung function.
Methods
Clinical Participants
Individuals for this study were selected from participants in the COPDGene® Study, which recruited 10,300 current and former cigarette smokers, with and without COPD, from 21 institutions.10 Non-Hispanic whites or African-Americans between the ages of 45 and 80 years with a minimum of 10 pack-years smoking history were included in the study. Exclusion criteria included pregnancy, history of significant fibrotic lung disease or diffuse bronchiectasis, previous surgical excision of at least one lung lobe (or lung volume reduction procedure), active cancer under treatment, known lung cancer, metal in the chest, and recent exacerbation of COPD. Two hundred smoking control participants and 200 GOLDU participants were randomly selected for this study, stratified so that the numbers of male and female participants were representative of the main cohort for each group. The institutional review boards from each clinical center approved the analyses of the clinical and imaging data. Individual, informed written consent was obtained from all patients.
CT Examination, Acquisition and Data Analysis
Volumetric CT scans were obtained for all participants using a standardized technique on multidetector CT scanners.10,11 The scans were obtained during deep inspiratory breath-hold at a standard CT dose, and at the end of a normal expiration (functional residual capacity) at reduced CT dose in a craniocaudal direction of the supine position. Standardized breathing instructions were provided. The typical CT parameters were as follows: submillimeter collimation (0.6-0.75 mm) and submillimeter reconstruction (thickness: 0.625-0.9 mm, interval: 0.45-0.625 mm) with both standard and high-frequency protocols, 120 kVp and 200 mAs for the inspiration scan and 50 mAs for the expiration scan.10,11 No patient received intravenous contrast medium. Anonymized DICOM CT data were transferred to the imaging core for archiving, quality assurance and quantitative analysis.
Lobe-Based Quantitative Visual Assessment of CT Images
Lobe-based visual assessment of CT images was performed by using standard reference images.12 Two radiologists performed visual assessment: reader 1 and reader 2 were chest radiologists with 8 years and 10 years of experience, respectively. The readers were blind to any clinical and functional information. Image data sets reconstructed with high spatial frequency algorithms were presented to each reader using AquariusNET (TeraRecon, Inc.). Images were presented in random order to the readers in a blinded fashion regarding disease stage. Expiratory volumetric CT images were evaluated after the inspiratory volumetric CT data and there was no time limitation for visual assessment. The CT images were visually inspected using a window width of 1500 Hounsfield units (HU) and a level of -700 HU. For the lobe-based visual emphysema assessment, readers were asked to determine the type of emphysema as normal, centrilobular, panlobular, or mixed. The extent of emphysema in each lobe was also assessed using a 6-point scale system: 0%, 1-5%, 6-25%, 26-50%, 51-75%, and above 75%. The lingula was regarded as a different lobe, resulting in 6 lobes for each case. The presence of airway changes, including bronchial wall thickening and bronchiectasis, was also determined in each lobe. The presence of centrilobular nodules, paraseptal emphysema, bullae, and mosaic attenuation pattern at inspiration CT was assessed and the presence of expiratory air trapping was also assessed by comparison of inspiration and expiration CT images. Bronchial wall thickening was visually defined by a ratio of the inner to outer lumen of less than 0.8.12 Bronchiectasis was considered present when the diameter of the inner bronchial lumen was greater than the diameter of the accompanying pulmonary artery, or when a bronchus was visible within 1 cm of the pleural surface. Centrilobular nodules were defined if more than 50% of a segment was affected. Mosaic attenuation pattern was defined when more than 25% of the lobe showed patchwork of regions of differing attenuation on inspiratory CT, excluding areas of emphysema.13 Expiratory air trapping was defined on a side by side comparison of inspiratory and expiratory CT as the presence of parenchymal area with less than normal increase in attenuation and lack of volume reduction, which involves more than 25% of the lobe, excluding areas of emphysema.13 To evaluate pulmonary parenchymal and chest wall features which might contribute to restrictive lung abnormality, the following features were evaluated: presence of atelectasis (linear, segmental, lobar), fibrotic or nonfibrotic interstitial lung disease (ILD), including ground glass opacity (GGO), reticular opacity, honeycomb cyst, presence of pleural thickening (diffuse, focal), diaphragm change (eventration, hernia), and vertebral body change (kyphosis, scoliosis). Diaphragmatic eventration was defined as a focal abnormal contour of the diaphragmatic dome. Maximal transverse and anteroposterior internal thoracic diameters (mm) were measured. The number of wedged vertebral bodies was counted. Presternal subcutaneous fat thickness (mm) was measured at the level of pulmonary trunk; if fat extended outside the field of view, the measurements were made to the edge of field of view. Diffuse pleural thickening was defined as involving more than 180 degrees of chest wall and more than 5 cm in craniocaudal direction. Focal pleural thickening was defined as involving less than 180 degrees of chest wall and less than 5 cm in craniocaudal direction.
Quantitative CT Measurements
Whole lung volumetric CT images for quantitative analysis were reconstructed using a standard algorithm. Using commercial software (Pulmonary Workstation, VIDA Diagnostics, Inc.), quantitative CT (QCT) measurements for the emphysema index (EI, %), wall area percentage (WA%), total lung capacity (TLCCT, L), and gas trapping (%) were obtained.10,14-18 The software automatically calculated the EI (%), which is defined as the percentage of lung voxels at or below -950 HU on inspiratory CT. Quantitative assessment of airway dimensions was performed in the segmental, subsegmental, and subsubsegmental generations of the following bronchial pathways: RB1 (apical segment of RUL), RB4 (lateral segment of RML), RB10 (posterobasal segment of RLL), LB1 (apicoposterior segment of LUL), LB4 (superior segment of lingula), and LB10 (posterobasal segment of LLL). In each segmental pathway, airway dimensions, including WA, luminal area (LA), and WA% were measured. The wall area percentage was defined as WA% = WA/(WA+LA) x 100.19 The mean value of the measured dimensions of the segmental, subsegmental and subsubsegmental generations of bronchi was used for statistical analysis. TLCCT was calculated as the volume of voxels of the lung and the gas trapping (%), which is defined as the percentage of lung voxels at or below -856 HU on expiratory CT, was also calculated automatically.10
Pulmonary Function Testing
Spirometry was conducted as recommended by the American Thoracic Society (ATS) by highly trained pulmonary function technicians and all spirometry data was collected using the ndd EasyOne Spirometer (Zurich, Switzerland).10,20 Each instrument was calibrated daily, and usual assurance program for equipment checks and maintenance was strictly followed. FEV1, FVC, and ratio of FEV1/FVC were evaluated, and were expressed as a percentage of predicted value. Pulmonary function tests (PFTs) were performed on average within 2 days (mean, 1.71 ± 5.9) of obtaining volumetric CT scans (median 0 day).
Statistical Analysis
Results were expressed as mean ± SD for continuous variables and as frequencies and percentages for categorical variables. With univariate analysis, differences in continuous data between the 2 groups were analyzed with t-test and categorical data were analyzed with the χ² test and Fisher’s exact test. For the binary variables, if there were disagreements between 2 independent readers, final assignments were determined through a subsequent case review and adjudication. For the continuous variables, the mean of 2 readings was used. For extent of emphysema, the median of 2 readings was obtained. Multiple logistic regression analysis was used to determine the visual and quantitative radiologic variables associated with the GOLDU status, after adjustment for age, race, gender, pack years and BMI. The total visual extent of emphysema was calculated by adding the 6-point scale scores for all 6 lobes. The inter-reader agreement of the visual CT parameters was measured with Cohen’s kappa statistics. A p-value of less than 0.05 was considered statistically significant. All statistical analyses were performed using JMP 9.0 (JMP; Cary, NC).
Results
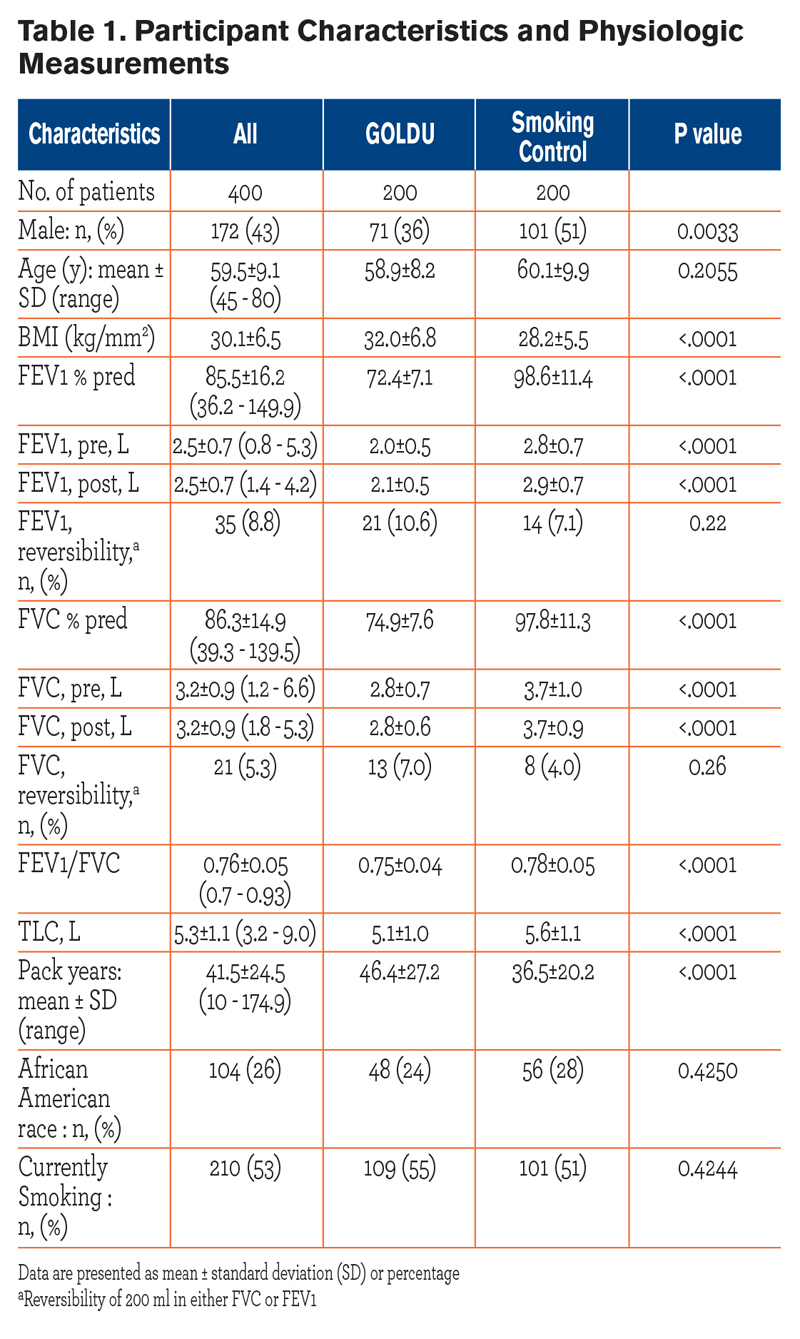 The baseline characteristics of the 400 participants are shown in Table 1. Participants were classified as GOLDU (n=200) and a control group of smokers with normal lung function (n=200). The mean age of the GOLDU participants was 58.9 years ± 8.2 standard deviation (SD), including 71 male (mean age, 58.8 years ± 7.8) and 129 female (mean age, 58.9 years ± 8.5) participants. The mean age of the control group participants was 60.1 years ± 9.9, including 101 male (mean age, 59.5 years ± 10.3) and 99 female (mean age, 60.7 years ± 9.6) participants. Compared to the control group participants, GOLDU particpants had significantly lower mean values of FEV1 percent predicted, FVC percent predicted, FEV1/FVC ratio and had significantly greater pack years of smoking and a higher mean BMI (all P < 0.0001).
Comparison Between GOLDU and Control Group Regarding Parenchymal Abnormalities
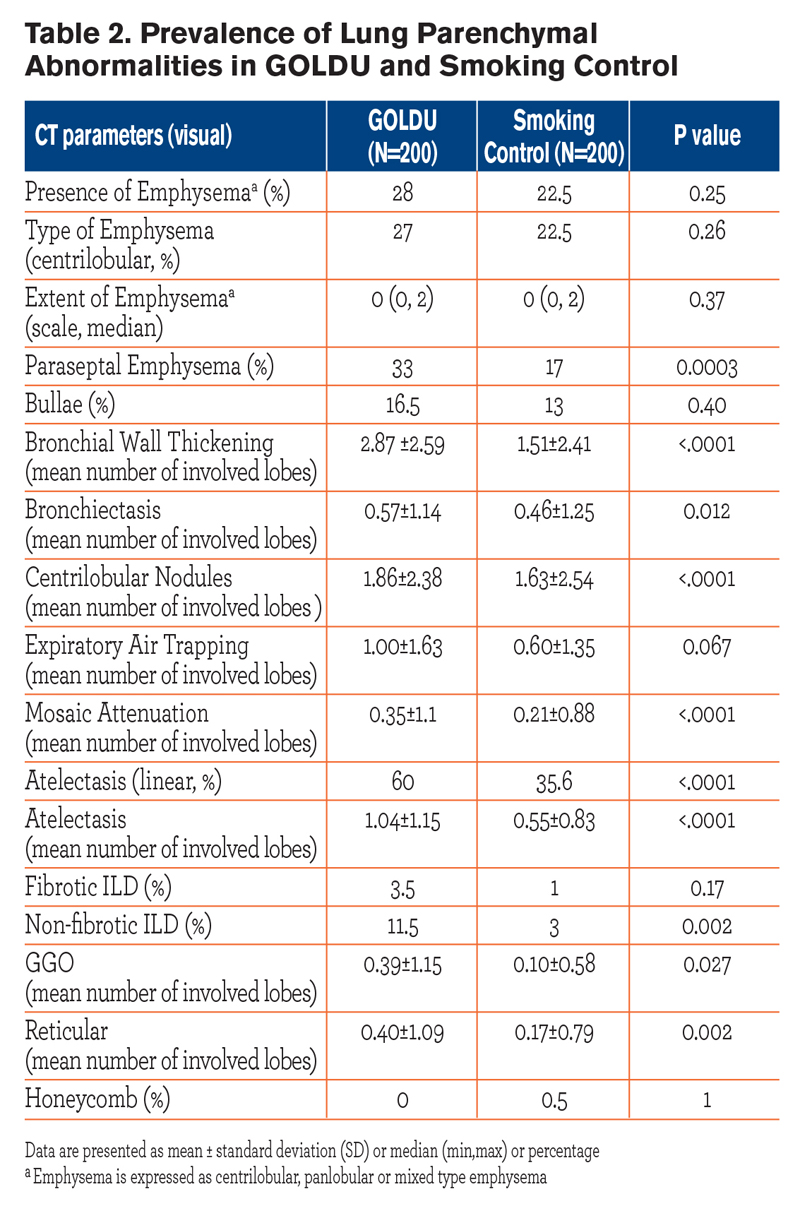
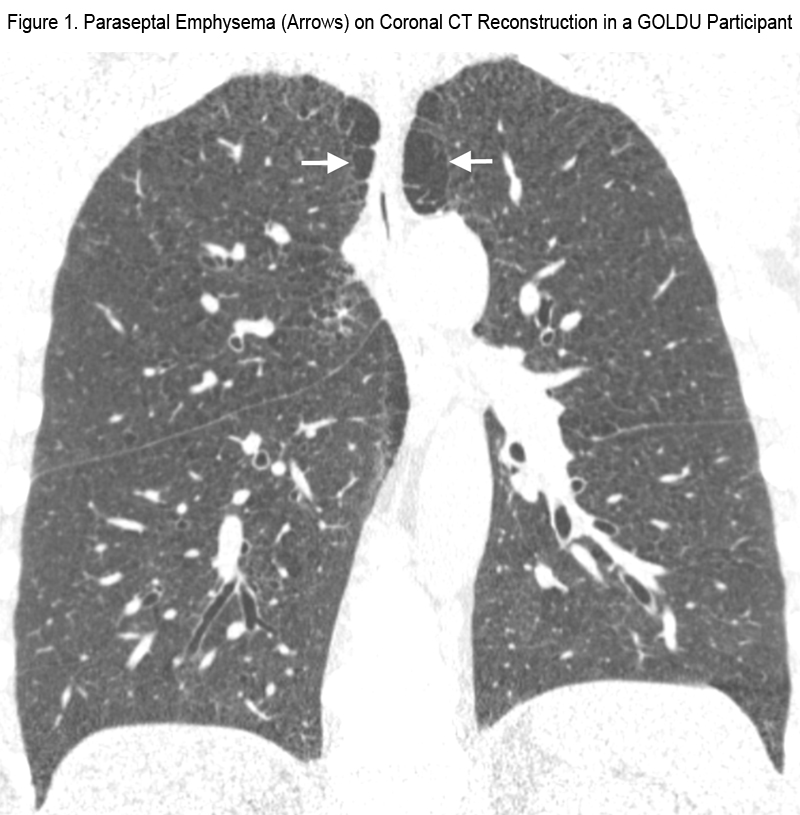
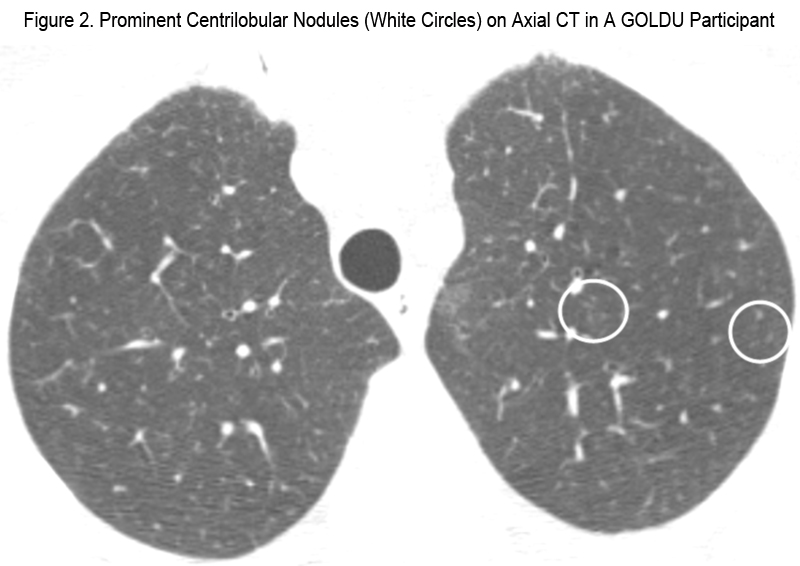
The results of comparison between the GOLDU group and the control group for CT parameters related to lung parenchymal abnormalities are shown in Table 2. Compared to the control group, GOLDU individuals had significantly greater prevalence of paraseptal emphysema (Figure 1), linear atelectasis, and non-fibrotic ILD and had a greater number of lobes involved by bronchial wall thickening, bronchiectasis, centrilobular nodules (Figure 2), mosaic attenuation, atelectasis, GGO, and reticular opacities (all P < 0.05). However, the prevalence of centrilobular emphysema, bullae, fibrotic ILD, honeycombing cysts and extent of emphysema and expiratory air trapping was not significantly different.
Comparison Between GOLDU and Control Group Regarding Chest Wall Abnormalities
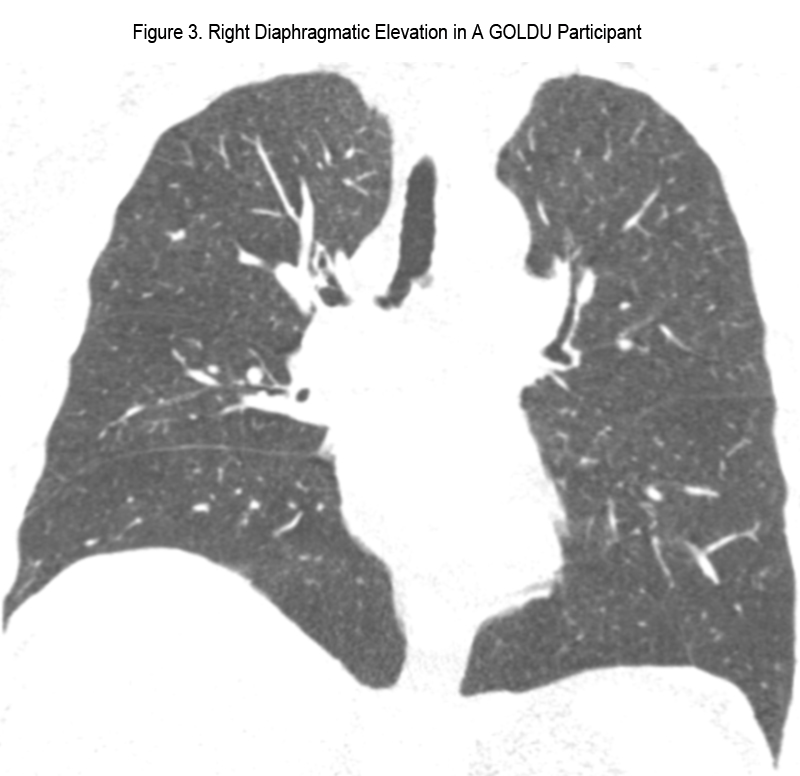
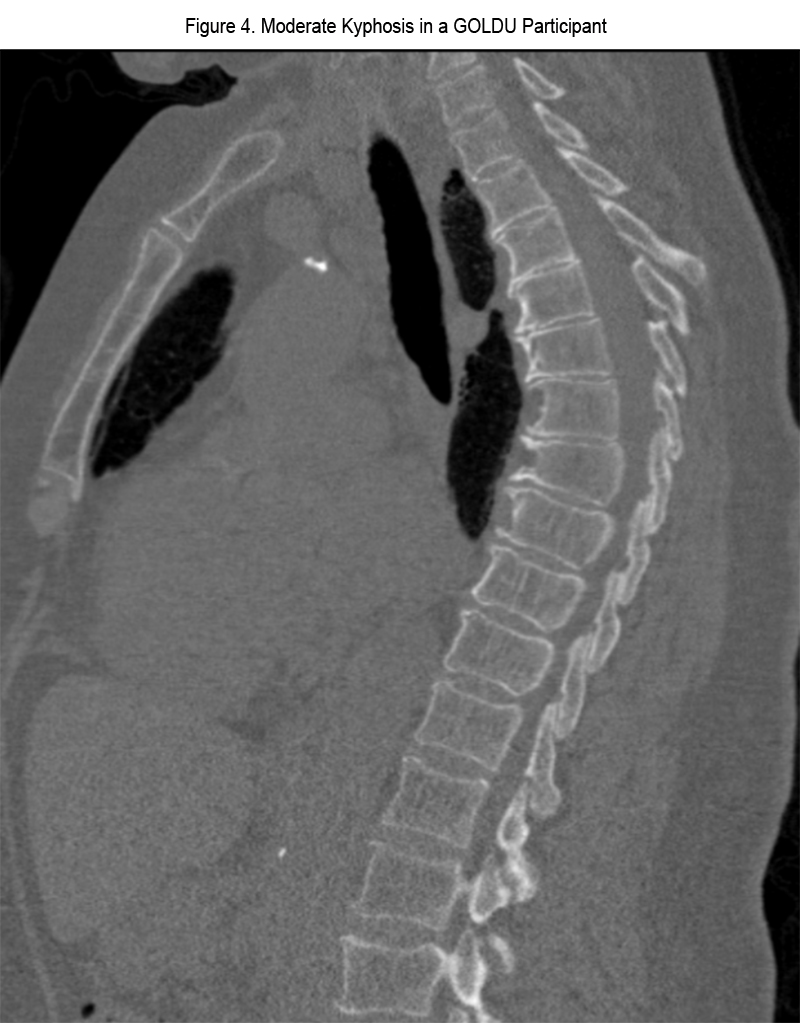
Regarding the measurement of the subcutaneous fat thickness, in one case within the control group and 3 cases in GOLDU, measurements were restricted by the edge of field of view. The results of comparison between GOLDU and the control group regarding chest wall abnormalities are shown in Table 3. Compared to the control group, GOLDU participants had a significantly higher prevalence of diaphragmatic eventration (Figure 3) and kyphosis (Figure 4) (all P < 0.01). GOLDU participants had narrower transverse internal thoracic diameter and thicker subcutaneous fat than those of control group participants (both P < 0.0001). There were no prevalence differences in scoliosis, vertebral body wedging, and total involved number of vertebral body wedging.
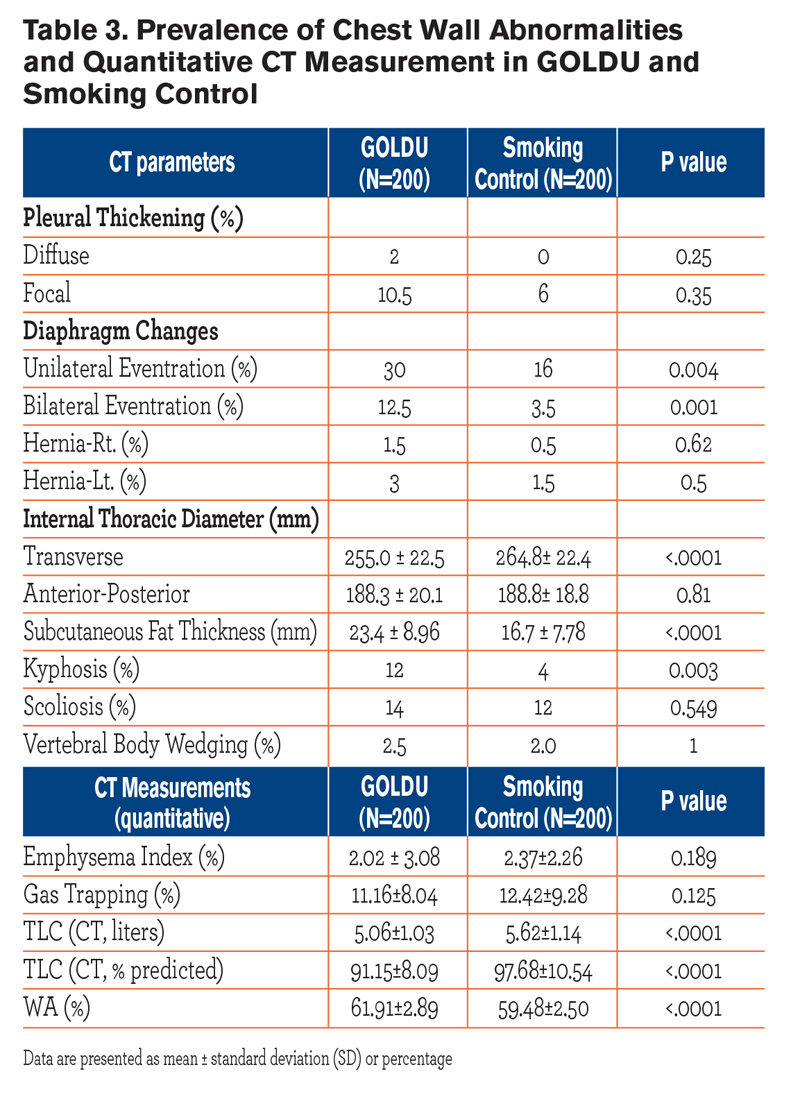
Comparison Between GOLDU and Control Group Regarding QCT Measurements
The results of comparisons between GOLDU and the control group for QCT parameters are shown in Table 3. Compared to the control group, GOLDU participants had significantly lower TLCCT (L) and higher WA% (all P < 0.0001), but none of the individuals in either group showed TLCCT less than 80% predicted. There were no differences in EI (%) and gas trapping (%) between the GOLDU and control groups.
Significant Imaging Features Associated With GOLDU
After adjusting for age, race, gender, pack years, and BMI, multiple logistic regression analysis showed that significant features associated with GOLDU were the presence of paraseptal emphysema, linear atelectasis, diaphragmatic eventration, greater number of lobes involved in bronchial wall thickening, bronchiectasis, centrilobular nodules, mosaic attenuation, atelectasis, narrower transverse internal thoracic diameter, and thicker subcutaneous fat (all P < 0.05, Table 4). 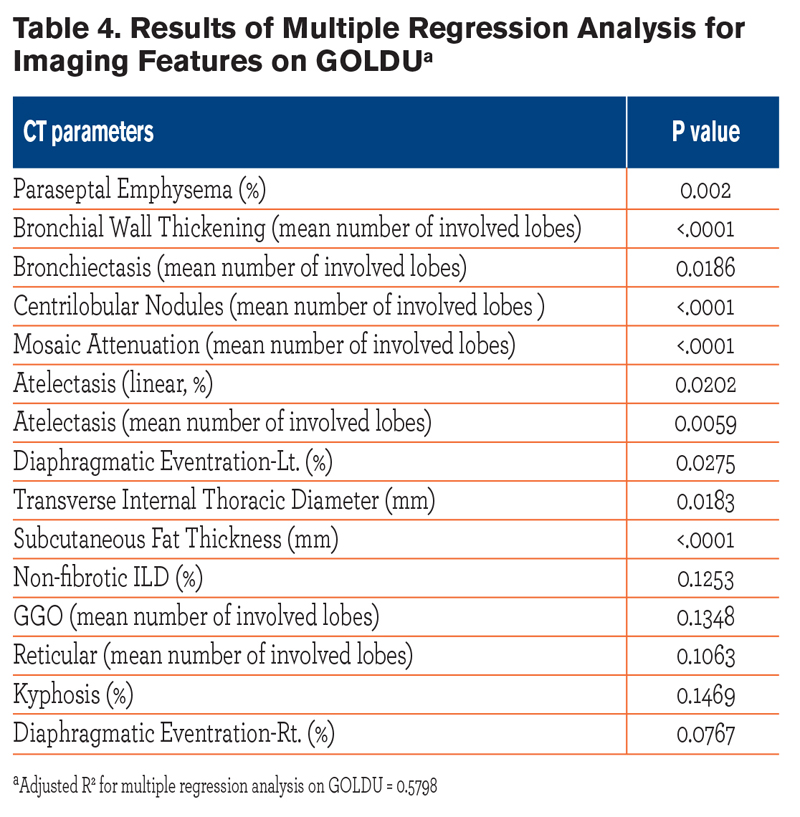 Presence of non-fibrotic ILD, kyphosis, extent of GGO and reticular opacities, were not independently associated with the GOLDU group. Multivariate analysis suggested that the number of lobes involved in bronchial wall thickening, centrilobular nodules, linear atelectasis, and diaphragmatic eventration all were associated with reduction of TLCCT (all P < 0.05). However, paraseptal emphysema, bronchiectasis, and mosaic attenuation did not show significant associations. One hundred and fifty-eight participants (79%) among the GOLDU group had one radiologic finding that could contribute to pulmonary restriction such as fibrotic or non-fibrotic ILD, GGOs, reticular abnormalities, atelectasis, diffuse or focal pleural thickening, or eventration of diaphragm compared with 103 participants (52%) in the control group.
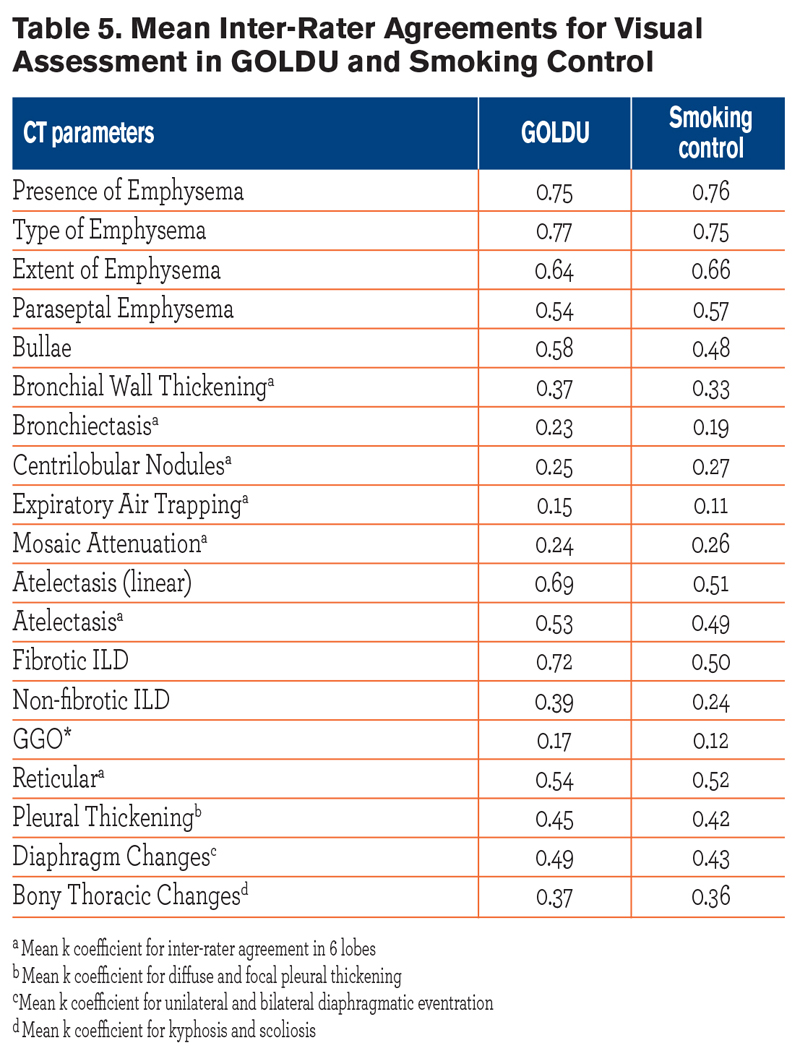
Inter-rater agreements for visual assessment in GOLDU and smokers with normal lung function are shown in Table 5.
Discussion
In this study, we demonstrated that in the GOLDU group, radiologic features including parenchymal lung disease, as well as chest wall abnormalities, were present and could be discriminated from those of the control group of smokers with normal lung function. These findings could be helpful in explaining the unique physiologic features in GOLDU.
Reduced FEV1 or FVC in the setting of a preserved FEV1/FVC ratio is usually regarded as a restrictive pattern on spirometry. In keeping with this, GOLDU participants in our study showed significantly lower TLCCT when compared with the control group participants. Despite having lower TLC values than control participants, none of the GOLDU participants had TLC values below 80% predicted. In general, reduced TLCCT may be due either to intrinsic lung disease causing increased lung stiffness, or abnormalities of the chest wall, pleura, diaphragm, abdomen, or thoracic bony cage which affect ventilation. This study demonstrated that the GOLDU participants show not only higher prevalence of parenchymal abnormalities (paraseptal emphysema, atelectasis, non-fibrotic ILD, bronchial wall thickening, bronchiectasis, centrilobular nodules, mosaic attenuation, GGO, and reticular opacities), but also a higher prevalence of non-pulmonary findings, including diaphragmatic eventration, kyphosis, narrower transverse internal thoracic diameter and thicker subcutaneous fat. Furthermore, all of these findings, except GGO, reticular opacities of non-fibrotic ILD, and kyphosis, remained as significant and independent predictors after adjusting for age, race, gender, pack years, and BMI. These covariates were chosen because they are known to affect pulmonary function.7
In previous studies, decreased FEV1 and FVC with resultant preservation of the FEV1/FVC ratio has been related to obesity with increased BMI.21-24 In our study, the significantly increased subcutaneous fat thickness in the GOLDU group relative to that of the control group may suggest the importance of obesity as a cause of pulmonary restriction. However, high BMI alone does not account for the reduction of FEV1 and FVC in the GOLDU group. 22,23
Several studies have shown that WA% is related to BMI and WA% varies significantly by race and sex.25,26 In our study, even after adjustment for age, sex, and BMI, the GOLDU group had a higher number of lobes involved in bronchial wall thickening on visual assessment and increased WA% on QCT than the control group. This may reflect a higher prevalence of bronchial inflammation or remodeling in the GOLDU group. The finding of paraseptal emphysema as a significant independent, associated factor with GOLDU status is interesting. We speculate that paraseptal emphysema may act as a space-occupying lesion in the lung parenchyma, maybe with resultant decrease in TLC in contrast to the airway obstruction found in centrilobular and panlobular emphysema. The presence of centrilobular nodules and mosaic attenuation, both markers of small airways disease, in GOLDU participants suggests that small airways disease may sometimes be associated with restrictive physiology. Although smoking and COPD would more likely be associated with flattening of diaphragm, in our study, unilateral and bilateral diaphragmatic eventrations were significantly associated with GOLDU status on univariate analysis, and they persisted as an independently associated factor on multivariate analysis. This finding suggests that eventration may contribute importantly to pulmonary restriction and should be reported when found. The novel finding that the internal transverse thoracic diameter, but not the anteroposterior diameter, was associated with GOLDU status suggests that transverse narrowing of the chest wall may also contribute to pulmonary restriction.
Physiologically, decreased FEV1 with preservation of FEV1/FVC in GOLDU may be caused by volume derecruitment in alveoli during forced expiration. However, there were no significant differences in gas trapping index (%) between both groups, although we did not compare the gas trapping index (%) lobe-by-lobe in 6 regions of the lung.
Our study has some limitations. First, inter-rater agreements for visual assessment in GOLDU and smokers without COPD were variable and relatively low (kappa coefficient range: 0.23-0.69), especially in factors found to be different between the 2 groups, identified in adjusted analysis. However, when we consider the nature of lesions such as bronchiectasis, bronchial wall thickening, centrilobular nodules, and mosaic attenuation, these lesions were relatively subtle lesions compared to those in far advanced COPD and were liable to be subjective in radiologists’ readings. Despite the relatively low inter-rater agreements, the values were very similar in both groups, suggesting that the suggested significant imaging features associated with GOLDU might reflect the true differences by disease state rather than bias of radiologist’s adjudication. Second, although standardized breathing instructions were employed, it is possible that participants were unable or unwilling to perform an adequate inspiration, which may have contributed to decreased TLC in the GOLDU participants. Third, inability to measure subcutaneous fat thickness in all cases (because of field of view restriction) is a further limitation.
In our study, we demonstrate that there were variables influencing disease processes identifiable on CT, which may also affect the results in FEV1 and FVC. Under the current COPD criteria staging system, based on the results of spirometry, the heterogeneity of GOLDU may not be appreciated well in the diagnosis and treatment of COPD patients. Even though our results showed various meaningful CT parameters in the GOLDU participants, a new GOLD staging system will be needed for allowing the identification of GOLDU individuals having more than one concurrent disease process.27
Conclusion
In cigarette smokers, chest wall abnormalities and parenchymal lung disease, which contribute to restrictive physiologic impairment, are associated with GOLD-nonobstructed status.
Acknowledgements
The authors wish to gratefully acknowledge the volunteers who participated in the COPDGene® study.
Declaration of Interest
No conflicts of interest