Running Head: Health Status and Symptom Level in COPD
Funding Support: The Adelphi Respiratory Disease Specific Program is an independent survey supported by a number of pharmaceutical companies including Novartis Pharmaceuticals Corporation. This analysis was supported by Novartis Pharmaceuticals Corporation.
Date of acceptance: March 23, 2016
Abbreviations: chronic obstructive pulmonary disease, COPD; COPD Assessment Test, CAT; EuroQoL5-diminsions, EQ-5D-3L; Jenkins Sleep Evaluation Questionaire, JSEQ; Clinical COPD Questionaire, CCQ; St. George’s Respriatory Questionaire, SGRQ; Global initiative for chronic Obstructive Pulmonary Disease, GOLD; modified Medical Research Council, mMRC; Disease Specific Program, DSP; cardiovascular, CV; congestive heart failure, CHF; standardized mean difference, SMD; body mass index, BMI; gastroesophageal reflux disease, GERD; standard deviation, SD; inhaled corticosteroid, ICS;long-acting β2-agonist, LABA; long-acting muscarinic antagonist, LAMA; short-acting β2-agonist, SABA; short-acting muscarinic antagonist, SAMA
Citation: Marvel J, Yu T-C, Wood R, Small M, Higgins VS, Make BJ. Health status of patients with chronic obstructive pulmonary disease by symptom level. Chronic Obstr Pulm Dis. 2016; 3(3): 643-652. doi: http://doi.org/10.15326/jcopdf.3.3.2015.0177
Introduction
Symptoms of chronic obstructive pulmonary disease (COPD) negatively affect patient health status. 1-3 Common COPD symptoms include dyspnea, chronic cough, sputum production, wheezing, and chest tightness. Symptoms are heterogeneous among patients and across stages of disease severity. 2,4 In individual patients, symptoms may fluctuate with the time of day. 5
Reduced health status is thought to be related to COPD symptoms and functional impairments. 2 In the current literature, evidence demonstrating an association between greater COPD symptom burden and reduced health status is sparse. However, considerable evidence does support a relationship between increased COPD exacerbation frequency and reduced health status. 6-8 For example, in a study of 486 patients with COPD, it was established that health status, measured by the COPD Assessment Test (CAT) and the Clinical COPD Questionnaire (CCQ), is strongly related to exacerbations, and in a study of 70 patients, health status measured by the St. George’s Respiratory Questionnaire (SGRQ) strongly correlated with exacerbation frequency. 6,7
The goals of prescription treatment for COPD are to improve symptoms, reduce future exacerbations, and improve health status. 2 However, many patients continue to experience symptoms, even when receiving standard of care treatment. 9 In addition, patients who have symptoms or who experience frequent exacerbations receive suboptimal treatment, 10,11 which is often attributed to inadequate physician adherence to established guidelines. 12,13 The current Global initiative for chronic Obstructive Lung Disease (GOLD) strategy provides recommendations for a multi-component evaluation of patients with COPD, including symptom assessment with the CAT or the modified Medical Research Council (mMRC) questionnaire, the severity of the spirometric abnormality, and the patient’s history of exacerbations as a risk factor for future exacerbations. This paradigm classifies patients into 1 of 4 groups (A through D). 2 The 2015 GOLD document advocates symptom assessment with validated tools such as the CAT questionnaire, CCQ, or mMRC dyspnea scale. 2 The CAT is a validated and reliable 8-item, patient-completed questionnaire that measures a wide range of COPD symptoms (cough, phlegm, chest tightness, breathlessness, activities, confidence, sleep, and energy), with a severity score ranging from 0 to 40 (higher score indicating worse health status). 14 The CAT is simpler and requires less time to complete to assess health status in everyday clinical practice compared with the SGRQ. 15,16
The GOLD strategy recommends a CAT threshold score of ≥10 for classifying patients with a high symptom burden. 2 However, several reports have shown that a large proportion of patients have a CAT >10, 17-20 and it was recently shown that after alignment of the CAT with the mMRC dyspnea scale, a CAT threshold score of ≥24 provided categorization of symptoms better aligned with the mMRC. 21 Using a threshold score that has better alignment with another measure for symptom evaluation, such as the mMRC, gives greater confidence that patients are being categorized into symptom groups that accurately reflect their true symptom burden. 21
A greater understanding of the relationship between a patient’s health status and overall symptom profile is needed, including assessment of sleep disturbance, because the majority of patients with COPD experience sleep disturbances. 22 Such an understanding is important to health care providers, because they can use this information to individualize treatment to optimize a patient’s health status. 23 Patients will also benefit because they may be better informed about treatments that can improve their symptoms and disease control. 9 Information regarding the means to improve COPD is also critical for payers because improved health status may lead to decreased resource utilization (e.g., fewer hospitalizations for exacerbations). 24 We therefore sought to examine the real-world differences between patients with a higher level of symptoms and patients with a lower level of symptoms, as determined by the CAT 24 threshold, and to evaluate the relationship of symptom burden (high and low) with general health status using the EuroQol 5-dimensions (EQ-5D-3L) questionnaire 23 and sleep disturbance using the Jenkins Sleep Evaluation Questionnaire (JSEQ). 25 Given that the goals of treatment are to alleviate symptoms and improve health status, 2 we also evaluated the types of treatment patients were receiving.
Methods
Study Design
Data from 3 cross-sectional surveys of patients with COPD and treating physicians in the United States participating in the Adelphi Respiratory Disease Specific Program (DSP) from 2011–2013 were used for this analysis. A complete description of the methods used by the DSP has been previously published. 26 Screening and recruitment of physicians were performed to obtain a group representative of the U.S. population. Participating primary care physicians and pulmonologists provided clinical data (demographics, comorbidities, and treatment) on their next 5 patients with COPD who presented for routine care. Patients were ≥40 years of age with a diagnosis of COPD.The surveys were conducted in a manner consistent with the principles of the Declaration of Helsinki. The survey was performed in full accordance with the U.S. Health Insurance Portability and Accountability Act of 1996. 27 Patients provided written informed consent before participation.
These same patients were invited to complete a self-administered questionnaire, which included the CAT (described above), the EQ-5D-3L, and the JSEQ. The EQ-5D-3L is a valid and reliable measure of health status, for which each of 5 domains (mobility, self-care, usual activities, pain/discomfort, and anxiety/depression) receives 1 of 3 responses (no problems, some problems, extreme problems) and for which the patient rates his or her health on a visual analog scale of 0 (worst imaginable health) to 100 (best imaginable health). Scores range from −0.109 to 1, with 0 indicating death and 1 indicating complete health. 28,29 The JSEQ is a 4-item survey with each of the 4 items (trouble falling asleep, waking up several times per night, trouble staying asleep/waking too early, and waking up after usual amount of sleep feeling tired and worn out) scored as 0 (not at all) to 5 (22–31 days per month). The total score ranges from 0 to 20, with higher scores indicating greater sleep disturbance. 25 Patients included in the analysis did not have a concomitant diagnosis of asthma, and all had received inhaled COPD treatment for a minimum of 3 months.
Data Analysis
High- and Low-Symptom Patients
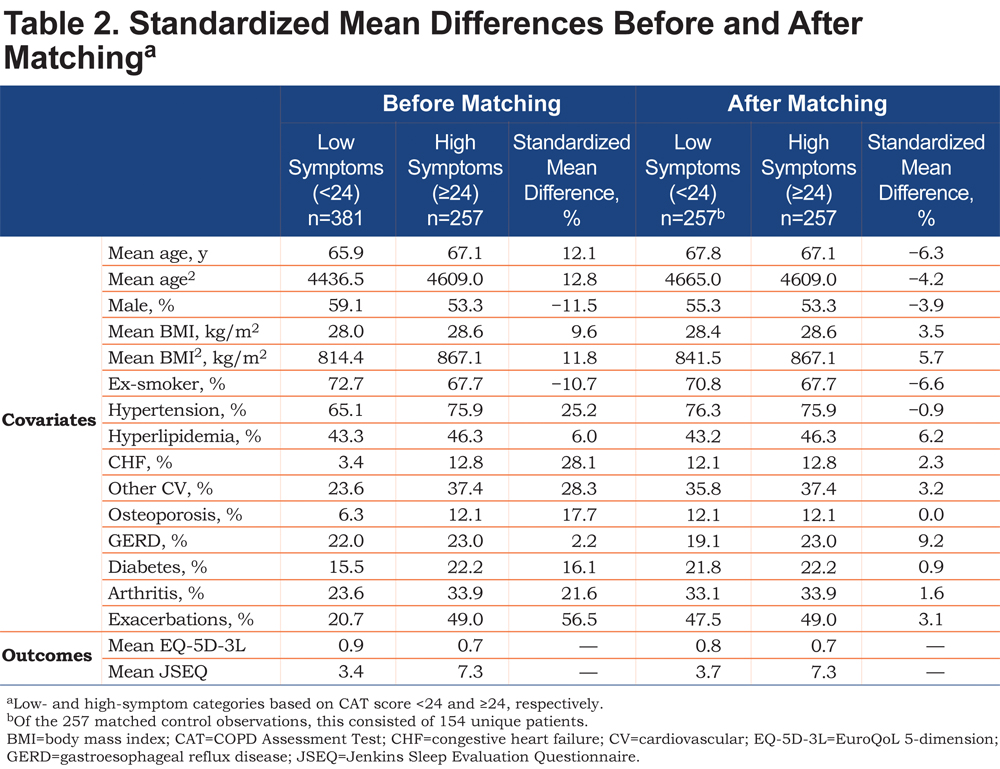
The patient population was divided into high- (CAT ≥24) and low-symptom groups (CAT <24) based on the rationale for the threshold score of 24 described above. 21 Before outcomes were compared between groups, propensity score matching 30 was performed to ensure that the 2 groups were balanced in terms of covariates known to affect symptoms and health status. The covariates available and chosen to calculate the propensity score for matching were age, sex, body mass index, smoking status, cardiovascular (CV) conditions (i.e., hypertension, hyperlipidemia, congestive heart failure [CHF], other CV conditions), other selected concomitant conditions (i.e., osteoporosis, gastroesophageal reflux disease, diabetes, arthritis), and number of exacerbations treated by primary or secondary care intervention (categorized as 0 or 1+ in the previous 12 months). Higher-order terms for numerical variables were also included. The propensity score was the probability of a patient being classified as having high symptoms. Common support (propensity score distributions) was assessed between the 2 groups to ensure that viable matches could be found in the low-symptom patient group for each high-symptom patient. High-symptom patients were then matched to low-symptom patients using 1:1 nearest-neighbor matching on the propensity score with replacement. Match balance was assessed with standardized mean differences (SMDs).After matching, the absolute value of the SMD (%) for each covariate between the high- and low-symptom patients, if well balanced, was to be <10%. The characteristics of the high- and low-symptom groups were described using summary statistics.
Outcome Assessment
For each assessment, the outcome effect was obtained by calculating the average difference between the matched pairs of high- and low-symptom patients. The Abadie-Imbens standard error and corresponding test statistic, and p value were also calculated for each outcome. Differences in current treatments received by high- and low-symptom patients after matching were assessed. Sensitivity analysis was conducted by generating Rosenbaum bounds to assess the effect an unobserved confounder could have on the results. Gamma represents the factor by which the odds of a patient being classified into the high-symptom group increased due to unobserved confounders. The higher the value of gamma, the more robust and insensitive the results are to unobserved confounders. Only patients with complete data were included in the analysis. Statistical analyses were performed in R v3.0 31 and Stata v13.1 32 statistical packages (or later versions, as made available during the analysis).
Results
Patients
A total of 456 physicians provided 1766 patient records, and of these, 638 were complete and included in the analysis. The eligible study population was smaller primarily because of patients declining to participate in the survey, and the study design required complete records from both the physician and the patient. Characteristics of eligible patients, categorized by the CAT 24 threshold, are summarized in Table 1. Overall, fewer patients in the low-symptom group had comorbidities (e.g., CV condition, osteoporosis, diabetes, arthritis) or 1 or more exacerbations requiring treatment by primary or secondary care in the past 12 months compared with patients in the high-symptom group. As expected, the distributions of propensity scores for the low- and high-symptom groups were slightly different before matching, with the high-symptom group having a higher proportion of patients scoring closer to 1 (Online Supplement Figure 1). However, the degree of overlap observed indicated that viable matches could be confidently identified.
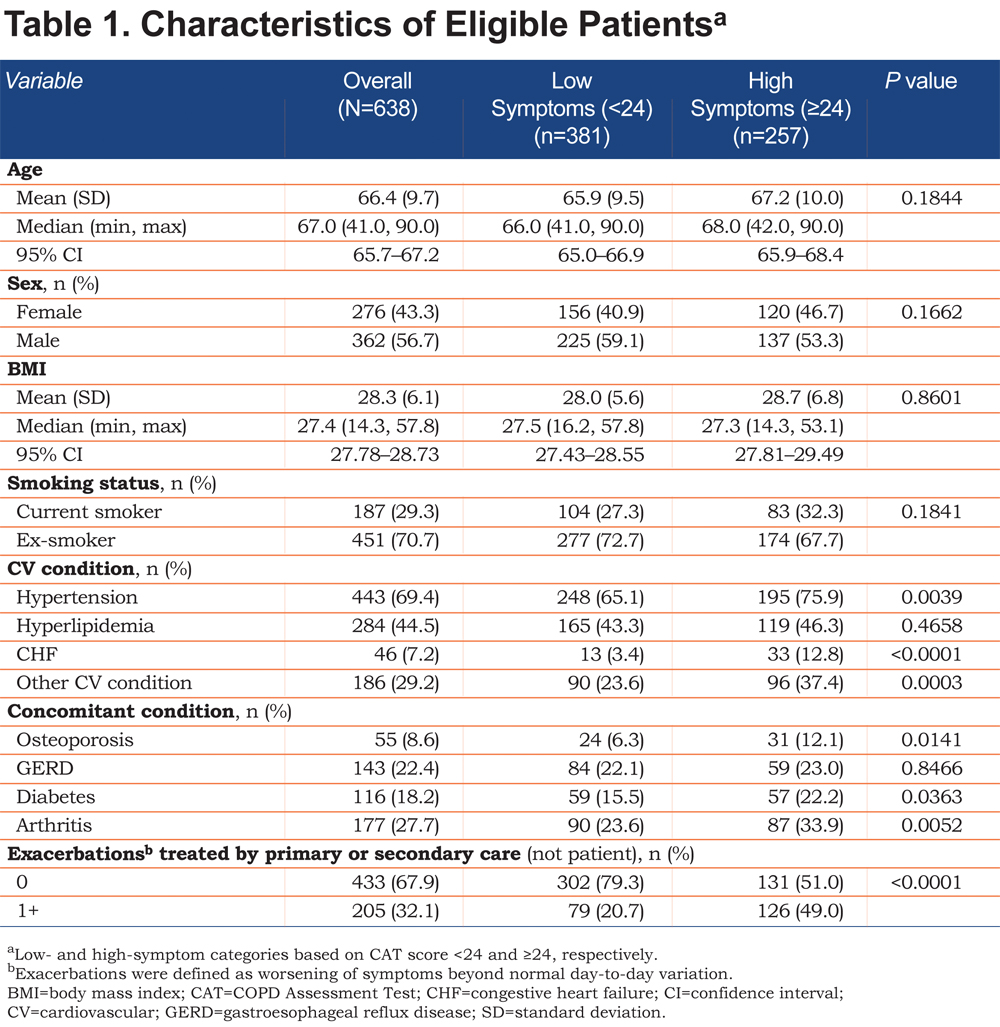
After matching, adequate balance was achieved in the 2 groups of patients. All covariates were <10% in terms of the absolute value of the SMD, the acceptable threshold (Table 2). Some of the greatest differences in the SMD before matching included exacerbations (56.5%), other CV conditions (28.3%), CHF (28.1%), and hypertension (25.2%; Table 2).
Health Status After Matching
As shown in Figure 1, after matching, COPD patients in the high-symptom group had worse health status on the EQ-5D-3L compared with those in the low-symptom group (0.71 versus 0.85, respectively [higher score indicates improved health status]), a difference of −0.14 (p<0.0001).
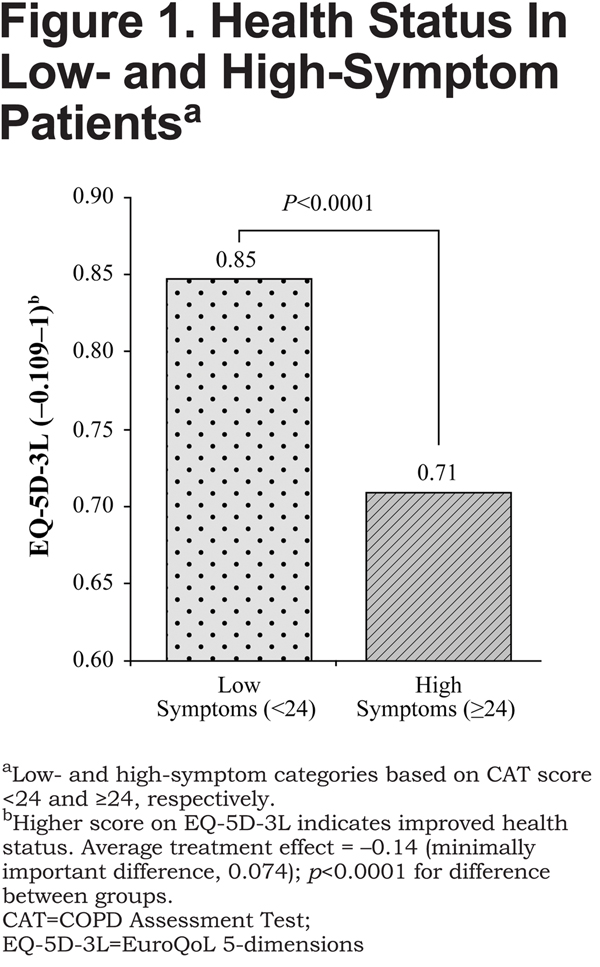
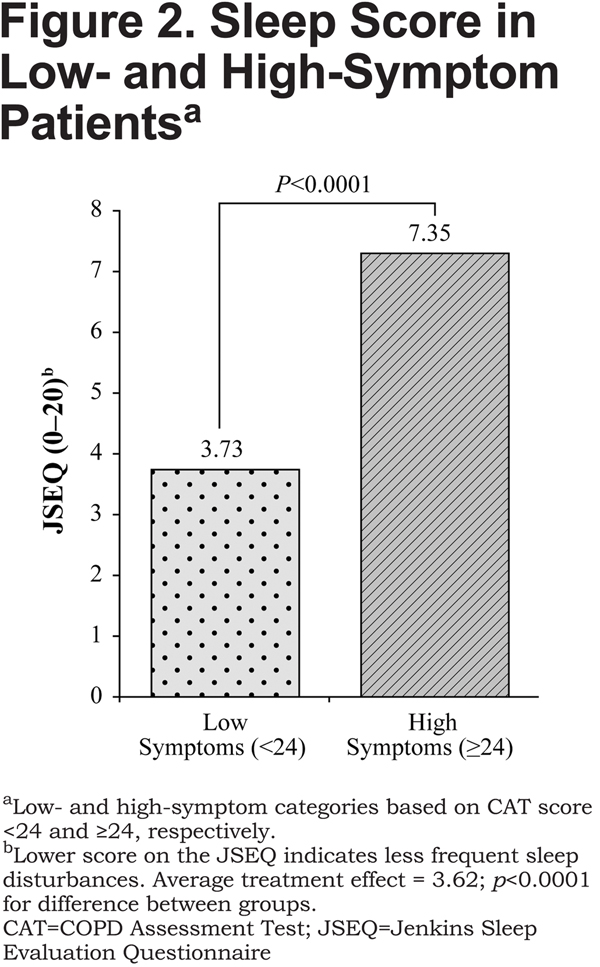
The between-group difference on the EQ-5D-3L exceeded the minimally important difference (MID), which is 0.074.33 On the JSEQ, the difference between high-symptom and low-symptom groups was 3.62 (7.35 versus 3.73, respectively [lower score indicates less frequent sleep disturbances], p<0.0001; Figure2). Sensitivity analysis indicated that the findings were strong, substantive, and insensitive to unobserved confounders, such as duration of COPD from diagnosis, that were not included in the model.
Treatment After Matching
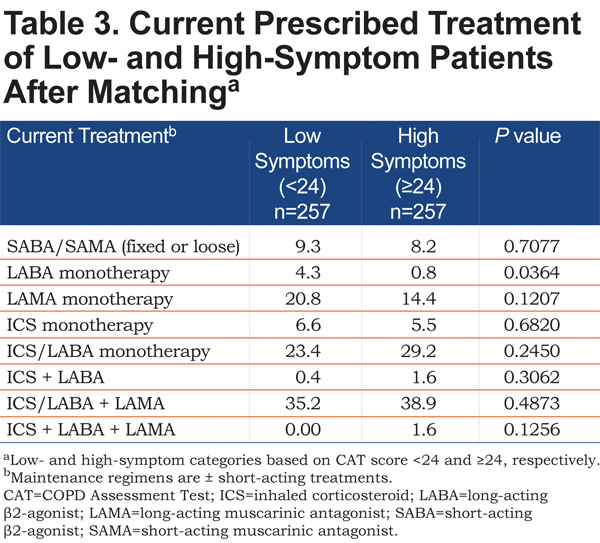
The proportion of patients with low- and high-symptoms receiving various treatment regimens after matching is summarized in Table 3. For patients in the high-symptom group, 8.2% were receiving short-acting treatment only, and 46.0% were receiving a single maintenance bronchodilator (with or without inhaled corticosteroids). Less than half (40.5%) of patients with high symptoms were receiving triple therapy with an inhaled corticosteroid, long-acting β2-agonist, and long-acting muscarinic antagonist. For patients in the low-symptom group, 9.3% were receiving short-acting treatment only, and 48.9% were receiving a single maintenance bronchodilator (with or without inhaled corticosteroids). Triple therapy was used by 35.2% of patients with low symptoms.
Discussion
The results of this analysis show that an increased magnitude of COPD symptoms, as measured with the CAT, has a significant negative impact on patients’ health status and degree of sleep disturbance, as determined by between-group differences of –0.14 and 3.62 on the EQ-5D-3L and the JSEQ, respectively. The between-group difference on the EQ-5D-3L surpassed the MID, and although no MID exists for the JSEQ, it is reasonable to consider the difference between groups on the JSEQ meaningful, because the score of the high-symptom group was almost double that of the low-symptom group. The relationship between symptom burden and health status was observed to be independent from confounding variables, which importantly included patients’ exacerbation history, owing to the propensity score matching technique used.
Patients were more evenly distributed between the low- and high-symptom groups when the CAT threshold score of 24 was retrospectively compared with a GOLD-recommended score of 10, offering a more uniform demarcation of symptom assessment without skewing the high-symptom category (Online Supplement, Figure 2). In addition, as most patients scored ≥10, as seen in previous studies, 17-20 the comparison with patients scoring <10 would have been markedly restricted. The decision to apply a CAT threshold of 24 in the current analysis, prior to results being reviewed, is also supported by Price and colleagues, who observed that this CAT threshold demonstrates better alignment to the mMRC than a cut point of 10 21 and inadvertently offers a midway point on the 0 to 40 CAT scale for symptom severity assessment in a real-world setting.
Study findings demonstrated that high-symptom patients were not receiving dual-mode bronchodilation for their COPD. Slightly more than 8% were receiving only short-acting treatment, which likely only controlled their symptoms temporarily, as and when they occurred. Their high symptom burden and association with a worsened health status might have suggested the need for a change to a long-acting option. Almost half of the patients in the high-symptom group were receiving a single maintenance bronchodilator, suggesting that they may have derived additional benefit from intensifying treatment with an additional bronchodilator. Those patients who were receiving triple therapy may also have been considered for further assessment and treatment. It may be noted that current treatment may account for a greater part of the disparity in health status and sleep quality between high- and low-symptom patients than the presence or absence of comorbidities, since propensity score matching minimized the influence of such major variables (e.g., CV disease) on outcomes.
A strength of this analysis is that it was a survey that provided real-world data from patients and physicians. This type of analysis would not be possible in a randomized controlled trial, which limits participation to approximately 5% of the COPD population because of inclusion/exclusion criteria. 34 Instead, this study is representative of COPD management in a real-world clinical setting. In addition, because it was an independent survey that is administered annually, it was not designed with a set hypothesis in mind. Compared with the CAT questionnaire, which includes one question on sleep quality, 14 the JSEQ captures several aspects of sleep quality (e.g., falling asleep and waking), 25 allowing a more in-depth analysis. As previously described, propensity score matching also achieved adequate match balance between the 2 groups and reduced potential bias by including major covariates that affect symptoms and health status (e.g., exacerbation history, CVD) in the calculation.
This analysis had several limitations. Patient inclusion was based on a diagnosis of COPD and not necessarily with reference to clinical test results or guidelines; however, this does not preclude the possibility that lung function was not previously confirmed or documented in the chart. Although it is reasonable to assume that the majority of patients were visiting their physician for COPD or another common comorbid condition, this patient sample was not necessarily representative of the overall COPD patient population;thus, the generalizability of the results to the total COPD population is not known. In addition, patients consulting their physician could represent more health conscious individuals or those with more severe COPD. Only patients who provided all necessary data points required for analysis were included, which may have resulted in unavoidable selection bias. Physician inclusion was also likely influenced by willingness to participate in the survey and practical considerations of geographic locations.The quality of the data depended on accurate reporting by physicians and patients.Inherent bias because of physician selection is also plausible. The CAT threshold score of 24, which was based on prior analysis, is also a potential limitation, because COPD populations not classified according to the CAT 10 are not validated according to the GOLD strategy. 2 With regard to medication use, treatment patterns reflect what was prescribed to the patient and not the level of adherence to the COPD medication received. In addition, this analysis did not assess other therapies that may have impacted symptoms and quality of life, such as oxygen and pulmonary rehabilitation. Future studies that assess the impact medication adherence and other therapies have on health status and sleep in patients with COPD may be beneficial, as could real-world studies evaluating physician treatment patterns and rationale for medication choices.
In conclusion, these findings indicate that increased COPD symptom burden is associated with worse health status and greater sleep disturbance, as evidenced by patient-reported responses on the EQ-5D-3L and the JSEQ. Despite having received COPD medication for at least 3 months, a large proportion of patients had a high symptom burden that negatively affected their health status. In addition, a substantial proportion of patients with high symptom burden were not receiving both available classes of bronchodilation. Thus, along with exacerbation risk assessment, monitoring COPD symptom burden consistently and tailoring treatment accordingly may ensure improved health status for each patient in real-world clinical settings.
Acknowledgments
The Adelphi authors (R. Wood, M. Small, V.S. Higgins) thank Tom Burke for his significant contributions to the design and analytical phases of this study.
Declaration of Interest
J. Marvel and T.-C. Yu are employees and stockholders of Novartis Pharmaceuticals Corporation, East Hanover, New Jersey. R. Wood, M. Small, and V.S. Higgins are full-time employees of Adelphi Real World, Macclesfield, Cheshire, United Kingdom. Medical writing services were provided by Complete Healthcare Communications, Chadds Ford, Pennsylvania with funding from Novartis Pharmaceuticals Corporation, East Hanover, New Jersey.