Running Head: Volume-controlled MDCT Repeatability
Funding Support: This study was supported in part by NIH RO1-HL-064368 and RO1-HL-112986
Date of Acceptance: March 27, 2014
Abbreviations: computed tomography, CT; total lung capacity, TLC; mean lung density, MLD; low attenuation areas, LAA; intra-class correlation coefficients, ICC; functional residual capacity, FRC; multi-detector CT, MDCT; body mass index, BMI; pulmonary function tests, PFTs; residual volume, RV; forced expiratory volume in 1 second, FEV1; slow vital capacity, SVC; univatirate volume correction, UVC; Hounsfield, HU; standard deviation, SD; relative percent difference, RPD; emphysema index, EI; limits of agreement, LoA; Subpopulation and Intermediate Outcome Measures in COPD Study, SPIROMICS; Multi-Ethnic Study of Atherosclerosis, MESA.
Citation: Iyer KS, Grout RW, Zamba GK, Hoffman EA. Repeatability and sample size assessment associated with computed tomography-based lung density metrics. 2014. Chronic Obstr Pulm Dis. 2014; 1(1): 97-104. doi: http://doi.org/10.15326/jcopdf.1.1.2014.0111
Introduction:
The ability of multi-detector computed tomography (MDCT) to quantitatively assess the extent of disease has allowed its ever-growing use in characterizing pulmonary diseases, such as COPD and asthma.1-5 The goals for designing imaging protocols for individuals rely on accurate and repeatable lung structure and function measurements that can discriminate normal anatomy, including airway and lung parenchyma, and abnormal anatomy, such as air trapped regions and emphysema-like lung. We use the term emphysema-like to describe MDCT histogram-based voxel information based upon reconstructed MDCT voxels of the lung and not actual measures of alveolar destruction.
Understanding the sensitivity of the quantitative measurements is critical to the study design when using this information to longitudinally evaluate disease progression. Lung density measurements based upon the density histogram have been useful to quantify the presence and distribution of air trapping and emphysema-like lung regions in COPD and asthma patients, but the pattern and percentage can vary even among normal participants.6 Subject differences in inspiratory and expiratory effort, scanner type, radiation dose, and reconstruction algorithms have considerable effect on quantification of regional parenchymal pathology and their association with global measures of lung function.7-10 Establishing best-case baseline repeatability, while minimizing the influence of these factors, is important for longitudinal studies and for sizing a particular study. The objective of this study was to quantify the stability of density-based parenchymal measurements in normal smokers and non-smokers imaged repeatedly on the same day using the same scanner type, imaging protocol, and image reconstruction parameters. The goal is to utilize these data to provide an understanding of sample sizes needed to effectively employ quantitative MDCT to the assessment of the lung across time.
Methods
Participants for this single-center study were recruited over a 3 year period and approved by the University of Iowa Institutional Review Board. Participants provided written informed consent to have CT scans performed. Criteria for enrollment included: 1) age between 20-90 yrs 2) body mass index (BMI) < 32 and weight < 100 kg 3) no previous research study with radiation exposure in the last year 4) normal pulmonary function tests (PFTs) (taken on the day of the study) and 5) smoker or non-smoker. All participants underwent a battery of PFTs, including body-box lung function (Collins Medical Ferraris Respiratory ver. 4.08) analyzer-based measurements of TLC and residual volume (RV) as well as spirometrically measured forced expiratory volume in 1 second (FEV1)and slow vital capacity (SVC). Following these measurements, individuals were placed in a fully reclining chair and supine FEV1 and SVC measurements were obtained using the same equipment.
CT Imaging Protocol
Thirty-seven individuals met criteria for scanning. Multi-detector row CT (MDCT) scanners, (Siemens Sensation 64 or Siemens Definition Flash 128 [110mAs, 120kV, pitch = 1, slice thickness = 0.72mm, slice spacing = 0.5mm and reconstructed voxel size ~0.62mm]), were used for all participants and scanner settings were calibrated on the day of the study. Participants performed volume-controlled breath holds, using a previously established method for volume standardization.11 Briefly, a flow-based pneumo-tachometer coupled with a computer-based monitoring system was used to monitor and occlude airflow during designated breath-holds. The participants’ SVC was measured supine on the scanner table. Using this SVC as reference, participants were asked to breath to deep inspiration and expiration 3 times and scans were then obtained at spirometrically determined 90% VC (herein referred to as total lung capacity: TLC). This was followed by a similar breathing maneuver culminating in a spirometrically-controlled expiratory scan at 20% VC (herein referred to as functional residual capacity: FRC). Because at both FRC and TLC, participants relaxed against a closed balloon valve, intra-pleural pressure was positive for the TLC maneuver and likely minimally negative for the FRC maneuver (representing the balance between chest wall recoil outwards and the lung elastic recoil inwards). After one FRC and one TLC scan was obtained, participants were then randomly scanned a third time at either TLC or FRC lung volume. Participants with 2 TLC scans were designated as the TLC repeat group and participants with 2 FRC scans were designated as the FRC repeat group. Between repeated scans, a 3-5 min stopgap was enforced, during which participants were removed from the scanner and asked to stand and then repositioned back onto the same scanner table. All scans were read and reported on for incidental findings by 2 board certified chest radiologists. CT-based inspiratory capacity was measured as the volume difference between non-repeat FRC or TLC scan and the average of the respective TLC or FRC repeat scans (TLCair – mean (FRCair) or mean (TLCair) – FRCair). This difference was regressed with seated or supine SVC measurements performed in the PFT lab as an index of the adequacy of volume control within the scanner. In addition, a univariate volume correction (UVC) strategy, similar to the one described by Park, et al,12 was utilized to determine if, even after volume controlled scanning, scan-to-scan volume corrections further reduced density variation. Scans were reconstructed using Siemens B35 reconstruction kernel with consistent fields of view, such that the chest wall tightly fit within the reconstructed volume. Scans were segmented for lungs and lobes and analyzed using Pulmonary Workstation 2.0 (VIDA Diagnostics, Iowa City, IA).
Lung Density-Based Metrics
Several density and percentile-based metrics were utilized to evaluate inter-scan repeatability, including mean lung density (MLD), 15th percentile density (P15: a density value in Hounsfield units [HU] accounting for the lower 15% of the density histogram), and low attenuation areas (LAAs: voxels percentage below a defined threshold of -856 HU [%LAA856], -910 [%LAA910], or -950 [%LAA950]). In addition, a fractal dimension score, alpha, previously used by Mishima, et al,13 to characterize the size distribution of connected voxels (holes or clusters of emphysematous regions), was also evaluated. Briefly, to calculate alpha, thresholds at -910 HU (alpha-910) and -950 HU (alpha-910) at TLC were used to identify holes (connected voxels falling below the selected threshold) and the negative of the slope of the log-log histogram plot of hole size vs. percentage of holes was used to compute alpha. The spatial variation in alpha was also assessed using the apical-basil differences in alphas (A-Balpha-910, A-Balpha-950), which was calculated by subtracting lower lobe from upper lobe alphas.
Repeatability Assessment
Measurement error between repeat scans was assessed using mean inter-scan differences and standard deviations (SD) and repeatability was assessed using intra-class correlation coefficients (ICCs), which compares the variation in our cohort to the scan-to-scan variation. ICCs for alphas were reported on a lobe-by-lobe basis. Inter-scan differences were also compared between TLC and FRC repeat groups using a t-test adjusted for multiple comparisons.
Power Calculations
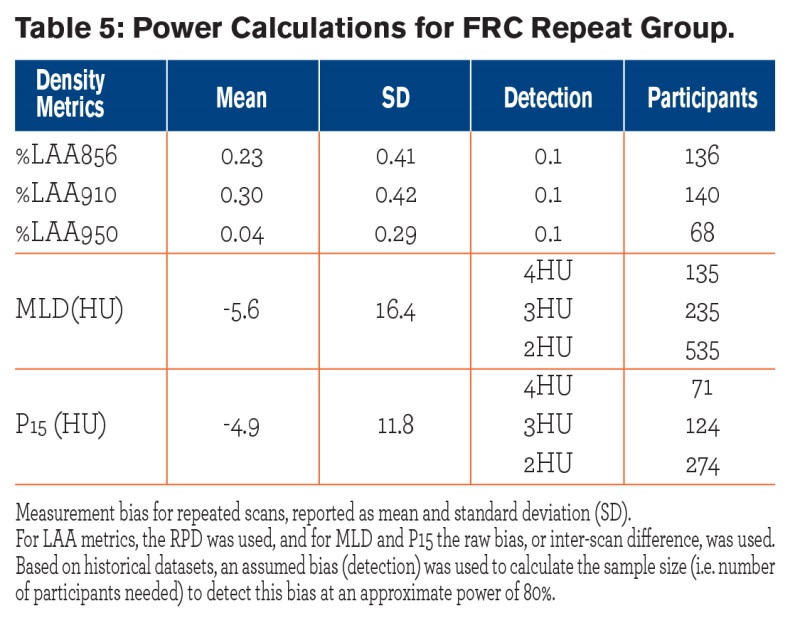
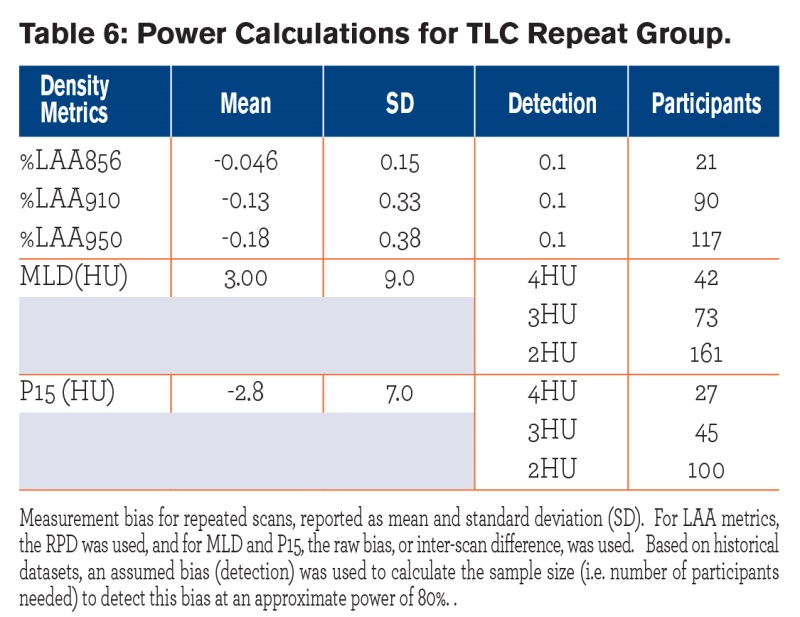
Our data sets were used to estimate mean(s) and standard deviation(s) of initial and repeat-measurement bias, and the power analyses were carried under the assumption of normally distributed data. A statistical test of normality showed that the distribution of the relative percent difference (RPD) appeared to be approximately normal for all 3 density thresholds (-856,-910 and -950 HU). Normal distributions also seemed appropriate for the rest of the variables considered. All power calculations were carried out using a significance level of α = 0.05, and based on 2-sided tests. Using clinically-meaningful, detectable change in lung density metrics (i.e. detectable based on current scanner resolution and a reasonable sample size of a few hundred individuals) from published literature14-16 and results of our repeatability analysis, we extrapolated to the number of participants needed to achieve at least 80% power to detect a typical change in lung density metrics over a short period of time. For the low attenuation area variables that we considered (%LAA856, %LAA910, and %LAA950), the power analyses utilized RPD between repeat scans. The RPD is defined as:
(S2-S1) / (1/2 x [S2+S1]), where S1 and S2 are scan and repeat scan measurements
For MLD, P15 and alpha variables, the raw biases between the 2 repeated scans were used.
Statistical Analysis
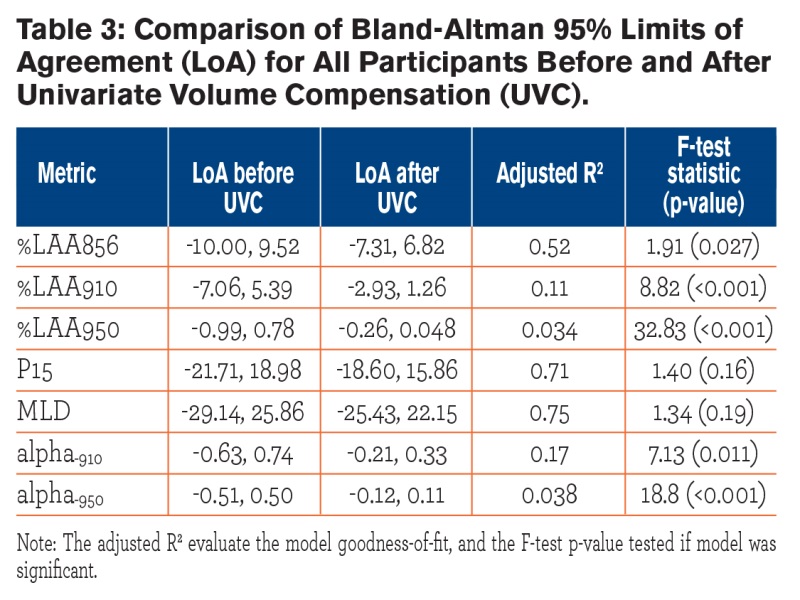
Descriptive statistics for participant characteristics, such as mean lung density, and total lung volume were computed using a commercial statistics software package, SPSS (IBM SPSS Statistics version 19, Chicago, IL). A Bland-Altman analysis was performed on the inter-scan differences before and after UVC, and 95% limits of agreement (LoA) were reported. Comparison of measurement variance before and after volume correction was assessed using the F-test statistic. Power calculations and F-tests were performed using the R statistical software (R version 2.13, R Foundation for Statistical Computing) and validated using the NCSS97 Power Analysis and Sample Size program (NCSS LLC, Kaysville, Utah). Power was computed for lung density measures for both the FRC and TLC repeat groups.
Results
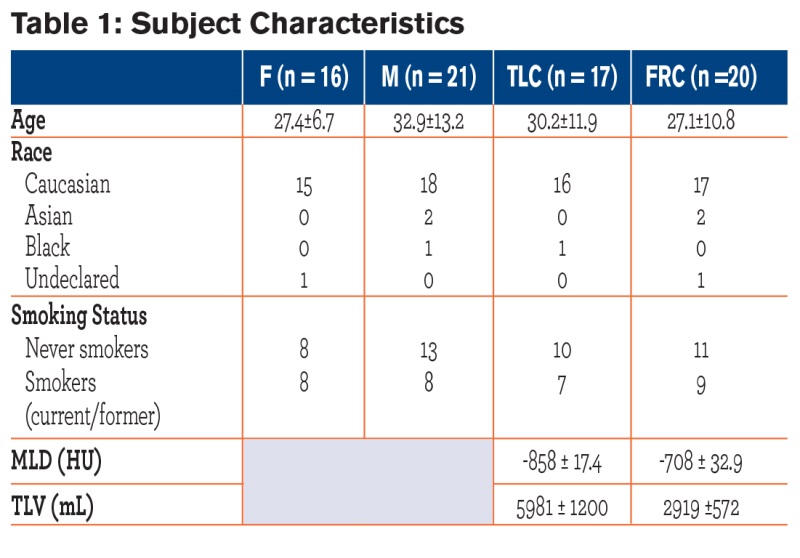 Study population characteristics, including mean lung density and total lung volume, are shown in Table 1. Participant ages ranged from 20-64 years, with no age difference between gender and repeat groups. Approximately half the participants (n = 16) were smokers. The inter-scan differences were not significantly different between genders. Among the 37 participants recruited, there was radiological evidence of mild emphysema (6/37), air-trapping (12/37), and ground glass opacification (3/12). In this normal population (normal PFTs) the amount of air trapping at FRC (< -856 HU threshold) and the emphysema index (EI) at TLC (< -950 HU threshold) averaged 6.03±6.47% and 3.60 ±2.70 %, respectively. For smokers, air-trapping and EI averaged 3.81% and 4.11%, respectively; and for non-smokers, air-trapping and EI averaged 7.85% and 3.25%, respectively, with no significant difference between groups.
PFT vs. CT-based Comparisons
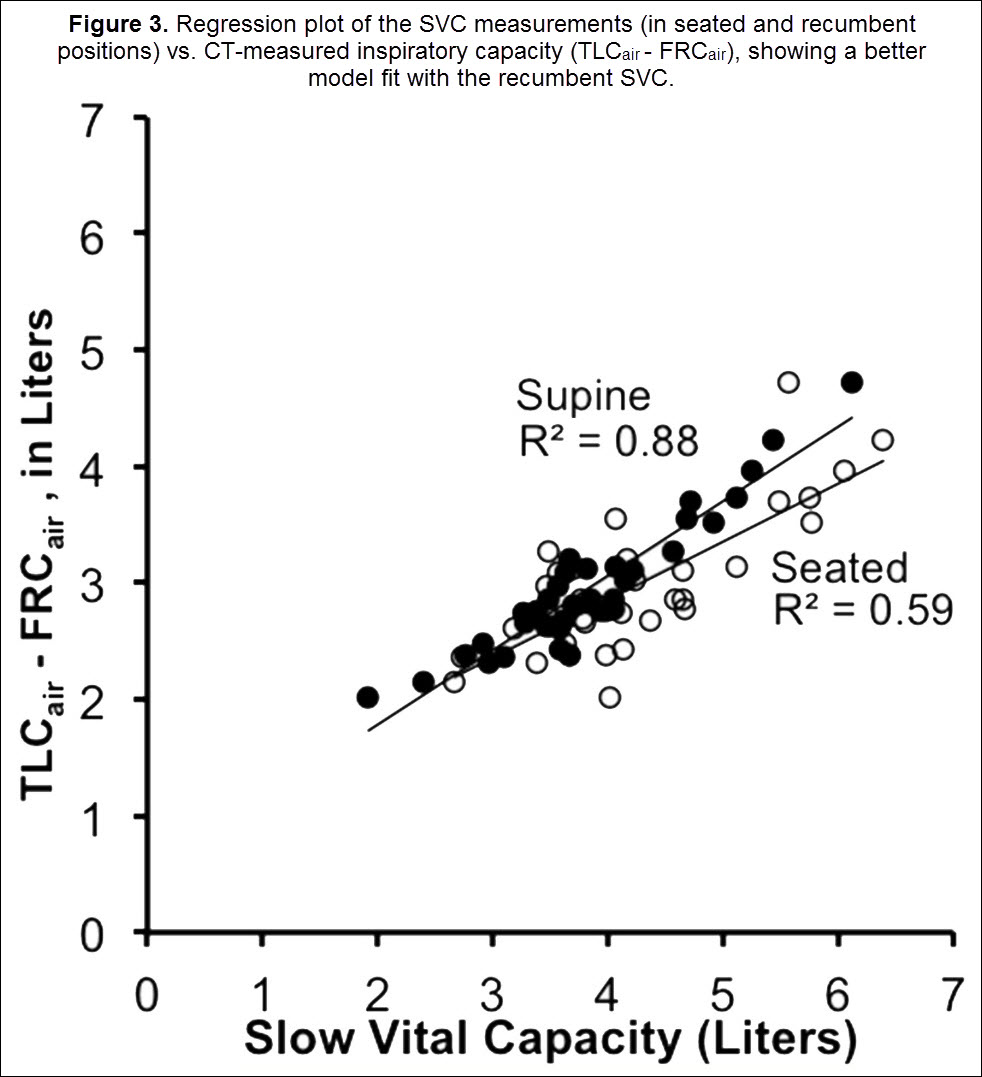
Participants’ upright body plethysmographic-based measures of TLC (including participants who had both 1 or 2 TLC CT scans), were, on average, 793 ± 430 ml. This represents a 13.2 ± 6.8% higher air volume via PFTs than TLCair measured by CT and presumably represents a body posture effect. This excludes 2 participants with either a known PFT reliability problem or a clear leak around the mouthpiece when performing the CT study. Participants’ supine spirometric-based SVC was, on average, 363 ± 600 mL less than the seated SVC (p<0.05) but there was a strong correlation between the 2 measures. CT-based inspiratory capacity (TLCair – FRCair) had a significantly higher correlation with the PFT lab-derived supine SVC (Pearson’s ρ = 0.94) compared to the seated SVC (Pearson’s ρ = 0.77) (Figure 2).
Repeatability of Lung Density Metrics
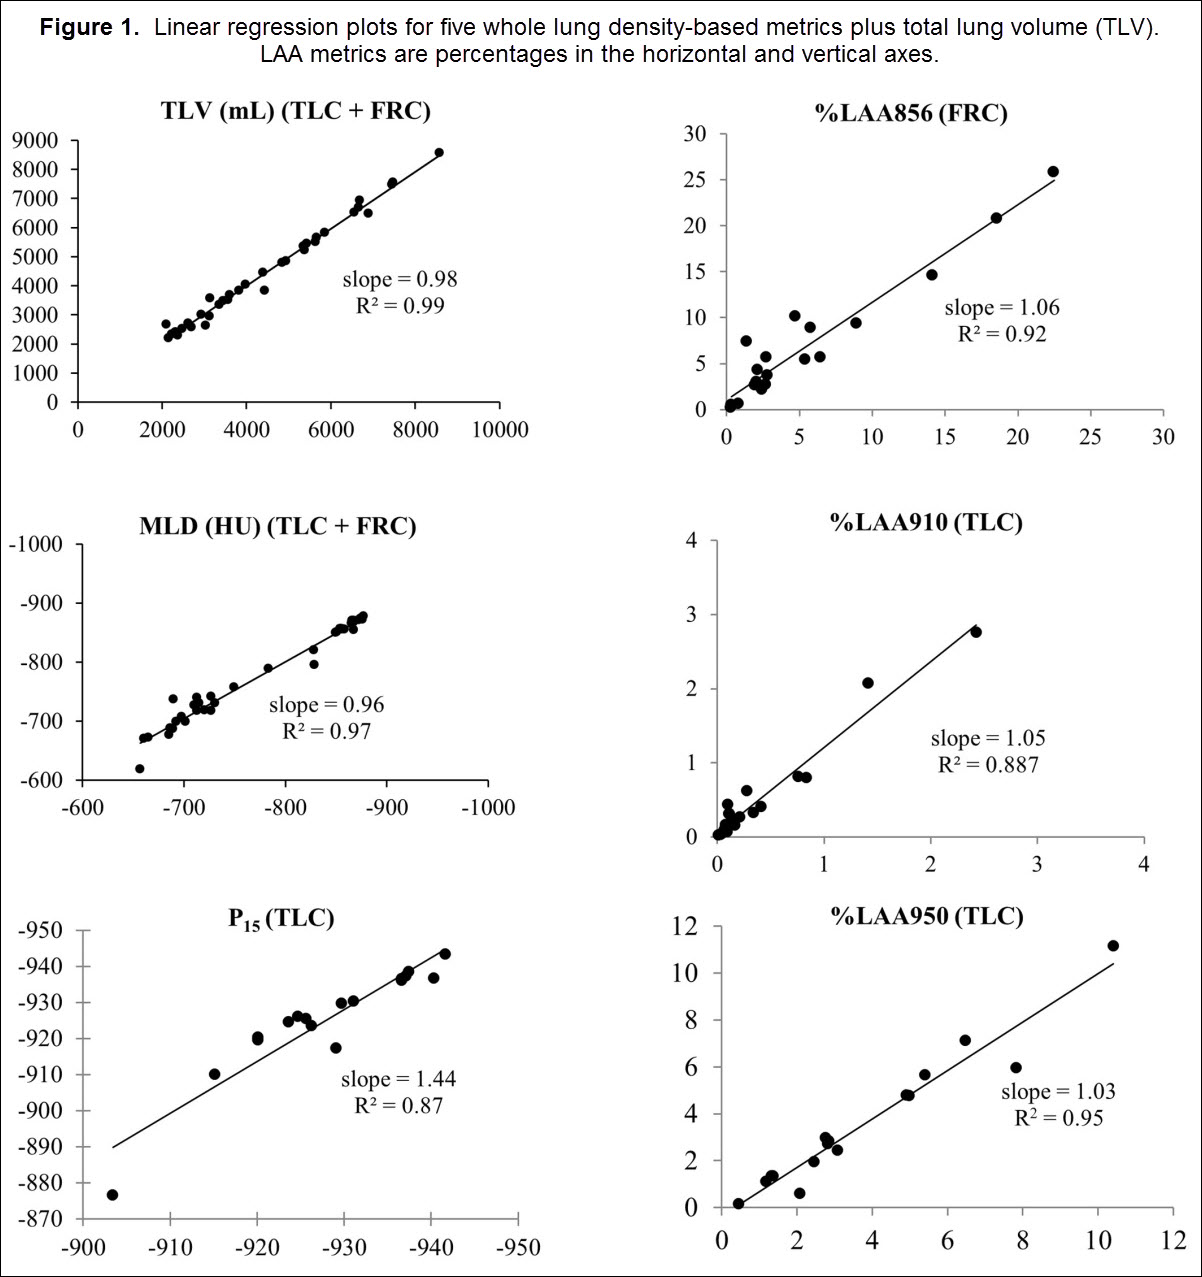
Baseline and repeat scans demonstrated high correlation for all participants and for all density metrics. Figure 3 shows regression plots for mean density, total lung volume, P15, %LAA856, and %LAA950. As shown in the figure, the slope and intercept of the regression equations was close to 1 and 0, respectively. The intra-class correlation was greater than 0.80 for both FRC and TLC repeat groups (Table 2), indicating very good repeatability.
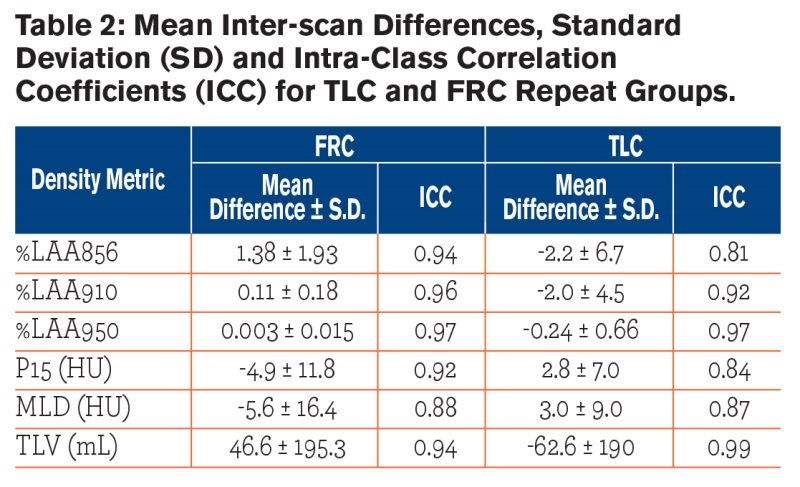
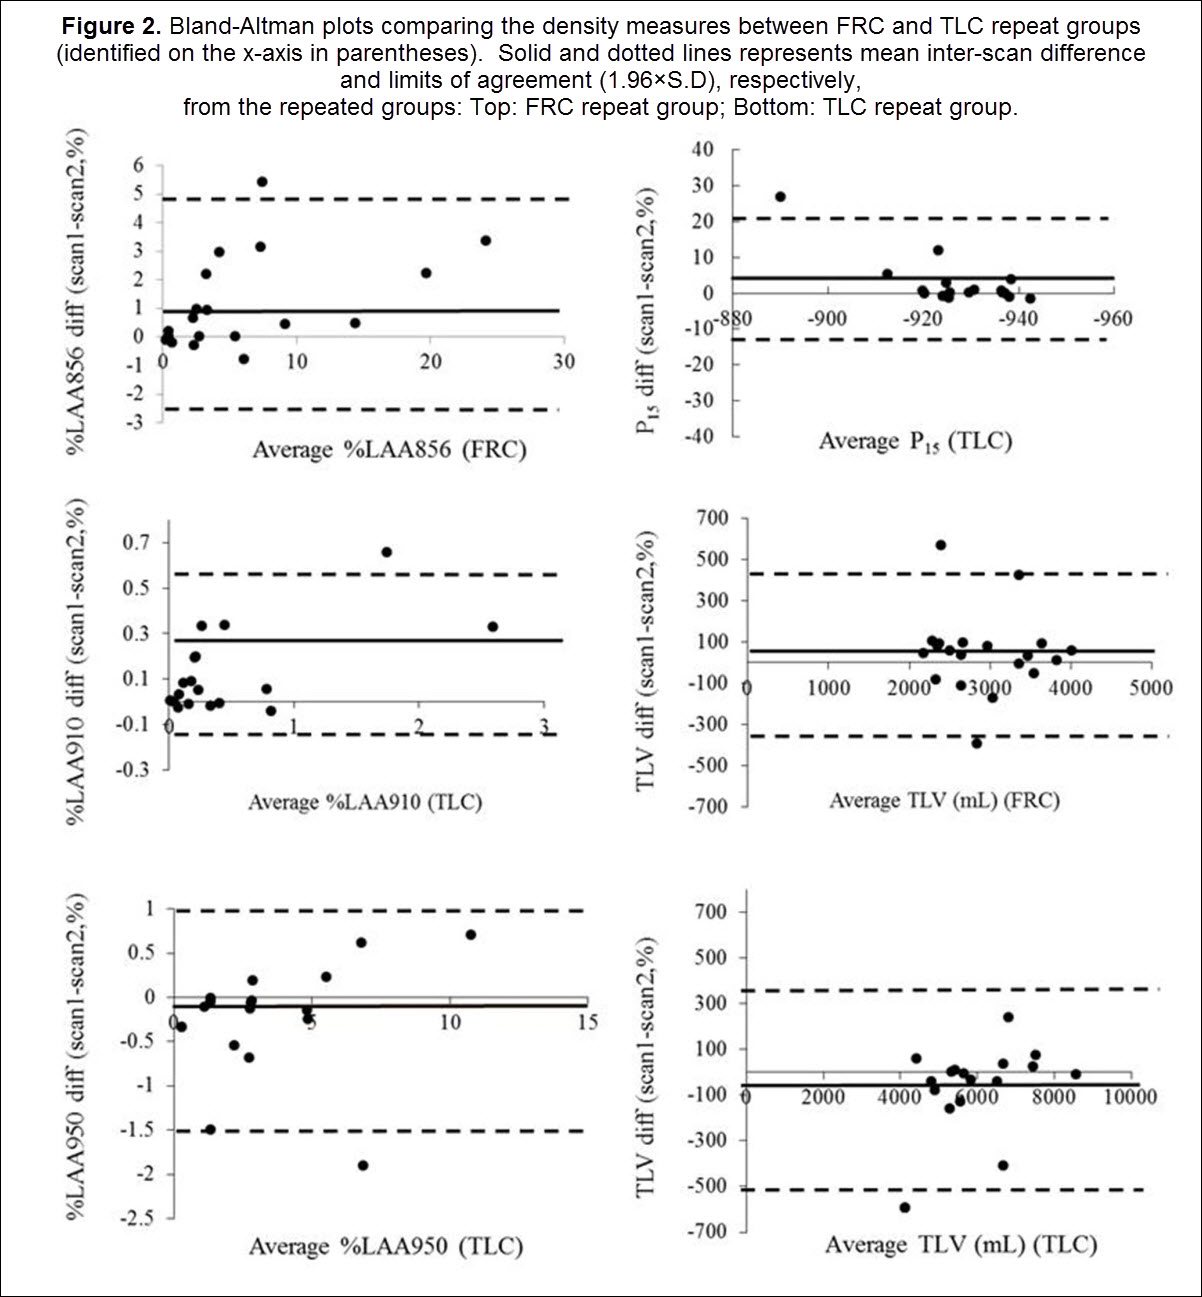
The mean inter-scan differences were small and did not, in general, differ between TLC and FRC repeat groups. The %LAA856 mean difference was higher in the FRC group compared to TLC group (p = 0.048). Bland-Altman plots (Fig. 2) showed that the majority of participants had inter-scan differences within 2 SD of their respective means. Two participants (specifically, one in the FRC and one in the TLC repeat group) had a between scan volume difference exceeding 400 ml. These participants were identified in the Bland-Altman plots as having mean inter-scan differences greater than the 95% LoA. The most likely explanation for volume differences of this size was failure of the participant to maintain a seal when breathing through the mouthpiece. Our UVC model (Table 3) predicted 52%, 11%, and 17% variance in %LAA856, %LAA910, and alpha-910 (p<0.05), respectively, due to error in volume control. The UVC-based statistical correction did not affect the variance of the P15 and MLD, although there was a relatively strong model fit (R2 = 0.71, 0.75, respectively). The average repeatability of alpha-910 and alpha-950 were 0.57 and 0.64, respectively and the mean inter-scan differences were not significantly different between these 2 metrics. The repeatability of A-Balpha-910 differences was comparable between left and right lungs (ICC = 0.59 and 0.46, respectively). However, repeatability greatly differed in the left and right lung for A-Balpha-950 (ICC = -0.32 for left, ICC = 0.69 for right).
Power calculations (Tables 4 and 5)for each repeat group revealed that as few as 68-136 individuals were needed to see the targeted detectable change in LAA. For MLD, depending on the detectable change, which was chosen to be between 2-4 HU, about 3-4 times more participants were required for the FRC repeat group compared to the TLC repeat group; for P15 about 1-2 times more participants were needed in the in the FRC group compared to the TLC group.

Discussion
This study demonstrated high repeatability of density-based metrics acquired from single-breath hold scans in a population of healthy nonsmokers and smokers. Repeatability did not differ between FRC and TLC scans and ICCs were, on average, greater than 0.8 with mean differences close to zero. The participant cohorts in this study were young adults, ranging from 20-30 yrs. with minimal (<10%) air trapping, which may have yielded better within-participant repeatability. Several studies have reported similar ranges in air-trapping percentages in asymptomatic smokers, as high as 20%.6 We used FRC scans to measure air trapping rather than full expiratory scans because of historic precedent in both SARP and COPDGene®.17,18
Previous studies that have reported repeatability in a smoking population 19,20 have not used spirometric volume control and have studied only full inspiration. Expiratory scans are proving important for identifying sub-phenotypes in both COPD and asthma.17,21-23 However, repeatability of inspiratory and expiratory scans under volume control conditions has not, to our knowledge, been reported. We utilized a volume-controlled pneumo-tachometer with volume monitoring that allowed us to carefully account for volume differences between scans. Using this technique, we reported a failure of 4/37 participants from our cohort. We found that PFT-based supine SVC was significantly different than seated SVC, suggesting that CT-based TLC - FRC air volume differences vs. PFT-based differences are, in part, simply due to body posture differences. Thus, it is expected that CT measures will underestimate normative tables of spirometric measures. While we did not image at RV, our TLCair - FRCair measures were more closely correlated with supine vs. seated spirometric-based SVC measures. One simply needs to keep in mind that body posture used in CT scanning influences density metrics. Despite controlling for lung volume during imaging, there was some deviation in the volumes achieved between the repeat scans. To account for additional variance due to volume difference, a univariate correction was used, similar to previous studies that applied this technique on spirometrically gated or coached volume-controlled participants.15,24 We found that this served to decrease the LoA although not the mean inter-scan differences. Scan-to scan differences for certain metrics, such as %LAA 950, likely reflected noise and sparse clustering of connected voxels. Therefore, our results represent actual participant variability rather than volume-related error.
In addition, extrinsic variables, such as those caused by different scanner models or differences between scanner calibrations, were minimized in this study. The controls employed here included imaging participants twice on the same CT scanner, run by a small number (2) of well-trained CT technologists, and utilizing a lung volume monitoring device. Longitudinal variation in lung density changes have been reported in asymptomatic smokers with and without radiographic signs of emphysema15,25 and these measurements were incorporated in our simplified power analysis to show that, with proper lung volume control, a relatively small sample size of a few hundred individuals is needed to achieve a reasonable and detectable change in lung density metrics. We acknowledge that in this population of healthy participants, density variation due to preexisting disease is minimal, and were not factored in our calculations of effective sample size.
We purposefully chose a sample size with minimal disease to address actual participant variation due to lung inflation differences and intrinsic variation. The longitudinal variation in lung density-based measures, over a 1 year period, are currently being evaluated as part of an ongoing National Institutes of Health study on Subpopulations and Intermediate Outcome Measures in COPD study (SPIROMICS), accounting for a variety of parameters, including severity of disease, smoking history, age, and BMI.26 BMI, age and smoking history have all been shown to independently affect lung density measures when evaluated in a large (855) population of normal participants evaluated as part of the MESA lung study.27 (Neither MESA nor SPIROMICS utilize spirometric lung volume control.) Our current study, representing best-case conditions, demonstrates that when these confounders are eliminated, study populations of relatively small sizes can provide sensitive measures of small changes in CT-derived lung metrics. If study design allows for confounders, such as significant changes in BMI or smoking status, such changes must be accounted for in the planned statistical design of the study.
Conclusions
In this study we have identified repeatability of quantitative CT-based density metrics using optimal control of lung volume, a single CT technologist, and a single scanner type. Using this scanning environment, we demonstrate repeatability of inspiratory and expiratory measures to infer sample size needed to distinguish a small but detectable change in lung density over time. These power calculations demonstrate that careful control of scanning environment is crucial and, if done correctly, can lead to relatively small population studies to detect small but meaningful changes in CT-derived density metrics.
Acknowledgements: The authors would like to thank Joanie Wilson and Janice E. Cook- Granroth for participant recruitment and data collection and John H. Morgan for help with the volume controller during scanning sessions.
Declaration of Interest: Eric Hoffman is a founder and shareholder of VIDA Diagnostics, a commercial developer of lung imaging software and affiliated with the University of Iowa.