Running Head: LLN for FEV1/FEV6, FEV1/FVC, FEV3/FEV6, and FEV3/FVC
Funding Support: No outside funding received.
Date of Accceptance: December 4, 2014
Abbreviations: forced expiratory volume in 1 second, FEV1; forced expiratory volume in 3 seconds, FEV3; forced expiratory volume in 6 seconds, FEV6; forced vital capacity, FVC; lower limit of normal, LLN; Third National Health and Nutrition Examination Survey, NHANES-3; forced expiratory flow at 25%-75% of the forced vital capacity, FEF25-75%; forced expiratory flow at 25% of the forced vital capacity, FEF25%; forced expiratory flow at 50% of the forced vital capcity, FEF50%; forced expiratory flow at 75% of the forced vital capacity, FEF75%
Citation: Hansen JE, Porszasz J, Casaburi R, Stringer WW. Re-Defining lower limit of normal for FEV1/FEV6, FEV1/FVC, FEV3/FEV6 and FEV3/FVC to improve detection of airway obstruction.
Chronic Obstr Pulm Dis. 2015; 2(2): 94-102. doi:
http://doi.org/10.15326/jcopdf.2.2.2014.0144
Introduction
After the introduction of spirometry by Hutchinson1 in 1846 and forced expiratory maneuvers by Tiffeneau2 in 1947, the ratios of FEV1/FVC became the standard criterion for establishing the presence of airway obstruction. Because the ranges of absolute forced expiratory timed-volumes found in apparently normal individuals of the same gender, age, height, and ethnicity are so high, less-variable ratios of these same timed-volumes are advantageous.3 The more recently introduced FEV1/FEV6 4-7 has the major advantage of avoiding the variability of the FVC duration inherent in the FEV1/FVC. The extremely high inherent variability of the forced expiratory flow at 25%-75% (FEF25-75%), (and to a lesser extent the forced expiratory flow at 25 % [FEF25%,] forced expiratory flow at 50 % [FEF50%] and forced expiratory flow at 75 % [FEF75%]) because both time and flow vary, has limited their utility. The FEV3/FVC8-13 has been less studied and the FEV3/FEV6 apparently not at all. Could the latter ratios be more specific and sensitive than the FEV1/FEV6 and FEV1/FVC in detecting airway obstruction?
Traditionally, lower 95% confidence intervals calculated from mean values and their variability have been used to define the lower limits of normal (LLN) of the FEV1/FVC.14 Because the distribution of abnormalities has usually been considered normal, these LLN have been calculated from age-declining FEV1/FVC predicted mean values less 1.645 times the standard deviation ( SD) of reference populations (apparently healthy and never-smoking) to define the 5% likelihood of airway obstruction in other individuals of the same age, gender, and ethnicity.3-14 Recently, Quanjer and colleagues,15 in a major advance, took into account the asymmetry of distribution of several spirometric values plus the differences between ethnicities. Their published equations (each with approximately 20 coefficients) assess many spirometric values, but, unfortunately, do not include any important ratios other than FEV1/FVC.
Therefore, suspecting that these older ratios might not optimally target borderline individuals across the full adult age span and that FEV3/FEV6 and FEV3/FVC might better define slower emptying airways, we wished to define the LLN for the FEV1/FEV6, FEV1/FVC, FEV3/FEV6, and FEV3/FVC ratios so that those ratios could be better utilized to validly compare the sensitivity and specificity of these spirometric ratios. Finally, we realized that multiple iterative techniques (changing the slope and intercept values) allowed us to best define LLN spirometric ratio equations as close as possible to 5% for each age, ethnicity, and gender.
Initially, using the original values of the best FEV1, FEV3, FEV6, and FVC from the Third National Health and Nutrition Examination Survey (NHANES-3) databases of apparently healthy never-smokers, we were able to calculate, graph, tabulate, and identify the exact number of lowest 5% of values of the ratios of FEV1/FEV6, FEV1/FVC, FEV3/FEV6, and FEV3/FVC for each ethnic/gender group by age.16 Then, multiple iterations identified new LLN ratio equations to target, by age, ~5% of the never-smoking reference population of each equation as abnormal. We hypothesized that these new equations might better identify airway obstruction in individuals and populations.
Methods
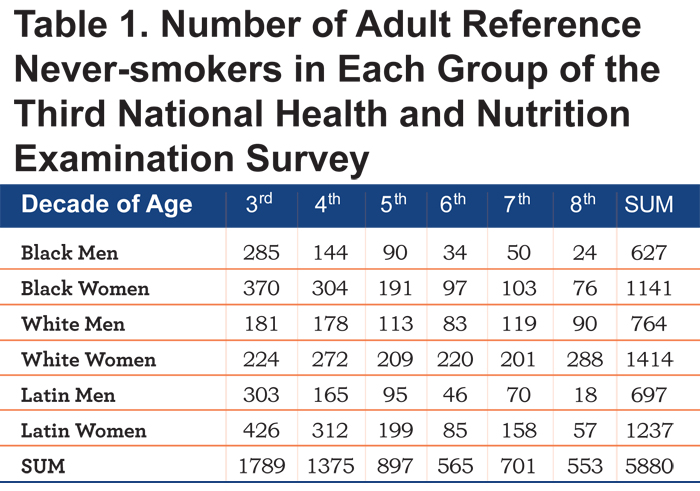
Study population: De-identified digital records of the informed-consent volunteers of NHANES-3 were obtained which included age, ethnicity, gender, height, weight, smoking and other history, measurements relating to their health and diet, and spirometric values of highest peak flow, FEV1, FEV3, FEV6, and FVC.16 As can be seen in Table 1, the number of individuals in ethnic/gender/age groups differed widely.
The spirometric values of the 6 groups, identified as black, white or Latin men or women had been used in 2 Hankinson and co-authors articles 4,7 and our prior publications.10,11 Because selection criteria for normalcy may have differed minimally, the 5880 apparently healthy, never-smoking reference individuals selected in this study differed slightly from those selected in the Hankinson publications.4,7 Since the results of the 2 Hankinson publications for LLN values for FEV1/FEV6 were nearly identical (see below); the original4 ratio equations were ultimately used. For comparisons with current-smokers, spirometric measures from 3508 NHANES-3 current-smokers without other identifiable diseases were utilized. 17
Processing of data: For each set of ratios (FEV1/FEV6, FEV1/ FVC, FEV3/FEV6, or FEV3/FVC), for each of the never-smoking 6 ethnic/gender groups from ages 20.0 to 79.9 years, we sequentially arranged in groups of 40 each never-smoker by age in EXCEL spreadsheets. Since 5% of 40 is 2, we sorted each group from high to low and selected the second lowest ratio value to represent the LLN for the median age of each group of 40. The 20th lowest ratio was designated the median of the 40. Linear regression equations derived from the intercepts and slopes of the lowest 5% were calculated and plotted. Invariably these initial equations identified less than 5% of all individuals in each ethnic/gender ratio group and were modified by an iterative process.
Therefore, a multiple iterative process (each time changing the slope and/or intercept and reevaluating the fit of the new equation with the actual data) up to 20 times was used to identify a single linear equation that best identified the lowest 5% in both ages ≥45 years and <45 years. These new linear equations (using the best intercept and slope of each ethnic/gender/ratio group) were utilized to identify and visualize the full distribution of values including the exact number and percentage of individual values in the lowest 5% of each group of 40 individuals.
Comparing equations for individuals in the ethnic/gender groups: The original Hankinson, Odenkrantz, Feder 4 FEV1/FVC and FEV1/FEV6 equations were used, since results from the FEV1/FEV6 equations4 were nearly identical to those of the Hankinson, Crapo, Jensen7 equations and visually overlaid them graphically. Similarly, the FEV1/FVC, mean and LLN values from the Quanjer equations15 were calculated for each individual. Comparisons were then made using: 1) all new iterative equations for LLN values for younger and older individuals in the 6 ethnic/gender groups; 2) the Hankinson equations4 for the mean and LLN FEV1/FEV6 and FEV1/FVC; 3) the Quanjer15 equations for mean and LLN FEV1/FVC; and 4) the Hansen, Sun, and Wasserman10 equations for mean FEV1/FVC, to detect abnormal ratios in never-smoking versus current-smoking populations.
Statistical analyses: χ2 analyses were used to compare the number of abnormal ratios between groups with a p <0.05 considered significant18
Results
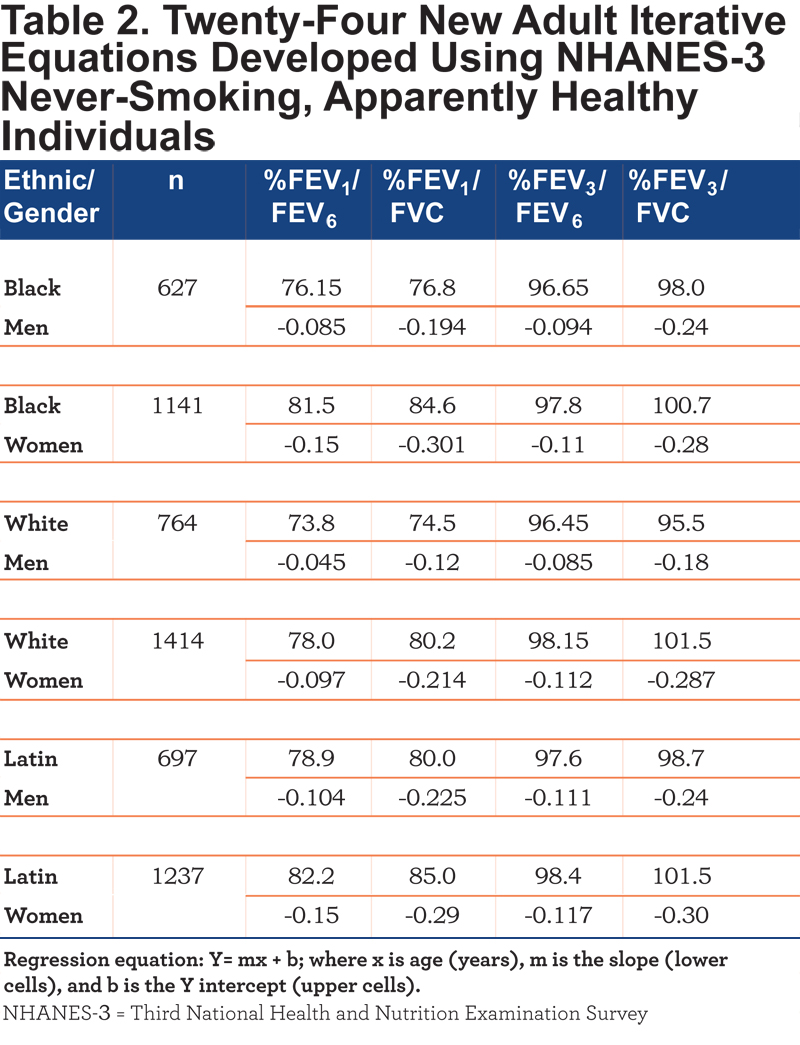
Population and repeated iterative equations: Table 1 reveals the wide spread in the number of never-smokers in each NHANES-3 ethnic/gender/decade cell and the relative paucity of older individuals in the black and Latin groups. Table 2 shows the 24 equations developed by multiple iterations which best delineated approximately 5.0% of each group as <LLN for that group.
Comparing FEV1/FEV6 equations: As an example, Figure 1 shows the FEV1/FEV6 data for never-smoked, white women in groups of 40.
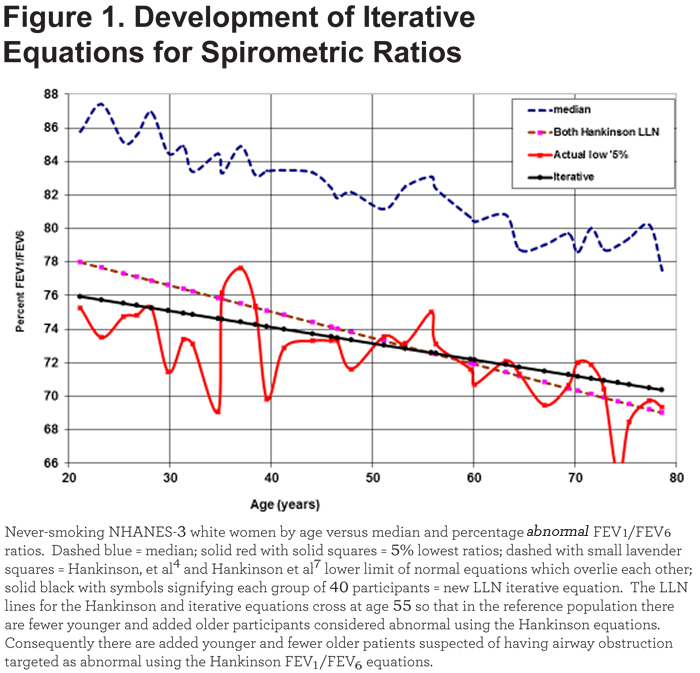
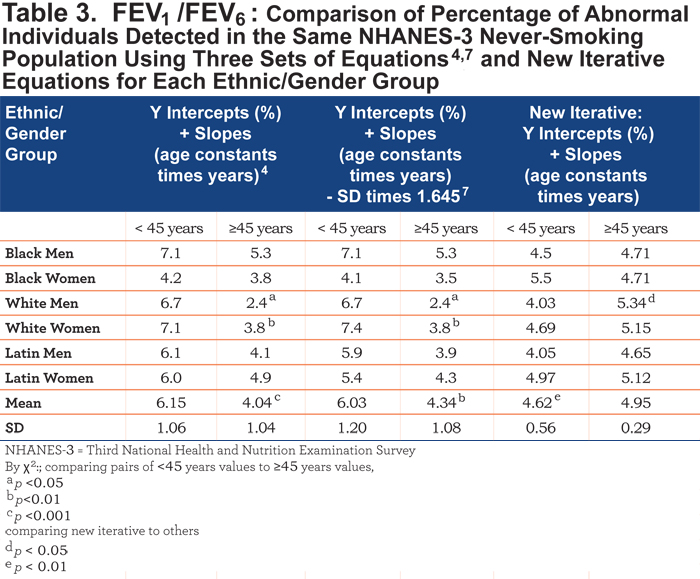
The regression lines for the LLN as calculated by Hankinson et al4,7 equations graphically overlap and differ visually from our iterative equation. For those <45years, 44 of 618 (7.1%) are abnormal using the Hankinson4 equation while 29 of 618 (4.69%) are abnormal using our iterative equation. Contrastingly, for those ≥45 years, only 30 of 796 (3.8%) are considered abnormal using the Hankinson4 equation while 41 of 796 (5.15%) are abnormal using our new iterative equation. Consequently, the number of abnormal younger versus abnormal older differs significantly from the iterative equation (χ2 = 4.68, p < 0.05). Table 3 also shows the similarity of the 2 Hankinson sets of equations in identifying the percentage of never-smoking individuals <LLN in the 6 ethnic/gender groups, the significant differences in younger versus older men and women and the differences from the iterative equations. Graphically, the 6 paired Hankinson equations visually overlie each other. Thus, logically, the original LLN equations4 for FEV1/FEV6 and FEV1/FVC were also based on predicted means for any age less 1.645 times the SD as used in the latter publication.7 In Table 3, both pairs of Hankinson’s equations result in more mean and SD variability from the desired LLN mean of 5.0% (6.15±1.06%, 4.04±1.04%, 6.03±1.20%, and 4.34±1.08%) than the iterative equations (4.62±0.56% and 4.95±0.29%). The total numbers of never-smokers < age 45 considered abnormal by either sets of Hankinson equations4,7 are significantly higher (χ2 = 8.56, p < 0.01) than those identified as abnormal by the new iterative equations.
Comparing FEV1/FVC equations: Overall, Table 4 indicates that younger versus older adults frequently have significant LLN differences using either the Hankinson (4 of 6) or Quanjer (3 of 6) equations.
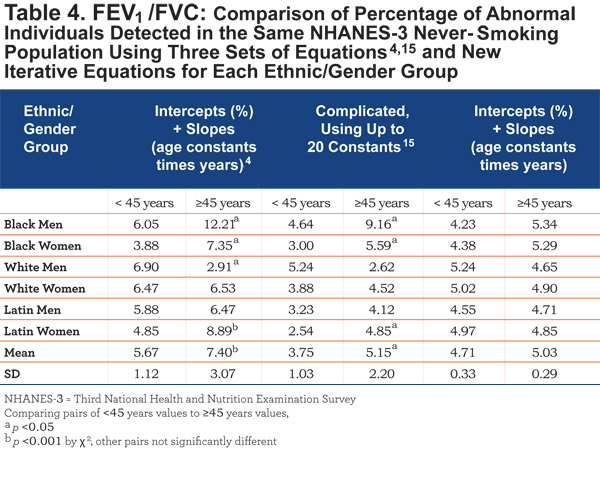
As an example of a group with lesser differences, Figure 2 shows the individual FEV1/FVC values in never- and current-smoking Latin men plus the predicted means and LLN for the Hankinson4 and, Quanjer15 equations and the Hansen, Sun, Wasserman10 equation for mean and the new iterative equations for LLN. It is noteworthy that, though all equations show a decline in the ratio with age, the Quanjer mean equation (which includes height as a variable) is mildly concave upwards while the Quanjer LLN equation is mildly concave downwards. Thus, in this group, the differences between mean and LLN values are not constant but clearly increase with advancing age. The Hankinson LLN equation values for Latin men are consistently higher than those of the intermediately positioned iterative equation. Further, in all 6 groups, but not shown, at ages 25, 35, 45, 55, 65, and 75 years, the Hankinson equations4 have the highest LLN values 5/6 of the times, the Quanjer et al equations15 have the lowest LLN values 5/6 of the times, while the iterative equations give intermediate LLN values 4/6 of the times, suggesting that the iterative equations are the best available to compare spirometric ratios.
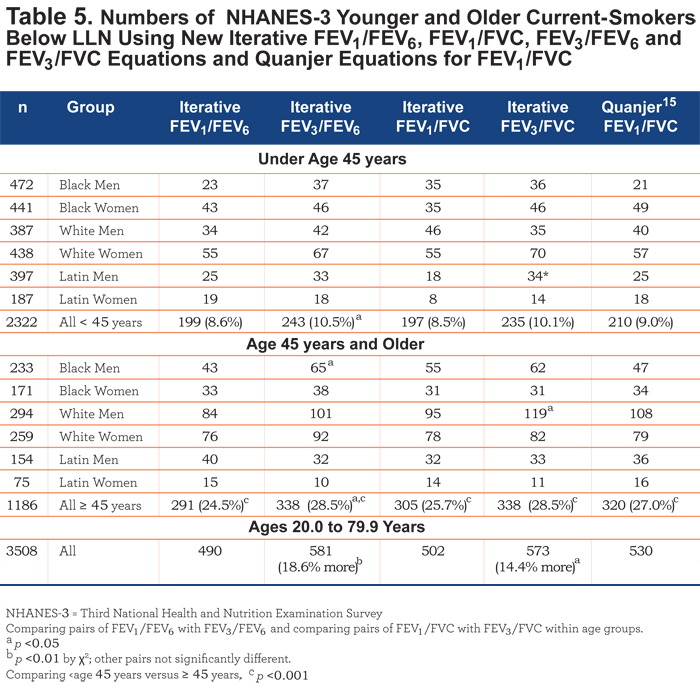
Comparing all iterative ratio equations: Table 5. Assessing current-smokers, not surprisingly, the numbers (and percentages) of smoking-individuals below the LLN is much higher in the older (24.5% to 28.5%) than younger (8.5% to 10.5%) age groups (p < 0.001). Importantly, there are significantly higher numbers and percentages of smokers below the LLN for the FEV3/FEV6 and FEV3/FVC ratios, respectively, than for the FEV1/FEV6 (14.4%, χ2 =5.53, p < 0.05) and FEV1/FVC (18.6%, χ2 = 9.12, p < 0.01).
Discussion
Summary of the challenge: Admittedly, if the LLN of a population is set at exactly 5.0%, it is impossible to find exactly 5.0% below that level in a group or subgroup of a reference population if the number of individuals is not divisible by 20 into a whole number. Advantageously, Quanjer and his colleagues15 recognized that the distributions of values about the means of reference population were not exactly normal and that their mean and LLN equations were not necessarily parallel (Figures 1 and 2). Excellent as they are, their published equations do not define important spirometric ratios other than the FEV1/FVC; they are also more subject to calculation error since each equation requires approximately 20 coefficients and natural logarithms. Hankinson’s equations and our iterative equations for FEV1/FEV6 and FEV1/FVC LLN are simpler but omit using height as a predictor. Hankinson’s LLN FEV1/FEV6 and FEV1/FVC equations4,7 are all parallel to the mean ratio equations because they are based on mean values – 1.645 times the SD. Although they may at times approximate 5% abnormal values across the full age range in a reference population, their range of percentage abnormalities of 3% to 10% or more in younger or older ages of the reference populations (Tables 3 and 4) results in lowered reliability in defining and judging abnormalities in other populations and in comparing other ratio formulas. Therefore, new simple LLN linear equations for FEV1/FEV6, FEV1/FVC, FEV3/FEV6, and FEV3/FVC are likely to be advantageous in comparing the relative value of several spirometric ratio equations in detecting airway obstruction.
Significance of the findings: In order to compare the validity of different ratios to identify abnormalities or differences in a targeted population from the normal distribution of these same ratios in a reference population, the reference population variables should select as close as possible to 5% of individuals below the LLN of their formulas along the entire age span. As noted, this is not an easy task. Using standard methods of calculating the LLN (mean – 1.645 times the SD) is likely invalid since in multiple ethnic/gender groups Quanjer’s15 FEV1/FVC mean and LLN equations uncommonly are parallel. Thus the lowest 5% of any ratio is unlikely to be distributed in a line parallel to that of the mean [Figure 2]. The multiple iterative but simple LLN spirometric ratios developed in this study are linear, and do not require squares or logarithms of age or height or the addition of weight variables in order to define the lower 5% of the never-smoking population reasonably well.
The variability of absolute values of FEV1, FEV3, FEV6, and FVC in individuals of a specific height, gender, ethnicity, and age is high, higher than the variability of the ratios of these values.3 Thus ratios became important in identifying obstructive airways disease. For decades, the FEV1/FVC has been the favored ratio to evaluate obstruction. The more recently introduced FEV1/FEV6, though still infrequently used, has high sensitivity and specificity by meta-analysis,19 has advantages over the FEV1/FVC in that the latter has a shifting denominator from test to test and laboratory to laboratory - because breath duration times vary - while the FEV1/FEV6 has a fixed denominator, is less stressful for patients, and appears to evaluate airway obstruction as well as or better than the FEV1/FVC when normality and abnormality are defined according to the bottom 5% as detailed in this paper.
Ratios derived later in forced exhalations have rarely been used, although FEV3/FVC has been asserted to be of value.12,13 Many authorities have accepted the assumption that the exponential-like curves seen when expiratory volumes are plotted against time are adequately defined by the FEV1/FEV6 or FEV1/FVC ratios. The possible additional value of FEV3/FEV6 and/or FEV3/FVC has largely been ignored. Because data from large reference or diseased populations for other time points in the exhalation were not available, our decision was to evaluate FEV3/FEV6 and FEV3/FVC ratios. In the NHANES-3 population, it appears that in the detection of abnormal airway obstruction in current-smokers, the FEV3/FEV6 is superior to the FEV1/FEV6 (18.6% more, p < 0.01) and the FEV3/FVC is superior to the FEV1/FVC (14.4%, p<0.05) (Table 5). With further evaluations, we suspect the FVC ratios may be less discriminating than the FEV6 ratios because of the uniform denominators of the latter.
Limitations: Testing the new equations in other populations would be advantageous. It would be helpful to have larger numbers of healthy older individuals in a reference population. Perhaps an age other than 45 years would be preferable for separating younger from older smokers. That age was selected since a) age 45, rather than later ages, helps equalize the group sizes and b) the severity of airway obstruction in surviving current-smokers increases significantly in the 5th decade of life.17 Although the effect of changing the LLN value of ratios a few percentage points away from 5% remains uncertain, it seems likely that in comparing the sensitivity of different spirometric ratios, it is best to use ratios with approximately the same percentage (presumably ~5%) of LLN in the reference population. The evaluation of specificity should be more relevant when the available ratios are compared with non-spirometric evidence of airways disease, such as inspiratory and expiratory chest imaging.
Conclusion: To compare the value of different spirometric ratios in detecting airway disease, the ratios should identify approximately 5% of apparently normal reference individuals as below the LLN throughout the age span being considered. New simple linear iterative equations which do that for FEV1/FEV6, FEV1/FVC, FEV3/FEV6, and FEV3/FVC are offered. The latter 2 likely better identify small airways disease in adults. We suggest that these equations be further tested in routine spirometric evaluation of airway obstruction in adults and that consideration should be given to using FEV3 ratios as well as FEV1 ratios.
Acknowledgments
We appreciate the high quality participation of the many volunteer participants, health professionals, and others who assembled and organized these data and the U.S. Department of Health and Human Services which made these data available for us to use. Author comments regarding prior publications: Some of the NHANES-3 data used in this manuscript have been used for other purposes (i.e. LLN = mean – 1.645 times SD) in the following publications:
Hansen JE, Sun XG, Wasserman K. Discriminating measures and normal values for expiratory obstruction. Chest. 2006; 129(2): 369-77;
Hansen JE, Sun XG, Wasserman K. Ethnic- and sex-free formulae for detection of airway obstruction. Am J Respir Crit Care Med. 2006; 174(5): 493-498;
Hansen JE, Sun XG, Wasserman K. Spirometric criteria for airway obstruction: Use percentage of FEV1/FVC ratio below the fifth percentile, not <70%. Chest. 2007; 131(2): 349-355.
Declaration of Interest
JP has received consulting fees from Boehringer Ingelheim.