Running Head: CD4+ T Cells as Biomarkers of COPD Phenotypes
Funding Support: This work was supported by MedImmune.
Date of Acceptance: June 16, 2015
Abbreviations: granulocyte monocyte colony stimulating factor, GM-CSF; interferon gamma, IFN-ɣ; interleukin one-alpha, IL-1α; tumor necrosis factor-alpha, TNF-α; tumor necrosis factor-beta, TNF-β; acute exacerbation of COPD, AECOPD; National Jewish Health, NJH; COPD Genetic Epidemiology study, COPDGene; body mass index, BMI; forced expiratory volume in 1 second, FEV1; long-acting beta agonist, LABA; inhaled corticosteriods, ICS;forced vital capacity, FVC; COPD-emphysema, EMPH; low attenuation area, LAA; COPD-chronic bronchitis, CB; COPD-emphysema and COPD-chronic bronchitis, MIXED; Global initiative for chronic Obstructive Lung Disease, GOLD; peripheral blood mononuclear cells, PBMC; Gene Expression Omnibus, GEO; analysis of variance, ANOVA; coefficient of variation, CV; T-cell stimulation score, TSS
Citation: Roberts MEP, Higgs BW, Brohawn P, et al. CD4+ T-cell profiles and peripheral blood ex-vivo responses to T-cell directed stimulation delineate COPD phenotypes. Chronic Obstr Pulm Dis. 2015; 2(4): 268-280. doi: http://doi.org/10.15326/jcopdf.2.4.2015.0131
Introduction
COPD is characterized by persistent, progressive airflow obstruction and by 2020 COPD is projected to become the 5th major disease burden and 3rd leading cause of death worldwide.1 The major risk factor for the development of COPD is cigarette smoke. Smoke-induced lung injury is associated with recruitment of inflammatory cells that mediate immune responses in the lung, excessive oxidative stress of lung structural cells, and breakdown of connective tissue leading to impaired gas exchange and elastic recoil.2-4 These manifestations are not fully reversible even after smoking cessation.
The fact that most smokers do not develop COPD is a major medical enigma.5 Complicating the incomplete penetrance of smoking as a risk factor is heterogeneous disease presentation of chronic bronchitis and emphysema. Additionally, a subset of COPD patients suffer from frequent acute exacerbation of COPD (AECOPD)6-8; these patients experience higher morbidity and mortality and have a high impact on health care economic costs.5,6,9 Despite attempts to characterize COPD biomarkers,10-12 little is understood about the molecular differences of these clinical phenotypes.13,14 We hypothesized that an interrogation of isolated circulating immune cell populations and the activation characteristics of such cells in whole blood could differentiate patients with COPD from control smokers and subgroup patients with shared biological characteristics. Such approaches could provide a means to simplify clinical heterogeneity in COPD and partition patients into subgroups related to shared biology, resulting in appropriate treatment strategies for a specific patient profile.
In patients with COPD, blood T-cell and monocyte populations migrate to the lung and are involved in inflammatory responses resulting in pathogenic consequences.7,15 Thus, blood may be a good surrogate tissue for biomarker discovery; however, understanding the contributions of individual cells is difficult in whole blood. An examination of isolated immune blood cells could reveal cell-type specific differences and approaches for eventual differentiation of distinct COPD phenotypes, similar to observations in autoimmune diseases.16
Appropriate biomarker strategies could result in improved development of pharmacological interventions for COPD. Lung biopsies or washings are the most abundant source materials for biomarker discovery. However, due to the difficulty of incorporating longitudinal assessments using such invasive procedures, we chose to assess blood cell profiling as a possible approach to subgroup patients with COPD. We examined the phenotype and transcriptomics of isolated CD4+ and CD8+ T cells and monocytes from the blood of smokers with and without COPD. Additionally, T-cell directed stimulation of whole blood, using a novel ex-vivo technology, was utilized as a means to study the functional responses of circulating T cells.
Patients and Methods
Study Population and Clinical Variables
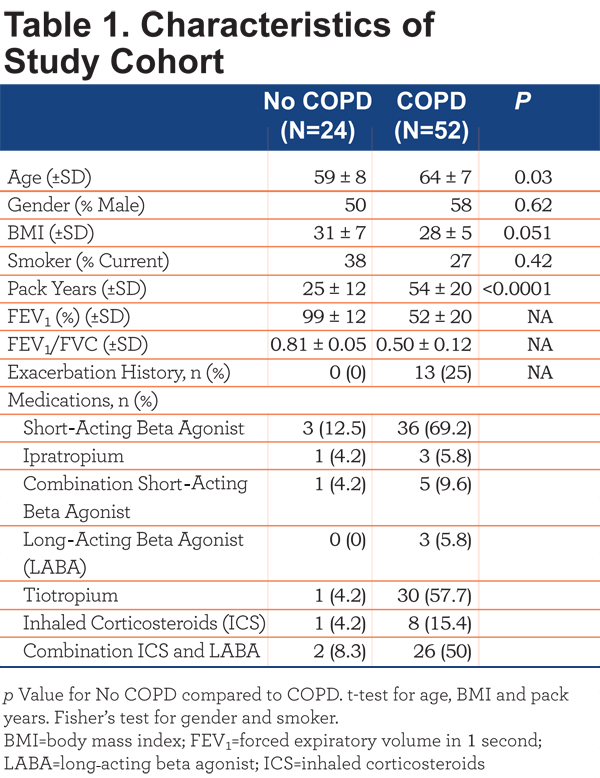
This study was approved by the National Jewish Health (NJH) institutional review board and informed consent obtained from all. All participants were former or current smokers with >10 pack years enrolled in the COPD Genetic Epidemiology (COPDGene) study17 at NJH. Participants were divided into COPD (FEV1/forced vital capacity [FVC]<70 post-bronchodilator; n=52) and control smokers (FEV1/FVC>70 post bronchodilator; n=24).1 Participant characteristics are outlined in Table 1.
Individuals with a recent exacerbation (last dose of oral corticosteroids or antibiotics within 30 days prior to entry) were excluded. The COPD cohort was further subdivided into COPD-emphysema (EMPH) (n=23) based on low attenuation area (LAA) >5%, COPD-chronic bronchitis (CB) (n=8) based on current symptoms and COPD-emphysema and COPD-chronic bronchitis (MIXED) (n=21). Disease severity was based on Global initiative for chronic Obstructive Lung Disease (GOLD) classification criteria. Lung function decline was based on FEV1 at initial enrollment into the COPDGene study and FEV1 at the time of this study, an average follow-up period of 36 months. COPD patients with a loss of >=40mls/year FEV1 were considered rapid decliners and patients with a loss of FEV1 <40mls/year were considered slow decliners. Exacerbation history, based on the COPDGene questionnaire, was defined as patient-reported hospitalizations or emergency department treatment for lung problems in the year preceding the study visit. Therefore, the exact cause of the exacerbations is unknown. All experimental samples were collected in a single visit.
Flow Cytometry
After antibody staining of whole blood for T-cell and monocyte markers (see online supplement), blood was lysed, washed and cells were fixed. The fixed samples were analyzed on an LSRII flow cytometer (BD, Franklin Lakes, New Jersey). FlowJo version 9.1 (TreeStar, Ashland, Oregon) was used for analysis.
TruCulture® Whole Blood Culture
One mL of whole blood was drawn into null or α-CD3/α-CD28 TruCulture® (Rules Based Medicine, Austin, Texas) tubes using standard phlebotomy techniques and incubated in a bench-top dry heat block at 37° C. After 24 hours, supernatant was collected and stored at -20° C until analysis. Supernatants were analyzed by multianalyte profiling using Rules Based Medicine’s TruCultureMAP® v.1.1. The full list of analytes is shown in the online supplement Table S1.
Cellular Isolations
CD8+ T cells, CD14+ monocytes and CD4+ T cells were purified from peripheral blood mononuclear cells (PBMC) as previously described.18 Isolated cells were stored in buffer RLT (Qiagen, Valencia, California) at -80° C. Additional details are available in the online supplement.
RNA Isolation, Microarray and RT-PCR Processing
Total RNA from whole blood was isolated using the PAXgene Blood RNA kit (Qiagen) and total RNA from purified cells were isolated using the RNAeasy Mini kit (Qiagen). RNA quality was assessed on Agilent 2100 Bionanlyzer (Agilent Technologies, Santa Clara, California) and RNA was processed for microarray analyses as previously described.19 Affymetrix HGU133+ arrays (Affymetrix, Santa Clara, California) were normalized using GC-RMA and all processing was conducted in R (http://www.R-project.org). Unsupervised clustering analysis and heatmap generation was conducted using QluCore Omics Explorer (Lund, Sweden). Total RNA from CD4+ T cells were analyzed by an 83 gene T Helper Cell Differentiation RT-PCR array (Qiagen) according to manufacturer’s protocol. SDS 2.4 software (ABI) was used to generate Ct values. Fold change was calculated using 2(-delta delta Ct) formula. All microarray files discussed in this manuscript have been submitted to the National Center for Biotechnology Information’s Gene Expression Omnibus (GEO).
Statistics
Statistical analysis was conducted using Prism (GraphPad, La Jolla, California). Two group testing was conducted using either Student’s t-test or Wilcoxon-Mann-Whitney u-test (2 group 2 tailed) where indicated, and group testing equivalence of means was conducted using a one-way analysis of variance (ANOVA) with fixed effects. All p<0.05 were considered significant.
Results
Lower Numbers of CD4+ T Cells in the Peripheral Blood of COPD Patients
Flow cytometry immunophenotyping was performed on CD4+ and CD8+ T cells and monocytes in the whole blood. Of the cell types examined we only found differences in the CD4+ T cells (Figure 1 A-C). Our analyses revealed a lower proportion and number of CD4+ T cells in patients with COPD compared to control smokers, though statistical significance was only observed comparing numbers of CD4+ T cells (Figure 1A) (p=0.0006).
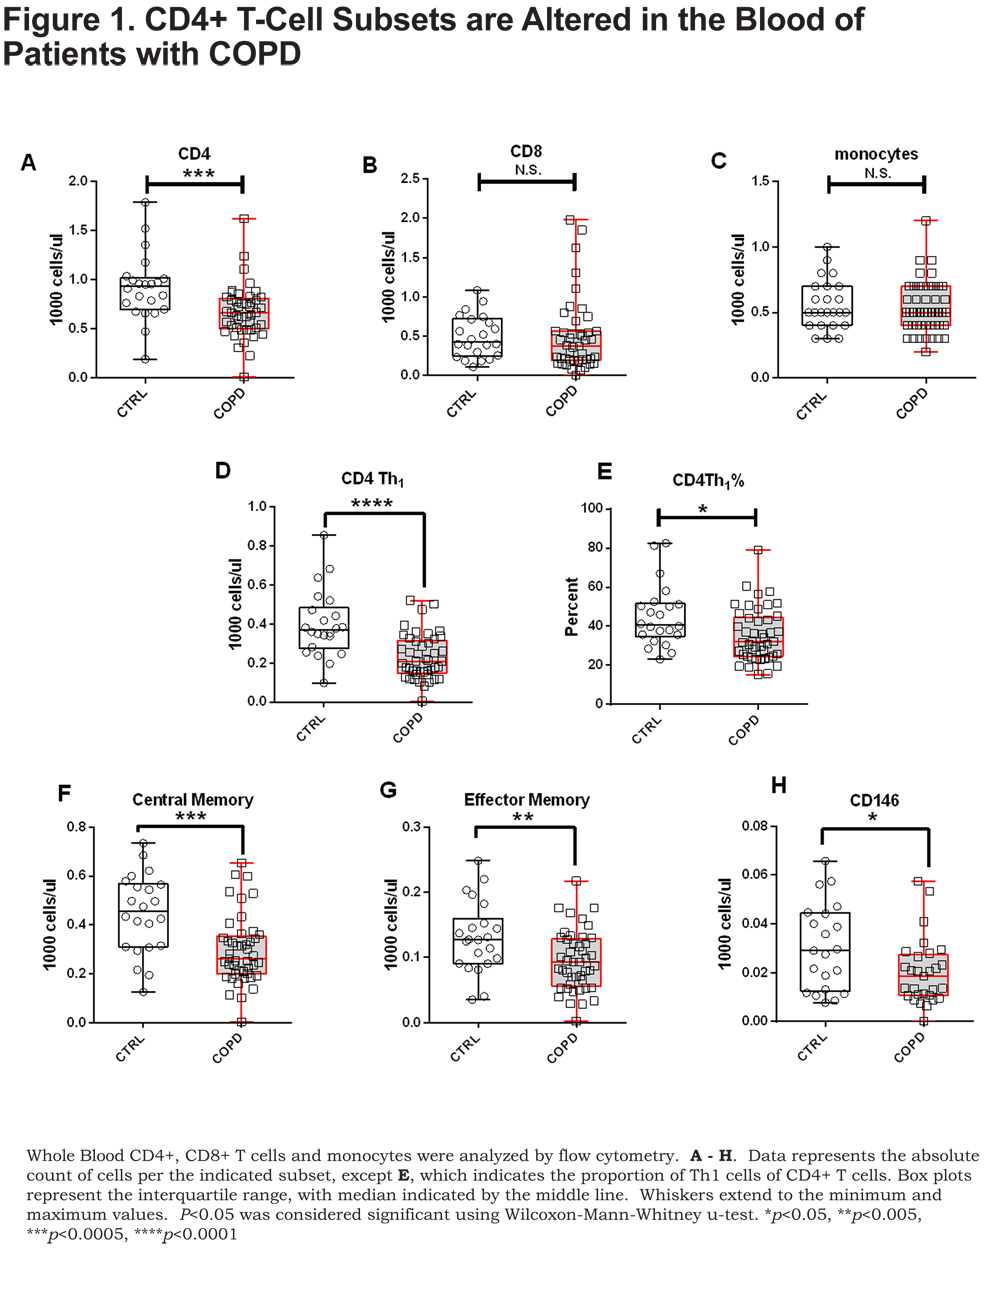
There was no difference in CD4+ T-cell numbers between current and former smokers in our cohort; strongly suggesting that our observation of lower CD4+ T cells in COPD patients is not due to smoking status (online supplement Figure S1). Analysis of discrete CD4+ T-cell subsets indicated significantly lower numbers (Figure 1D) and proportions (Figure 1E.) of CD4+ Th1 T cells (CXCR3+) in patients with COPD compared to control smokers (p=0.0001 and p=0.01, respectively). CXCR3 positivity was used to describe Th1 cells and expression of CCR6 was not assessed. Additionally, CD4+ central memory, CD4+ effector memory and CD4+ CD146+ T cells, an IL-17A secreting subset,20 were all significantly lower in patients with COPD compared to control smokers (Figure 1F-H) (p=0.0006, p=0.009, and p=0.04, respectively).
Similar flow cytometric analysis was performed on CD8+ T-cell subsets. We found no differences between COPD and control CD8+ T-cell subsets. Moreover, no differences were observed among monocyte subsets between COPD and controls. Thus, of the cell types examined, CD4+ T cells were the only cell type with observed alterations compared to controls.
Blood CD4+ T-Cell Transcripts Differentiate COPD Patients From Controls and Further Reveal Subgroups of COPD Patients
To understand whether gene expression analysis could identify molecular subgroups of COPD, RNA from CD4+ T cells, isolated from peripheral blood (95.2±3.12 and 94.48±2.81 percent purity, mean ± SD, control smokers and COPD, respectively) was used for microarray studies. After microarray data normalization, transcripts were filtered with a stringent criteria based on log2 mean intensity >5 and coefficient of variation (CV)>20% to select only the most variant genes. The 212 transcripts that remained after filtering were analyzed, patients with COPD compared to control smokers, using a t-test restricted to false discovery rate (FDR; q-value) <0.05. This analysis resulted in 44 transcripts (42 upregulated and 2 down regulated) with fold changes >1.5, representing 43 unique genes (q<0.05).
Unsupervised hierarchical clustering of the 44 differentially expressed transcripts separated participants into 2 major groups, based on data visualization, with a majority of the controls (75%) in Group I (Figure 2A, left, yellow) and the majority of the COPD patients (75%) in Group II (Figure 2A, right, blue), (Fisher’s exact test p<0.0001).
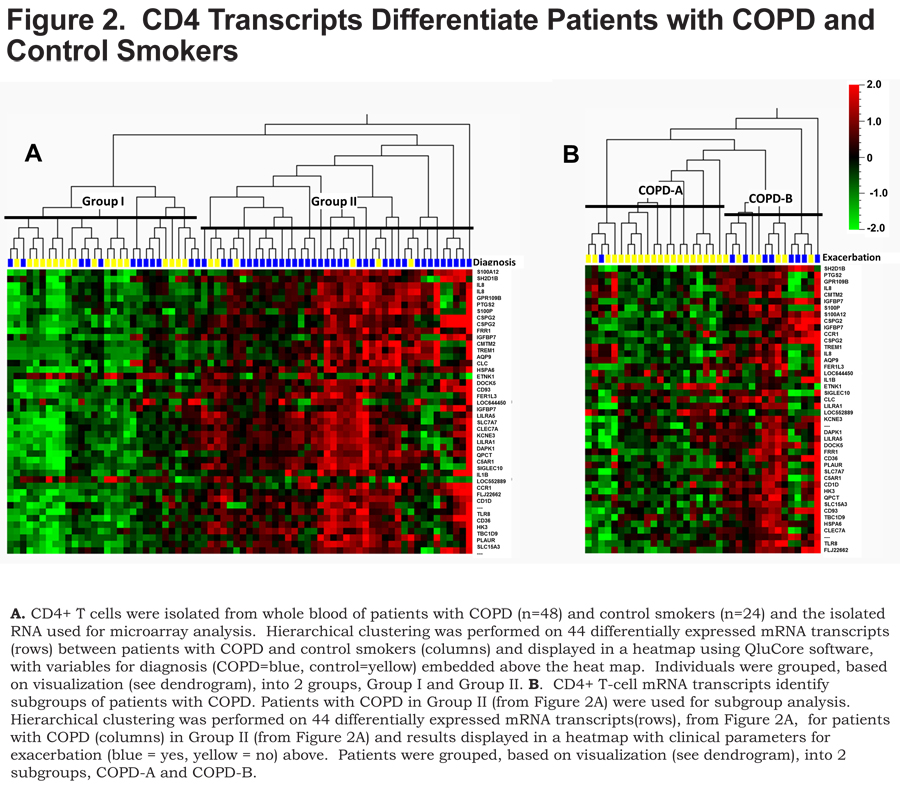
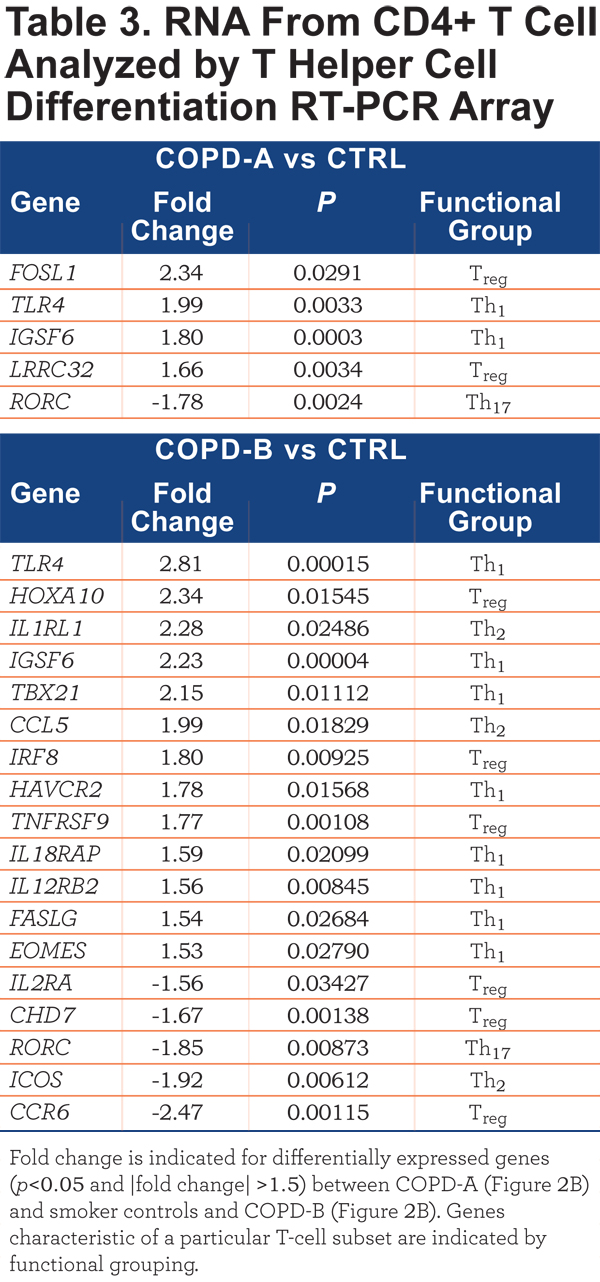
The COPD patients in Group II were subsequently clustered utilizing the 44 transcripts that differentiated COPD from controls. This analysis revealed 2 major subgroups, based on data-visualization, of COPD patients – COPD-A (Figure 2B, left) and COPD-B (Figure 2B, right). These subgroups did not differ on clinical characteristics or medication usage except that the subgroup COPD-B had more patients with COPD exacerbations (exacerbation history), 53% compared to 5% in the COPD-A subgroup (Table 2) (Figure 2B, exacerbation top: blue = exacerbation history) (Fisher’s exact test p=0.002).
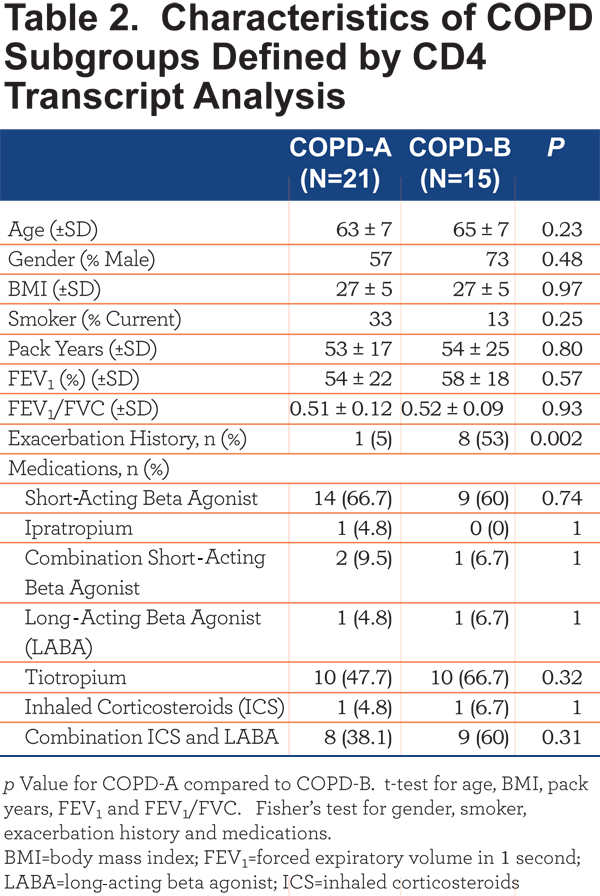
The CD4+ T-cell RNA was further investigated using a T Helper Cell Differentiation RT-PCR 84 gene array. The CD4+ T cells of COPD-A (Figure 2B) patients did not differ greatly from control smoker CD4+ T cells (Table 3). However, the blood CD4+ T cells from the COPD-B (Figure 2B) patients (exacerbation enriched) differed from controls in the expression of 18 genes, 13 with up-regulation and 5 with down-regulation (all p<0.05;Table 3). Interestingly, COPD-B individuals (exacerbation enriched) had higher expression of 8 Th1-related genes, indicating a predominance of Th1 gene involvement in this subgroup (p=0.04, Fisher’s exact test, Table 3).
In contrast to the results of CD4+ T-cell mRNA; there were no significant differentially- expressed transcripts between COPD and controls in whole blood, CD8+ T cells and CD14+ monocytes. Thus, of the cell types examined, only CD4+ T-cell transcripts separated patients with COPD from control smokers and differentiated subsets of patients with COPD.
Diminished Cytokine Response to T-Cell Directed Ex-Vivo Stimulation in the Peripheral Blood of COPD Patients
The flow cytometry and microarray results identified differences in CD4+ T cells in patients with COPD compared to control smokers (Figures 1 & 2). These data lead us to question whether there were also functional changes in the T cells of patients with COPD. To address this question, we examined the cytokine response of whole blood, from patients with COPD and control smokers, to T-cell stimulation using α-CD3/α-CD28. We utilized the TruCulture® ex-vivo system for activation of whole blood T cells with minimal experimental manipulation. 21 Supernatants from α-CD3/α-CD28 stimulated whole blood (TruCulture® system) from patients with COPD and control smokers were analyzed by TruCulture MAPv1, a 47 analyte multiplexed immunoassay (online supplement Table S1). Of the 47 analytes, 5 were present at significantly lower (p<0.05 and fold change at least 1.5) amounts, after stimulation, in the supernatant from COPD compared to controls, GM-CSF, IFN-ɣ, IL-1α, TNF-α, and TNF-β (Figure 3A).
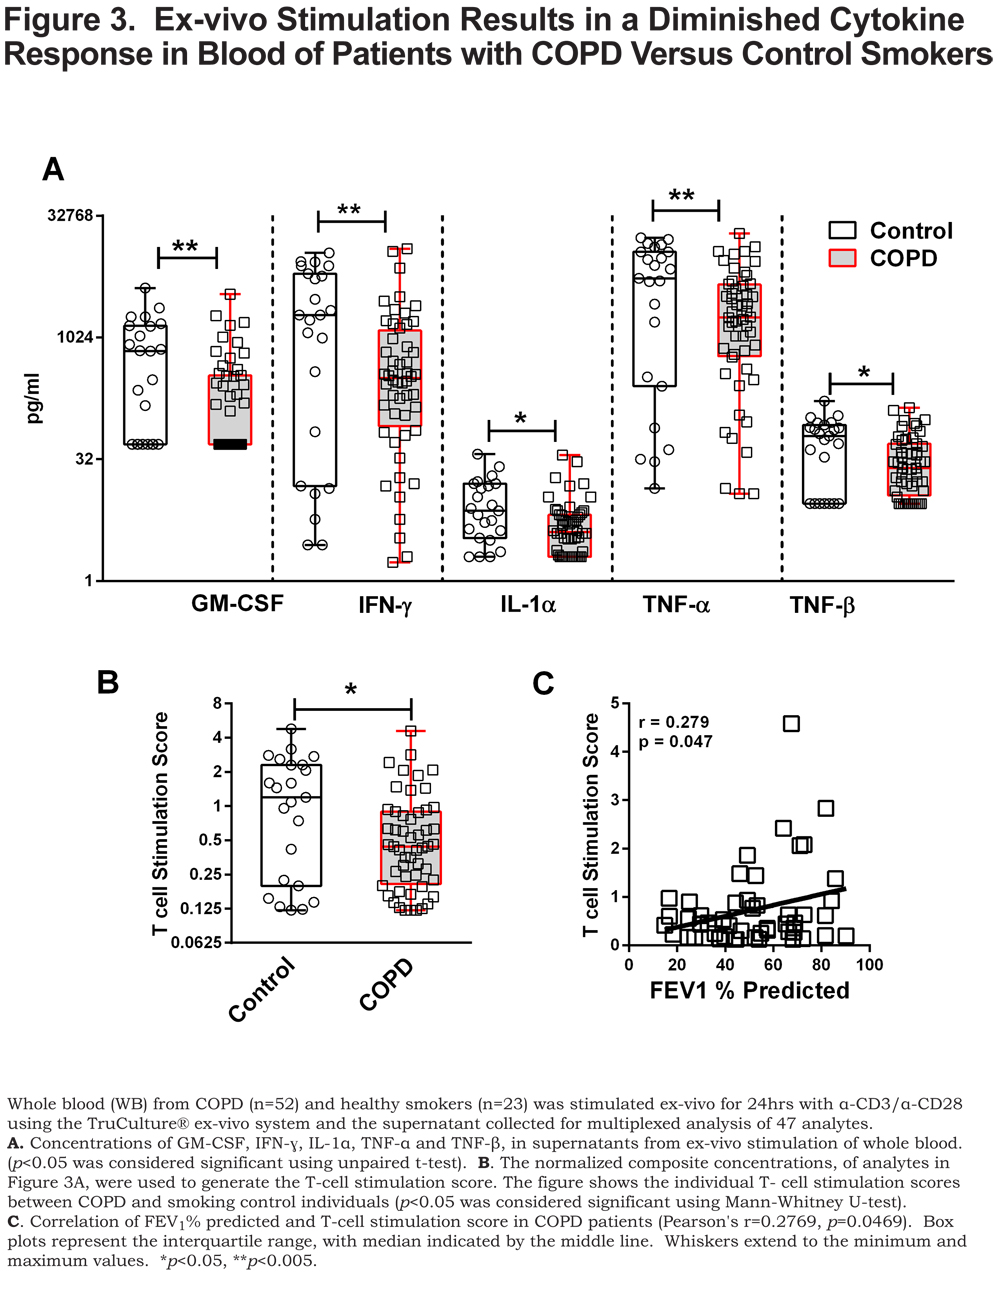
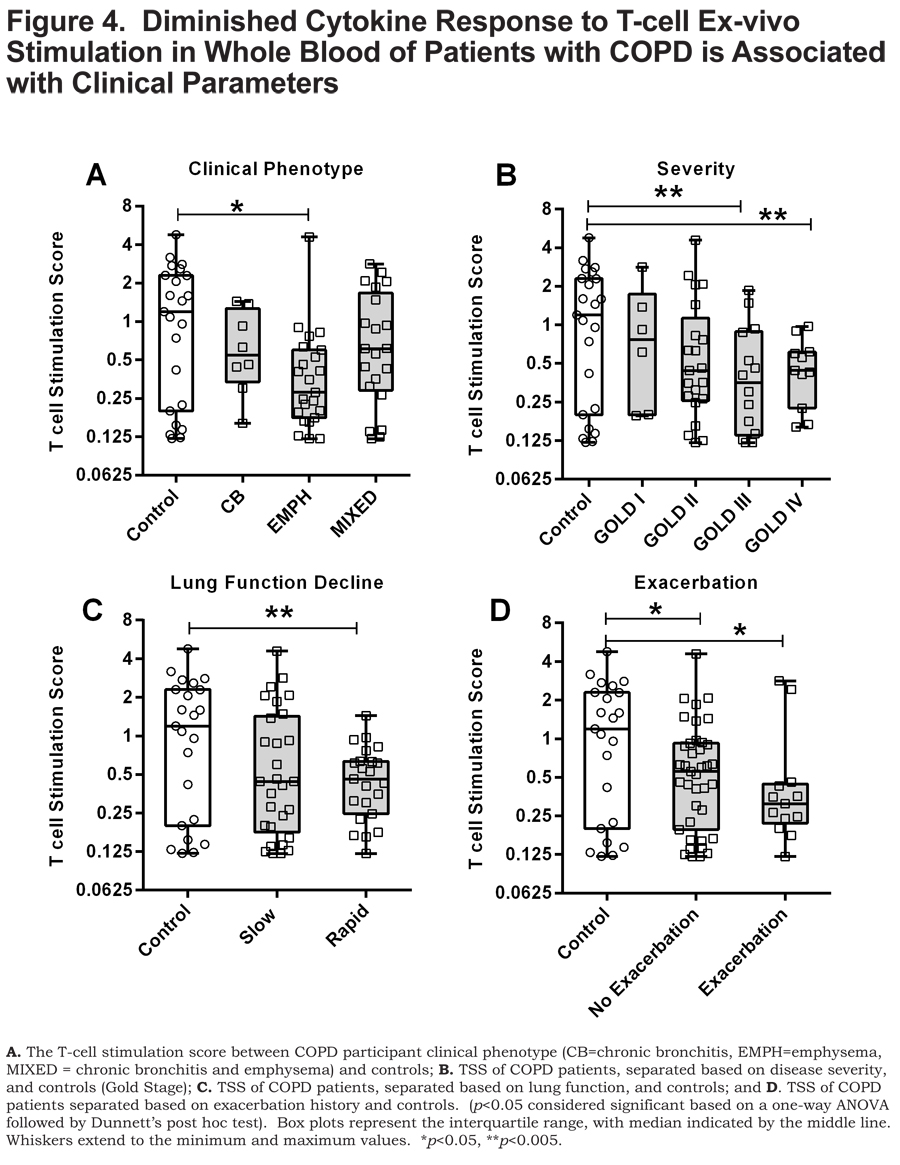
As a means to probe the collective significance of these individual cytokines, we created an ex-vivo response score, the T-cell stimulation score (TSS), a normalized composite of GM-CSF, IFN- ɣ, IL-1α, TNF-α, and TNF-β concentrations. Each individual cytokine concentration was normalized to the highest concentration such that the highest value possible is 1. Each of the cytokine normalized values across an individual participant was summated to create the TSS. The TSS was lower in patients with COPD compared to control smokers (p<0.05) (Figure 3B) and, interestingly, correlated with FEV1% predicted in patients with COPD (p<0.05) (Figure 3C). Of the individual cytokines that comprise the TSS, the levels of GM-CSF, IFN- ɣ and TNF-α correlated to FEV1% in COPD (online supplement Table 2). The TSS was lower in patients with COPD that have emphysema (p<0.05) (Figure 4A), more severe disease, GOLD stage III and GOLD stage IV (Figure 4B) (both, p<0.005), and those with rapidly declining lung function (p<0.005) Figure 4C). In patients with COPD with or without an exacerbation history, the TSS was lower, compared to control smokers (Figure 4D) (both, p<0.05). Importantly, the TSS did not correlate with age, pack years, or CD4+ T-cell numbers and there was no difference in the TSS between current and former smokers in our cohort (online supplement Figure S2). There was also no difference in the TSS among COPD individuals with regards to current medication status (online supplement Figure S3). These data indicate that the disparate response to T-cell stimulation was biologically driven as opposed to differences in demographics, CD4+ T-cell number, smoking status and treatment status. Whereas the mechanisms controlling the disparate response of T cells from COPD patients relative to controls, to ex-vivo stimulation of T cells, remains unanswered, it is important to note that this observation is a result of α-CD3/α-CD28 stimulation as there was an induction of these cytokine responses above the baseline unstimulated (null) blood sample (stimulation index) (online supplement Table S3).
Discussion
The development of effective medicines for COPD continues to be a challenge partly due to disease heterogeneity and lack of disease biomarkers.22 The development of blood (an easily accessible tissue) biomarkers would enhance the understanding of COPD pathophysiology and facilitate patient subdivision. T cells in COPD, primarily CD8+ and to a lesser extent CD4+, have been well-characterized as a part of the cellular infiltrates in the airways and lungs of patients with COPD.23-25 In this study, similar to others, 26,27 we find that patients with COPD have a decrease in blood CD4+ T cells compared to control smokers. We also report a decrease in the CD4+ central memory, CD4+ effector memory and CD4+CD146+ T-cell subsets compared to control smokers.
Previous reports on the phenotypic profiles of peripheral blood T-cell subsets in patients with COPD have been inconsistent.26-33 Several studies have found no significant differences in CD4+ T-cell subsets in COPD compared to either control smokers, non-smoker controls or a combination of both populations.30,31. For consistency of interpretation, our control smoker population consisted of long term smokers without obstruction. Interestingly, one of the studies that did not show a difference in CD4+ T cells in patients with COPD at baseline, described a decrease in CD4+ T cells following experimental rhinovirus infection – a model of COPD exacerbation. 30 Our observation of decreased CD4+ T cells in patients with COPD, compared to control smokers, was not related to an acute exacerbation as our cohort was not studied around the time of an exacerbation.
Other studies have demonstrated increased CD4+ T-cell subsets by examining CD4+ cytokine producing cells.28,29,32 It is important to note that we present immunophenoptypic data and that an examination of the ability of the CD4+ T-cell subsets to produce their characteristic cytokine (e.g., IFN-ɣ) was not assessed. Nevertheless, the convergence of data denotes blood CD4+
T-cell dysregulation in our cohort of patients with COPD compared to the control smokers. Importantly, our results were irrespective of whether individuals were current or former smokers.
The reasons for the contrasting results describing CD4+ T cells and subsets, in patients with COPD, are difficult to resolve due to the various methods of detection, surface markers versus intracellular cytokines, and the make-up of the study populations. That said, dysregulated homeostasis and cytokine profiles in discrete CD4+ T-cell subsets contribute to the pathophysiology of COPD.34-37 Mechanistically, the lower numbers of CD4+ T cells we observed, in patients with COPD, may reflect enhanced migratory potential away from the periphery towards sites of local tissue damage in a response to infection.30,38
Previous gene expression studies in COPD have identified transcription changes in the lung and more recently PBMCs.39-41 We show for the first time that CD4+ T-cell transcriptomic patterns are distinct from control smokers. Additionally, the CD4+ T-cell transcriptomics revealed distinct subgroups including one enriched for patients with COPD that have an exacerbation history. Moreover, this subgroup was defined by a predominance of Th1-related genes, compared to control smokers, as assessed by the RT-PCR array data. These results are interesting, as Th1-driven adaptive immunity has been reported in the pathophysiology of COPD.32,42 Taking into account our data, we suggest that CD4+ T-cell profiling can identify subgroups of COPD patients that share a common biology that relate to and/or drive disease manifestations. Thus, functional aberrations in CD4+ Th1 cells in a subgroup of patients with COPD, may accentuate exacerbation susceptibility.
Comparable mRNA transcript analyses of isolated CD8+ T cells and CD14+ monocytes were unable to differentiate patients with COPD from control smokers. This result was surprising as CD8+ T cells and monocytes are known to be contributors in the inflammatory response to cigarette smoke.7,43 However, the data demonstrate that COPD-associated alterations in blood CD4+ T cells are the most easily discoverable. This result suggests that CD4+ T cells may be chief drivers of the dysregulation of immune cell functions in COPD.
We hypothesized that the response to T-cell directed stimulation could provide a means to mechanistically differentiate patients with COPD. Consistent with this hypothesis, patients with COPD, compared to control smokers, were characterized by a diminished functional cytokine response (lower TSS) to T-cell polyclonal activation (α-CD3/α-CD28). Furthermore, the ex-vivo cytokine response (TSS) correlated with severity (FEV1%) of COPD and associated with rapid decline of lung function (loss of FEV1) and COPD exacerbation. The responses were independent of smoking status or CD4+ T-cell number indicating in-vivo dysregulation of T cells as a disease-related phenomenon in COPD.
T cells can modulate the innate immune response and this adaptive modulation is necessary to temper early innate responses.44,45 In COPD, the ability to mount this adaptive response is impaired in in-vitro-differentiated CD4+ Th1 T cells.46 Our study does not examine adaptive cell regulation of innate immune responses. However, this may, in part, explain the diminished cytokine response to T-cell ex-vivo stimulation. Our experiments utilized global T-cell stimulus (α-CD3/α-CD28) and as such it cannot be determined whether CD4+ T cells, rather than CD8+ T cells, drive these aberrant cytokine responses. However, based on our observations of phenotypic and gene expression differences only in the CD4+ T-cell subset, it would be tempting to suggest that the diminished cytokine responses are at least partially attributed to CD4+ T cells. Overall, as suggested by our data, it is possible that altered T-cell responses may contribute to functional changes in the innate immune system and therefore modify early response to infectious agents.
In conclusion, our data suggests, that in patients with COPD, in-vivo activation of blood CD4+ T cells result in functional variation of immune responses that can provide biological segregation of COPD patients. Our study represents novel preliminary findings and provides impetus for follow-up studies in a larger independent validation cohort. Nonetheless, we demonstrate the utility of blood immune cell profiling and responses in biomarker discovery applications for COPD. An understanding of individual immune cell aberrations in COPD can lead to stratification of patients whose disease is directed by shared biology and therefore assist in the simplification of drug development in this heterogeneous disease population.
Acknowledgements
The authors thank Christina Schnell, Jennifer Underwood and the nurses of the Clinical Translational Research Center at National Jewish Health for patient recruitment, administering questionnaires and blood collections.
Declaration of Interest
M. Roberts declares an employee relationship with MedImmune. B. Higgs, P. Brohawn, F. Pilataxi, X. Guo, M. Kuziora, and W. White declare an employee relationship with MedImmune and ownership of AstraZeneca stock. R. Bowler declares no competing interests. The authors alone are responsible for the content and writing of the manuscript.