Running Head: Panlobular Emphysema and CT
Funding: National Institutes of Health KL2 Scholarship, 1KL2TR001419
Date of Acceptance: February 4, 2016
Abbreviations: Panlobular emphysema, PLE; computed tomography, CT; diffusion capacity of carbon monoxide, DLCO; forced expiratory volume in 1 second, FEV1; peak oxygen consumption, VO2; ventilatory equivalent ratio for carbon dioxide, VE/VCO2; inspiratory capacity, IC; 15th percentile point, Perc 15; chronic obstructive pulmonary disease, COPD; St. George’s Respiratory Questionnaire, SGRQ; transforming growth factor beta, TGF-β; centrilobular emphysema, CLE
Citation: Bhatt SP. Panlobular emphysema: enhancing visibility with quantitative computed tomography. Chronic Obstr Pulm Dis. 2016; 3(3): 683-687. doi: http://doi.org/10.15326/jcopdf.3.3.2016.0130
Introduction
Panlobular emphysema (PLE) can be difficult to diagnose both pathologically and radiographically. We present a probable case of PLE that remained undetected using conventional diagnostic methods but was detected using quantitative computed tomography (CT).
Case Presentation
A 46-year-old African-American female with Marfan syndrome and mitral valve prolapse presented with progressive shortness of breath. She had suffered from exertional dyspnea for several years and at the time of presentation had shortness of breath after climbing 2 flights of stairs and sometimes even with activities of daily living. She did not have any dyspnea at rest, orthopnea, paroxysmal nocturnal dyspnea, wheezing or chest pain but did report that it was taking her progressively longer to recover from exertion and that she had a dry cough as well as intermittent swelling of her feet. She reported a history of bilateral lens dislocation. She was a lifetime nonsmoker, worked in health care, and did not have any occupational exposures. She had a normal birth weight and had no history of childhood respiratory illnesses including bronchial asthma. She had no birds, and did not report any significant travel history.
On examination, she did not appear in any distress. She was 1.75 m tall with Marfanoid features, and had mild kyphoscoliosis. Lungs were clear to auscultation without any adventitious sounds. Post bronchodilator spirometry revealed a mild defect which was not clearly obstructive or restrictive (Table 1, 2012 column). Diffusion capacity of carbon monoxide (DLCO) was 61% predicted. A 2-D echocardiogram showed mild prolapse of the posterior mitral leaflet with mild mitral regurgitation but the left and right ventricular systolic functions were normal and there was no evidence of pulmonary hypertension. A CT of the chest did not show parenchymal lung disease and revealed a right sided aortic arch but without aortic dilatation or dissection. It was recommended that she exercise more but no other specific treatments were started with the plan to monitor her symptoms over time. She was on chronic beta blocker therapy and valsartan. She returned to the clinic 4 months later and reported that her dyspnea was somewhat better and continued observation was planned.
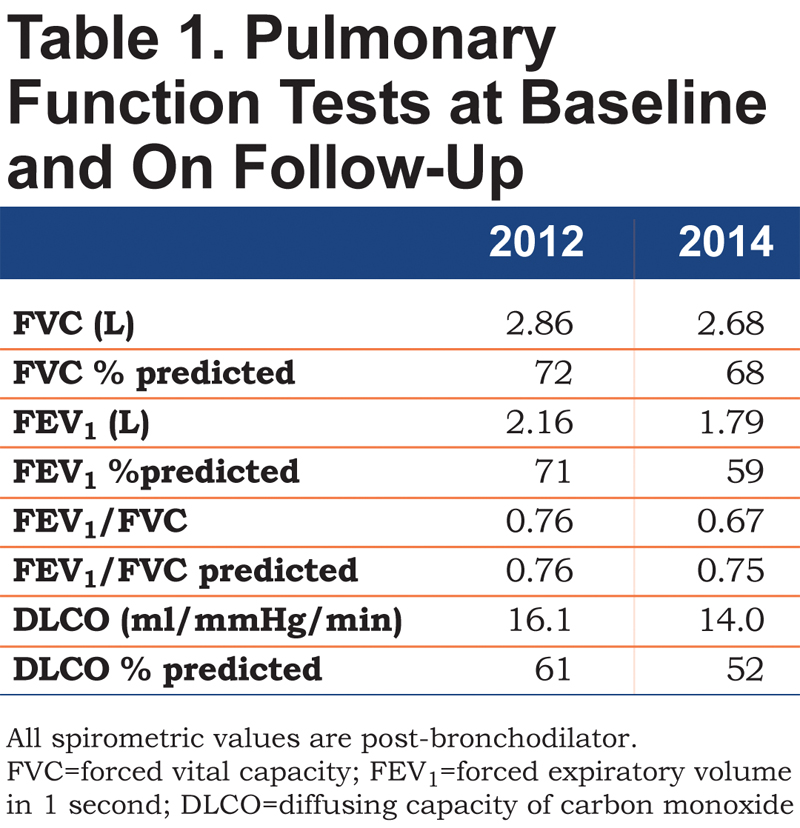
At a subsequent follow-up 1.5 years later, she reported more significant shortness of breath and could only climb 1 flight of stairs or walk half a mile on level ground at her own pace before having to stop. Spirometry showed a reduction in forced expiratory volume in 1 second (FEV1), with a ratio suggestive of obstructive defect (Table 1, 2014 column). DLCO was 52% predicted. In the interim, a CT scan of the chest had been performed twice for evaluation of her aorta following episodes of chest pain and neither scan revealed any parenchymal lung disease. A repeat 2-D echocardiogram did not show any changes from the earlier study and a right heart catheterization performed at rest and during exercise did not show pulmonary hypertension. A high-resolution CT of the chest again did not reveal any parenchymal lung disease or bronchial wall thickening (Figure 1).
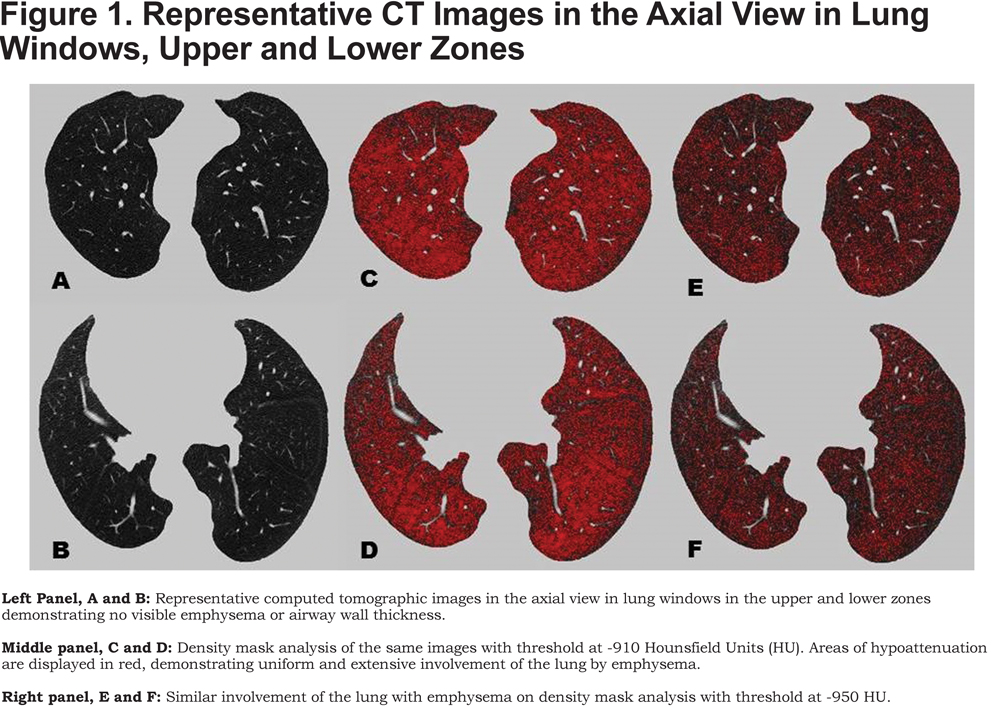
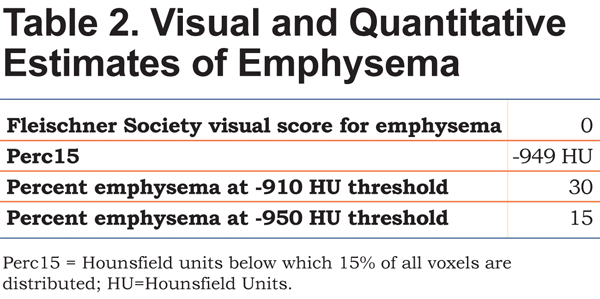
Subsequently, a cardiopulmonary exercise test was performed. She exercised on a cycle ergometer at a 20W ramp for approximately 7 minutes and reached a peak oxygen consumption (VO2) of 59% predicted (11.5 ml/kg/min), with a heart rate reserve of 29 percent. Her ventilatory anaerobic threshold was normal at 50% of predicted maximal. Her maximal breathing frequency was 40/min with a breathing reserve of 30.5% at peak exercise. There was no desaturation with exercise and ventilatory equivalent ratio for carbon dioxide (VE/VCO2) at anaerobic threshold was normal at 31. Serial inspiratory capacity (IC) maneuvers were performed at rest and every 2 minutes during exercise. Her IC decreased from 1.86L (73% predicted) at rest to 1.02L (40% predicted) at peak exercise, a 49% decrement, suggesting significant dynamic hyperinflation. With the background of a known genetic disorder associated with the possibility of diffuse parenchymal lung disease, a discrepancy between visual analysis of lung parenchyma and quantitative analysis was suspected. The last CT scan was reanalyzed for quantitative estimation of emphysema using 3D Slicer software (www.airwayinspector.org).1 Quantitative estimates of emphysema rely on density mask analysis thereby measuring the density of each voxel in Hounsfield Units (HU) on a high resolution CT scan. We measured the 15th percentile point (Perc 15), a commonly accepted measure of emphysema severity.2 When all voxel densities are arranged along a distribution histogram, the Perc15 is defined as the threshold value in HU below which 15% of all voxels are distributed. We also quantified emphysema using threshold analyses whereby the percentage of lung affected by emphysema is defined by the number of voxels with attenuation less than a certain HU threshold divided by the total number of voxels in the lung fields, after extraction of the larger airway branches up to the subsegmental level. The percentage of voxels below <-910 HU indicates the amount of lung affected by mild emphysema, whereas the percentage of voxels below the -950 HU threshold indicates severe emphysema.3 Table 2 shows the values for qualitative and quantitative estimates of emphysema. Figure 1 and Online Supplement Videos 1 and 2 also show the extent of involvement of lung by emphysema on quantitative measurement that was not appreciated on visual analysis.
Discussion
The characterization and phenotyping of chronic obstructive pulmonary disease (COPD) has seen major advances in the recent past. Although the traditional diagnosis of COPD relies on demonstrating airflow obstruction on spirometry, CT can provide complementary information on structural lung disease.3 Differences in quantifying disease severity on qualitative visual readings of CT scans and quantitative CT are well documented.4 We present a case where the diagnosis of emphysema was not evident despite multiple CT scans in the presence of clear airflow obstruction and progressively worsening DLCO. We suspect this is due to uniform involvement of the lung parenchyma by PLE that was not evident on visual analysis.
CT is a validated technique for both qualitative and quantitative assessment of emphysema, air trapping and airways disease.3 Quantitative measurements are more reproducible and useful for global estimates of lung involvement by emphysema, whereas qualitative visual estimates are useful in detecting mild, localized emphysema as well as in differentiating emphysema subtypes and their spatial distribution.3 Quantitative CT may also facilitate these differentiations of emphysema patterns into distinct phenotypes.5 This case illustrates the advantages of quantitative CT as a complementary tool to qualitative assessments of CT emphysema. This is because visual estimates depend not only on the extent of lung hypo-attenuation but also on the spatial distribution of the low attenuation areas. The human eye best appreciates abnormalities when presented with contrasts. It can detect contrast in the range of 1:400 to 1:800, and the 1024 gray shades on a fixed static CT image exceed the capabilities of the human eye.6 Visual estimates are also subject to under- and over-estimation at the lower and higher ranges respectively of lung involvement by emphysema.4 As such, there is only moderate concordance between visual and quantitative CT assessments for the presence of emphysema.7,8 The Perc15 value of -949 HU seen in our patient indicates a much lower lung density than normal.3 There was 30% involvement using a -910 HU threshold for mild emphysema and 15% involvement using a -950 HU threshold for severe emphysema. Although there are no established standards for normal values for these thresholds, a recent large study showed that healthy, older non-smokers have median emphysema-like lung percent of 15.8% and 1.1% at the -910 HU and -950 HU thresholds respectively. This degree of quantitative emphysema is substantial and has been shown to be independently associated with worse respiratory quality of life (as measured by St. George’s Respiratory Questionnaire [SGRQ]); for every 10% increase in severe emphysema, SGRQ increases by 5.8 units.9
Our patient likely has PLE associated with Marfan syndrome. Marfan syndrome is an autosomal dominant genetic disorder resulting from mutation in the FBN1 gene on chromosome 15 and predominantly affects the cardiovascular system, eye and skeletal structures.10 This gene codes for the glycoprotein fibrillin, an essential component of the extracellular matrix, which in combination with other matrix proteins forms microfibrils that provide elasticity and strength to tissues. Defect in this gene results in faulty microfibrils that have decreased binding to transforming growth factor beta (TGF-β). Accumulation of TGF-β in the extracellular matrix induces expression of matrix metalloproteinases that can cleave the microfibrillar network, thus creating a vicious cycle.11
Cardiovascular manifestations including aortic dilatation dominate clinical concerns and prognosis, and although kyphoscoliosis and pectus excavatum can result in extra-pulmonary restriction on spirometry, intrinsic pulmonary manifestations are generally not considered. Numerous pulmonary manifestations have been described in association with Marfan syndrome and include interstitial lung disease, bronchiectasis, congenital bronchial malformations and bullous lung disease.12 Spontaneous pneumothorax has been reported in 5% of cases of Marfan syndrome.12 There is scant data in the literature on lung pathology though 1 series suggested that most patients have paraseptal emphysema.13 Centrilobular and panlobular emphysema are less often described.13,14 In contrast to centrilobular emphysema (CLE), which is defined by the preferential loss of alveolar septae at the center of the secondary lobules, PLE is characterized by the uniform loss of alveolar septae throughout the secondary lobules, and the diffuse uniform changes make it difficult to recognize PLE both pathologically and radiographically. CLE is most commonly associated with cigarette smoking and occurs predominantly in the upper lobes. PLE more commonly affects the lower lobes, especially as seen in association with alpha-1 antitrypsin deficiency. PLE can also result from intravenous injection of crushed methylphenidate, Swyer James syndrome, aging and from cigarette smoking.15 Although previous cross-sectional pathologic studies suggest that CLE and PLE are distinct diseases with differential involvement of small airways and inflammatory changes,16,17 recent radiologic phenotyping studies have raised questions about whether PLE is a more advanced stage of CLE.18 The recent Fleischner Society statement on CT-definable subtypes of COPD describes primary PLE only in the context of alpha-1 antitrypsin deficiency, seen predominantly in the lower lobes, and suggests that PLE in other forms of emphysema represents a more advanced form of CLE, terming this “advanced destructive emphysema.”3 We report that primary PLE can occur in Marfan syndrome and can affect the entire lung uniformly. An additional reason for underappreciation of PLE is that for a given degree of emphysema, compared to CLE, PLE is associated with greater lung compliance, and with lower FEV1, thus potentially causing spirometric abnormalities seemingly out of proportion to CT visualized parenchymal disease.16,17
Our case highlights that PLE can occur diffusely without CLE and can be difficult to diagnose in the presence of homogeneous involvement of the lung. Quantitative CT can be complementary to spirometry and visual CT estimates in such cases. This report has implications for case finding and diagnosis of patients with airflow obstruction, especially in patients with spirometric findings seemingly out of proportion to CT findings.
Acknowledgements
The author would like to acknowledge Sandeep Bodduluri, MS (Department of Radiology and Biomedical Engineering, University of Iowa, Iowa City) for performing the quantitative CT analyses and providing images. Written informed consent was obtained from the patient who was gracious to let us report her medical condition.
Declaration of Interest
SPB has no conflicts of interest relevant to this manuscript. SPB is funded by the National Institutes of Health KL2 Scholarship (1KL2TR001419).