Running Head: SGRQ Responder Analyses in COPD
Funding Support : Funding for this COPD Biomarkers Qualification Consortium working group was provided by AstraZeneca, Boehringer-Ingelheim, GlaxoSmithKline, Novartis and Pfizer.
Date of Acceptance: February 6, 2017
Abbreviations: minimum clinically important difference, MCID; St George’s Respiratory Questionnaire, SGRQ; chronic obstructive pulmonary disease, COPD; long-acting bronchodilator, LAB; inhaled corticosteroid, ICS; long-acting beta2-agonist, LABA; odds ratio, OR; forced expiratory volume in 1 second, FEV1; patient-reported outcome, PRO; COPD Biomarkers Qualification Consortium, CBQC; randomized controlled trials, RCTs; least squares, LS; standard error, SE
Citation: Jones PW, Gelhorn H, Wilson H, et al. Responder analyses for treatment effects in COPD using the St George’s Respiratory Questionnaire. Chronic Obstr Pulm Dis. 2017; 4(2): 124-131. doi: http://doi.org/10.15326/jcopdf.4.2.2017.0130
Introduction
Chronic obstructive pulmonary disease (COPD) is a complex, multi-component disease which imposes a significant burden on both patients and health care systems.1 The measurement of decline in lung function, specifically forced expiratory volume in 1 second (FEV1), has traditionally been the most frequently used parameter to assess the effectiveness of treatments in clinical trials.2 However, the poor relationship between FEV1 and other markers of COPD outcomes has highlighted the importance of including patient-reported outcomes (PROs) in clinical trials to measure the effects of treatment on components of the disease that impact patients’ activities of daily living and quality of life.1,3,4,5
In the clinical trial setting, significant changes in PRO measures are usually reported as mean values, and the difference in mean values between treatments is then compared with reference to a previously derived value for the minimum clinically important difference (MCID).6 If the average improvement is less than the MCID, this is often interpreted to mean that the treatment difference is not clinically significant. This conclusion ignores the fact that the difference between the means indicates a shift of the distribution of responses and that a sizable proportion of patients may have improved by more than the MCID. An alternative approach is to perform a responder analysis to examine the odds or probability of achieving a clinically significant improvement in each group.
The St George’s Respiratory Questionnaire (SGRQ) is a self-administered health status questionnaire which has an empirically determined MCID of -4 units.7 The objective of this analysis was to test the reliability of responder rates estimated with a range of threshold values for a SGRQ response, above and below the MCID, using pooled patient data from the COPD Biomarkers Qualification Consortium (CBQC) database.8
Methods
Pooled individual patient data for this analysis were obtained from 17 randomized controlled trials (RCTs) identified in the CBQC database, fulfilling the criteria of: (1) treatment comparison of placebo with either long-acting bronchodilators (LAB) (long-acting beta2-agonists [LABA] or long-acting anti-muscarinic agents) or LABAs + inhaled corticosteroid treatment (LABA+ICS), and (2) having the SGRQ as a study outcome. The RCTs comprised 14 short term studies of less than 1 year in duration (N=14,814, of which 13,131 were taking 1 of the 3 relevant treatments and were included in this analysis as evaluable patients) and 3 medium-term studies of 2-4 years’ duration (N=12,043, providing 10,797 evaluable patients). Further details on the RCTs are available elsewhere.9 The objectives and description of the CBQC initiative has been reported in detail previously.8
Outcome Measure and Analysis
The outcome of interest was the SGRQ total score.7 The objective of this analysis was to evaluate responder rates across a range of SGRQ thresholds to determine the effects of choice of responder threshold on the size of treatment difference between placebo and active drug. An additional analysis explored the presence of super-responders, i.e., patients showing an improvement in SGRQ that exceeded the 4-unit MCID by 3 times.
All analyses were conducted using the short-term and medium-term databases, but were limited to analysis of outcomes at 6 months in the short-term studies since this is a common duration for such trials and in the medium-term trials the responder status was established at 1-year post-baseline, to minimize bias due to the progressive nature of changes in the SGRQ score in COPD,10,11 and differential patient drop-out rates.12
Responder analyses were used to assess SGRQ change from baseline by treatment class, based on classification of response (responders/ non-responders) using thresholds from -1.5 to -8.0 and -12.0. Logistic regression models were used to examine the odds ratios (ORs) of response in the 2 treatment groups compared with placebo. Adjustment for the following covariates was included: age, income, World Health Organization region, sex, year of study start, COPD duration, body mass index, smoking status, and FEV1% predicted. Patients with any missing data were omitted from the analyses.
Results
Patient Population
The demographic and clinical characteristics of patients with COPD included in the CBQC database8 have been described in the baseline descriptive paper that has been published as part of this series.
Mean Changes in SGRQ Score
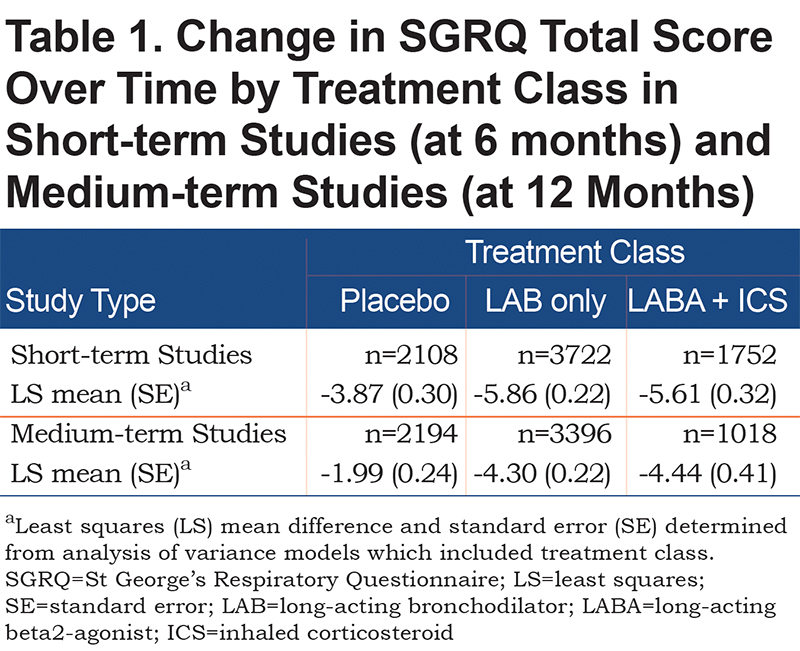
The mean changes in SGRQ score in the 3 treatment groups are shown in Table 1. In short term studies the mean differences from placebo at 6 months for LAB and LABA/ICS were -1.99 and -1.74 respectively. In the medium-term studies the mean differences from placebo at 12 months for LAB and LABA/ICS were -2.31 and -2.45 respectively.
Responder Rate
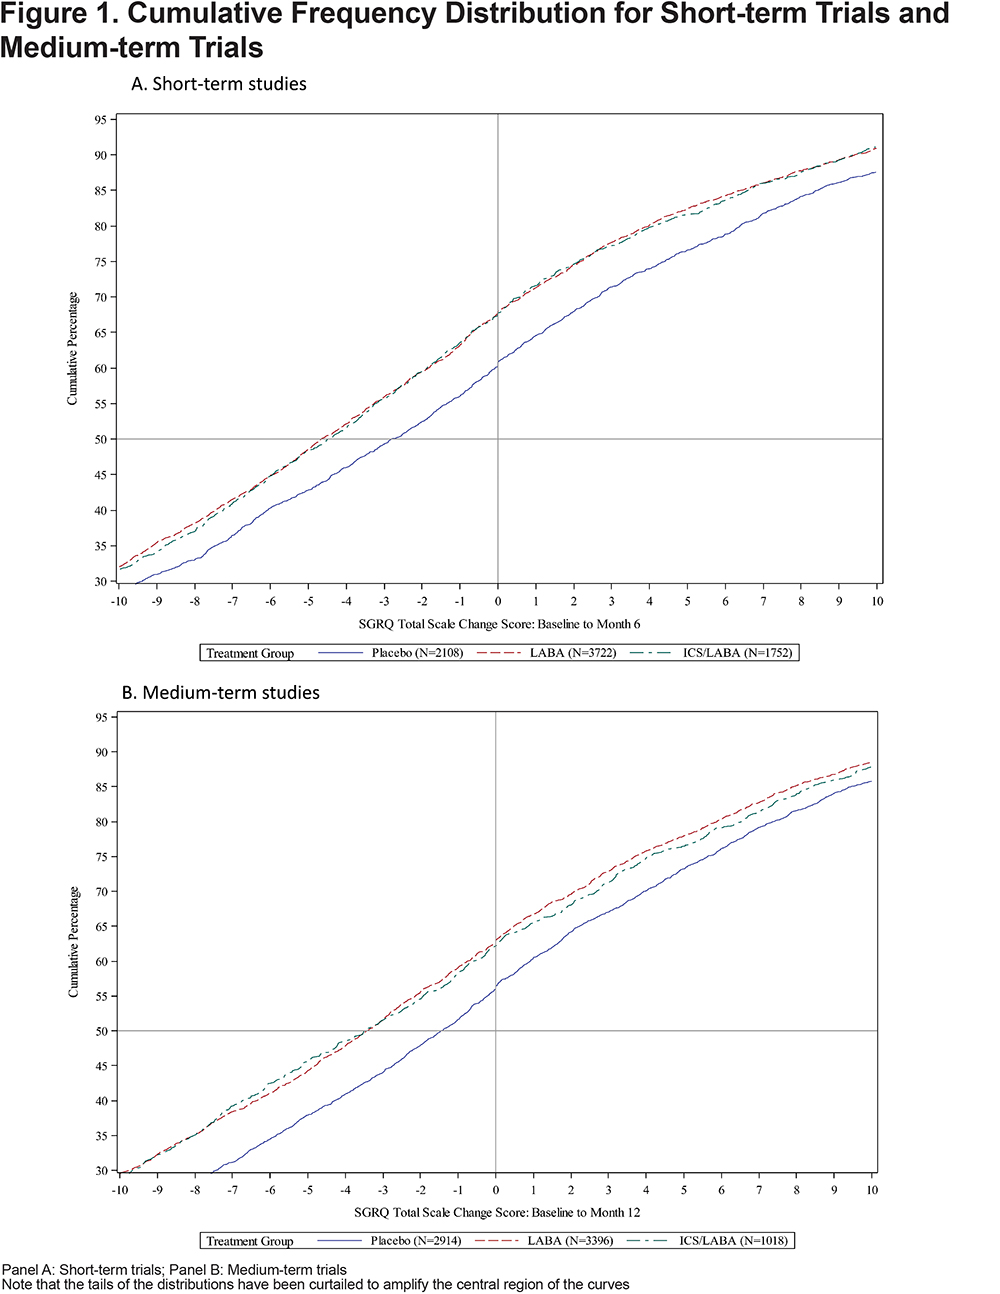
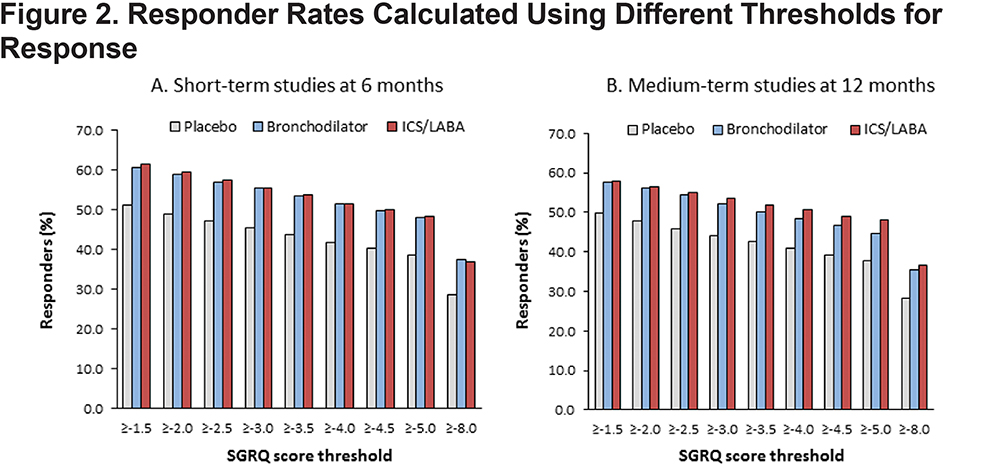
Cumulative frequency distributions for placebo and active treatment are shown in Figure 1. Responder rates for placebo and active treatment (LAB and LABA/ICS) were lower with higher responder thresholds in both the short-term and medium-term studies (Figures 2A and 2B). In both short- and medium-term studies, ≈40% of placebo-treated patients achieved the MCID threshold of 4 points and ≈30% were defined as responders, even using a threshold of 8 units (twice the MCID) (Figures 2A and 2B).
Odds Ratios for Responder Rates: Active Treatment Versus Placebo
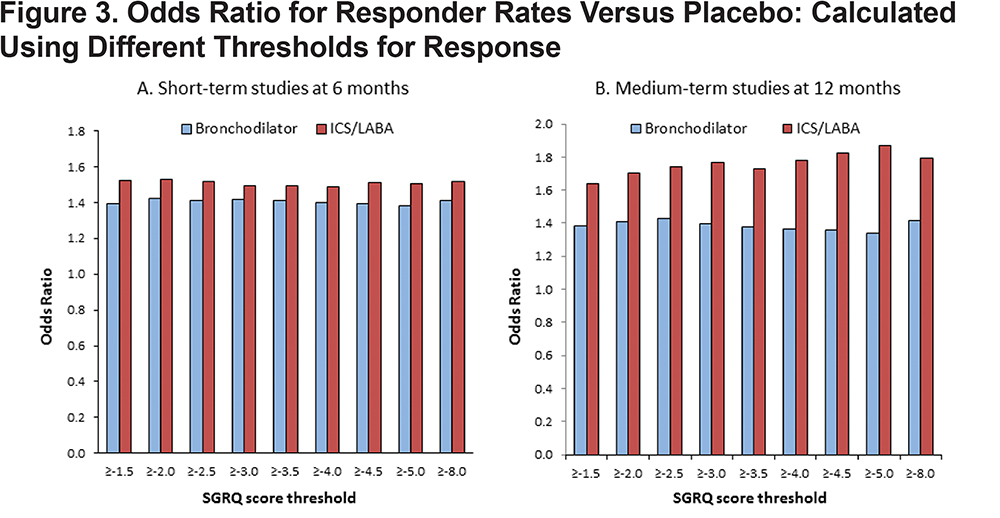
In the short-term studies, at 6 months, the OR for active treatment versus placebo remained almost constant across the range of threshold values tested (LAB alone 1.40-1.42; LABA/ICS 1.50-1.56) (Figure 3A). In the medium term trials, evaluated at 12 months, the OR measuring benefit with LAB alone remained almost constant (1.34-1.43), whereas with LAB/ICS there was a discernible trend for higher ORs at higher values of threshold cut-points in the range 1.64-1.79 (Figure 3B). The OR ratio for the treatment effect (active treatment versus placebo) was very similar, whether the MCID or half the MCID (2 units) was used as the threshold (Figure 3A and B).
Odds Ratios for Responder Rates: ICS/LABA Versus Active Treatment
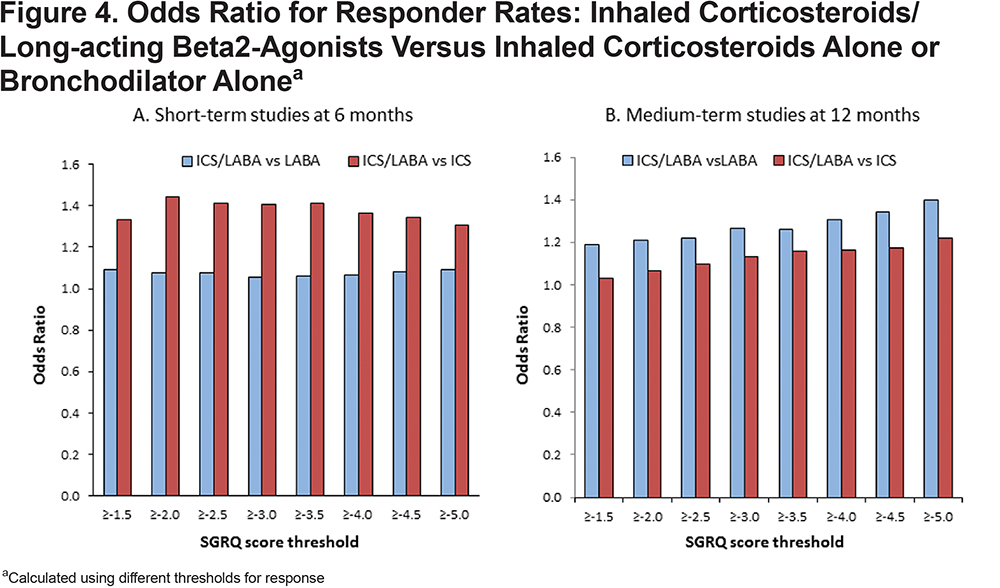
When comparing 2 active drugs (i.e. ICS/LABA versus one or other monocomponents), the choice of threshold had no consistent effect on the OR in the short-term trials, (Figure 4A), but in the medium-term trials there was a clear trend for higher ORs with higher threshold values (Figure 4B), whether comparing ICS/LABA with ICS alone or LABA alone.
Super Responders
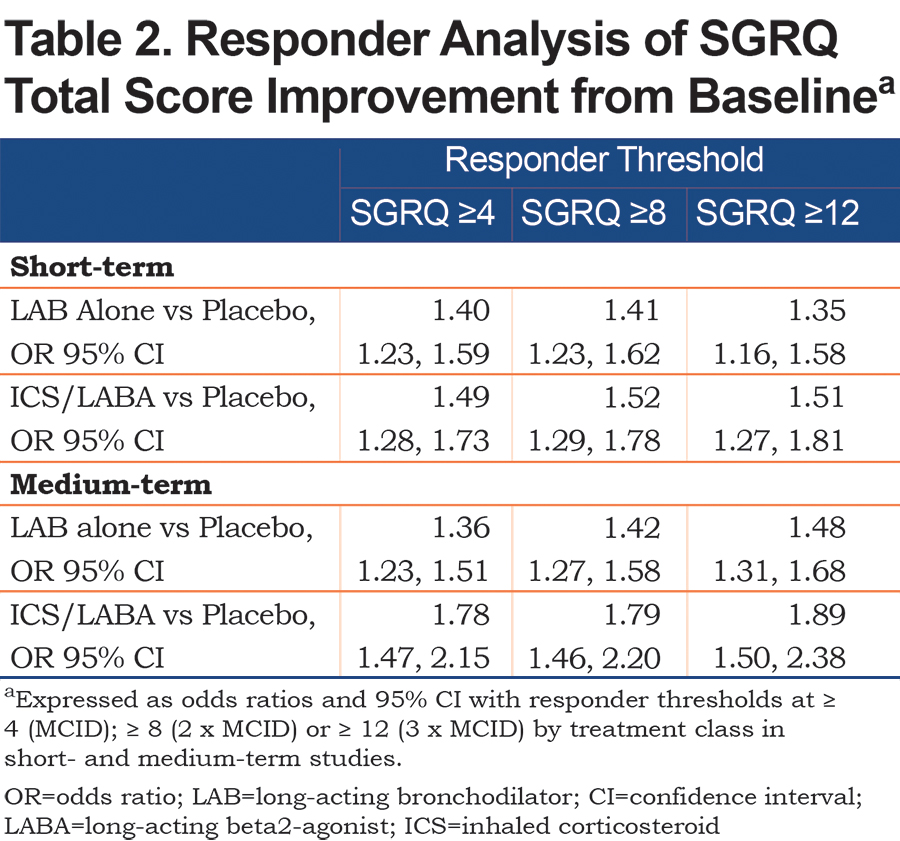
In both the short- and medium-term studies, approximately a quarter of patients on active treatment were super-responders, i.e., showed improvements in SGRQ total score of 2 or 3 times the 4 unit MCID (Table 2). In both short-and medium-term studies, there was a general trend with the OR for benefit versus placebo, whether with LAB alone or ICS/LABA, at least as large as using a 12-point cut-off as the MCID.
Discussion
The main finding from this analysis was that the OR for benefit of active drug over placebo or active drug versus another active drug was generally very consistent over a wide range of threshold values for response, from a little above the MCID (-5 units) to well below it (-1.5 units). The only exception to this general rule was in the medium-term trials where the OR for benefit, particularly for the active versus active comparisons was slightly lower (≈5%) with the threshold set at -1.5 compared to the MCID. Inspection of the cumulative distribution curves shows why the OR is so consistent – in the region of interest, the slope of the placebo and active treatment curves are almost parallel.
These observations have 2 important implications for the analysis of SGRQ data; first, it shows that the precise value of the MCID, when used in a responder analysis will have little or no impact on the estimated treatment effect; second it shows that there is no reason to postulate that a separate MCID should be created for active versus active comparisons.
The reason for the apparently greater odds of benefit for the super-responders may be largely mathematical; since the curves are almost parallel in this region, the difference between treatments will be the same, but the responder rate in the reference group (i.e., the denominator) will be lower, so the ratio will be greater. This mathematical point should not detract from the observation that within a population of responders, there is a greater likelihood of some patients getting very large benefits from treatment rather than placebo.
This analysis also illustrates the value of performing responder analyses. The mean difference from placebo in the short-term trials with either treatment group was <2 units and with the medium-term trials it was <2.5 units, both of which are well below the 4 unit MCID. However, it would be incorrect to conclude that there was no clinically relevant benefit, since with both treatments and in both trials the OR compared with placebo was >1.30 (using the MCID as the cut point), i.e., a >30% greater odds of a clinically significant benefit with treatment compared with placebo.
The strength of this analysis is that it is based on a very large body of pooled individual patient data from several trials. In fact, due to the collaborative nature of the program, the database is made up of a majority of studies performed with these agents in COPD over this time-period, so the results should be generalizable to other trials in COPD recruiting patients with a similar demographic profile. The chief weakness is that these are not within-study comparisons, but the results show a broadly consistent pattern across studies of different duration and between different treatments and different active comparators, so the findings are likely to be reliable. It is important not to make conclusions about relative treatment efficacy between treatment classes using these data, because they are indirect comparisons.
In conclusion, this analysis has shown that a responder analysis provides very similar estimates of treatment efficacy over a wide range of cut points. This applies whether the comparator is a placebo or an active drug. Use of responder analysis removes the need for any discussion about using different MCIDs for active versus placebo comparisons. Responder analysis does not obviate the use of mean differences in response rate, but it does provide a reliable and clinical method of reporting treatment effects on SGRQ scores that are meaningful in routine clinical practice.
Acknowledgments
The authors would like to thank Debbie Merrill, COPD Foundation, for managing the review process, the COPD Biomarker Qualification Consortium (CBQC) for their role in aggregating the data, and Tom Martin of Novartis and Katja Rüdell, formerly of Pfizer for their review and oversight through the CBQC Steering Committee. They also acknowledge the assistance provided by Kate Hollingworth of Continuous Improvement Ltd in copyediting and formatting the manuscript; this was funded by the COPD Foundation.
Declaration of Interest
PWJ, NK, SM, HM, SIR, RTS and MT are employees of the pharma companies who funded this analysis. KR is a former employee of Pfizer. HG and HW participated in this project as employees of Evidera, a company which performs work for hire for multiple pharmaceutical and device companies in outcomes research. DM has nothing to declare.