Running Head: Medical Costs of AATD in the United States
Funding Support: AlphaNet, Inc., a patient-founded not-for-profit offering self-management services to the alpha-1 antitrypsin deficiency U.S. patient population, provided funding for this project and the article processing charges. AlphaNet Inc, had no role in the design and conduct of the study; collection, management, analysis and reporting of the data. AlphaNet did not participate in preparation, review, approval or the decision to submit the manuscript for publication.
Date of Acceptance: March 30, 2018
Abbreviations: alpha-1 antitrypsin deficiency, AATD; physician visits, PV; emergency department visits, ED; inpatient stays, IP; augmentation therapy, AUG; other presecription drug costs, RX; other costs, OTH; chronic obstructive pulmonary disease, COPD; OptumLabs Data Warehouse, OLDW; standard deviation, SD
Citation: Sieluk J, Levy J, Sandhaus RA, Silverman H, Holm KE, Mullins CD. Costs of medical care among augmentation therapy users and non-users with alpha-1 antitrypsin deficiency in the United States. Chronic Obstr Pulm Dis. 2019; 6(1): 6-16. doi: http://doi.org/10.15326/jcopdf.6.1.2017.0187
Note: Information from this study was presented as a poster at the 2017 CHEST Conference, October 28 – November 1 in Toronto, Ontario, Canada.
Introduction
Alpha-1 antitrypsin deficiency (AATD) is a rare, genetic disorder that commonly affects lungs, causing chronic obstructive pulmonary disease (COPD) and more specifically, the emphysema subtype of COPD.1 AATD is also associated, albeit less frequently, with cirrhosis, liver cancer, vasculitis and skin disease.2 Although not all AATD-affected patients develop lung problems, for patients who do present with respiratory disease,3,4 augmentation therapy has become the gold standard for management. Augmentation therapy is an intravenous administration of plasma derived alpha-1 antitrypsin protein, which may assist with avoiding or delaying additional lung damage.5-9
Relatively few papers have examined the medical costs of AATD. This is likely because the disease is rare, therefore, finding a sufficiently large cohort for whom cost data are available is challenging. While the true prevalence of AATD remains elusive,10,11 this condition affects 1 in 2000 – 5000 people worldwide with substantial variations across regions.2,12,13 The most recent U.S. study that investigated AATD costs is more than a decade old and estimated costs through patient surveys.14 However, it is now possible to estimate costs of patients with AATD in a more precise and rigorous manner, utilizing a large national insurance claims database in the United States.
The purpose of this analysis is to present descriptive, real-world differences between augmentation and non-augmentation users without imposing any assumptions about patients’ health status or cost of comorbid conditions management. The aims of this study were to calculate medical costs of patients with AATD to the insurer and to the patient (Aim 1), then to evaluate changes in these costs over time (Aim 2). This study is the first to present direct medical costs using claims data to calculate insurance and out-of-pocket payments among a large commercially insured cohort of AATD patients in the United States.
Methods
Study Design
This retrospective analysis of the direct medical costs of AATD uses data from the OptumLabs™ Data Warehouse (OLDW), which includes de-identified claims data for privately insured and Medicare Advantage enrollees in a large, private, U.S. health plan.15 The database contains longitudinal health information on enrollees, representing a diverse mixture of ages, ethnicities and geographical regions across the United States. The health plan provides comprehensive insurance coverage for physician and hospital services, as well as prescription drugs for a subset of patients.15
Identification of Patients
AATD patients were identified based on a diagnosis claim for AATD (International Classification of Diseases, 9th and 10th Revisions: ICD-9: 273.4; ICD-10: E88.01), an augmentation therapy claim either in a facility or home setting (Current Procedural Terminology / Healthcare Common Procedure Coding System: J0256, J0257, S9346) or a pharmacy claim for augmentation products (190 distinct National Drug Code codes) during the years 1993 through 2015. The index date was the date of the first AATD-related claim. Only adult AATD patients at least 18 years of age at index date were included in the analysis. Patients over 65 years of age for whom Medicare was the primary payer were excluded from the analysis, in order to avoid bias resulting from unobserved costs.
Data Analysis
Patient demographics and clinical characteristics collected from enrollment and claims files at index date included: age, gender, race/ethnicity and census region. The Deyo-Charlson Comorbidity Score and presence of COPD/liver disease were calculated by capturing relevant comorbidities within 365 days before the index date.
Insurer and patient out-of-pocket costs were calculated and categorized into the following cost buckets: physician visits (PV), emergency department visits (ED), inpatient stays (IP), augmentation therapy (AUG), other prescription drugs costs (RX), and other costs (OTH). Patients’ out-of-pocket costs comprised the sum of copayments, coinsurances and deductibles. RX costs are only available for patients who had pharmacy insurance coverage through the same payer, all other buckets represent the entire sample as no patients have RX coverage without medical coverage. Descriptive statistics for costs are reported as the mean and standard deviation. When examining the demographic and baseline characteristics of the sample, individuals who ever used augmentation therapy (≥ 1 facility/pharmacy/home claim for augmentation infusion) were compared to never users. For the cost comparisons, individuals were considered to be non-users until their first claim for augmentation therapy, and were considered to be augmentation users thereafter. Therefore, the non-user cohort comprised a mix of never users and not-yet users (eventual users prior to their first augmentation claim).
Costs were compared between augmentation users and non-users using nonparametric Wilcoxon rank sum tests. All costs are presented annually, and were weighted based on patients’ period of insurance coverage and were adjusted to 2017 U.S. dollars using the medical care component of the consumer price index.16 Data were analyzed using STATA 14/MP (StataCorp, Texas). Institutional review board approval was obtained from the Institutional Review Board of the University of Maryland in Baltimore on July 27, 2016 (HP-00068329).
Results
Population Characteristics
The study cohort consisted of 9117 AATD patients (identified among over 21 million enrollees) and followed for 53,872 person years observed between January 1, 1993 and December 31, 2015. Figure 1 presents the number of person years of claims data on AATD patients in the database over time. For the entire cohort, the mean duration of follow-up was 5.91 years. Among augmentation therapy users and never users, the average follow-up was 5.00 and 6.04 years, respectively. Not-yet users were followed on average for 2.00 years before the initiation of augmentation therapy and 3.00 years after augmentation therapy was started (users).
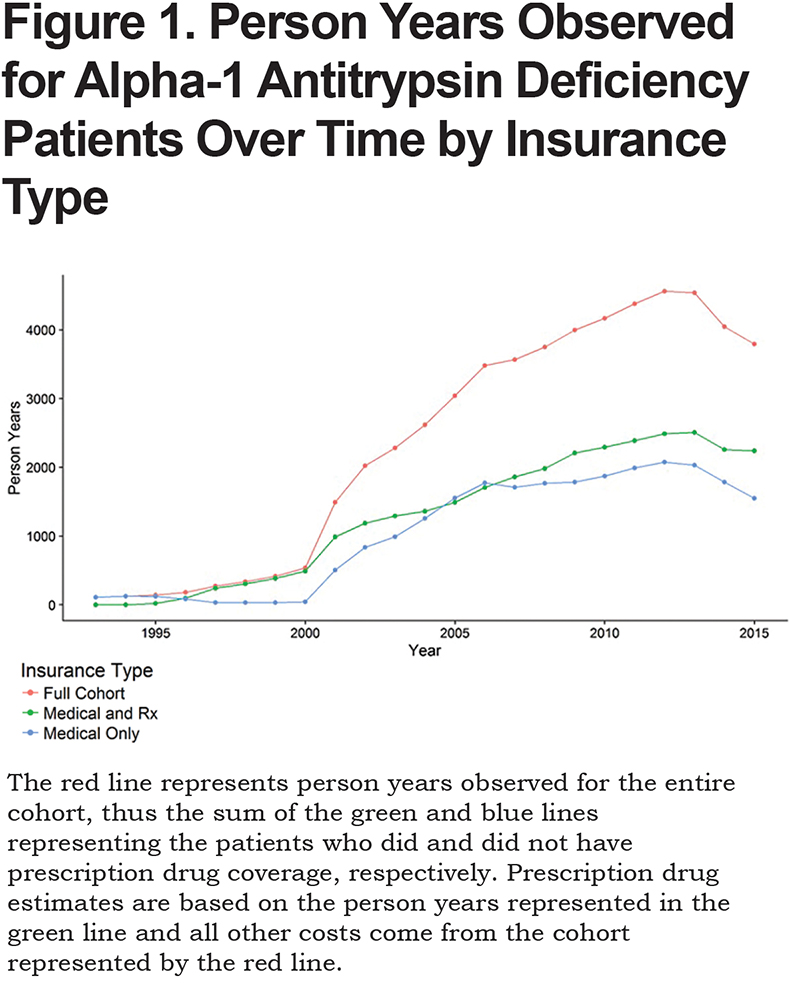
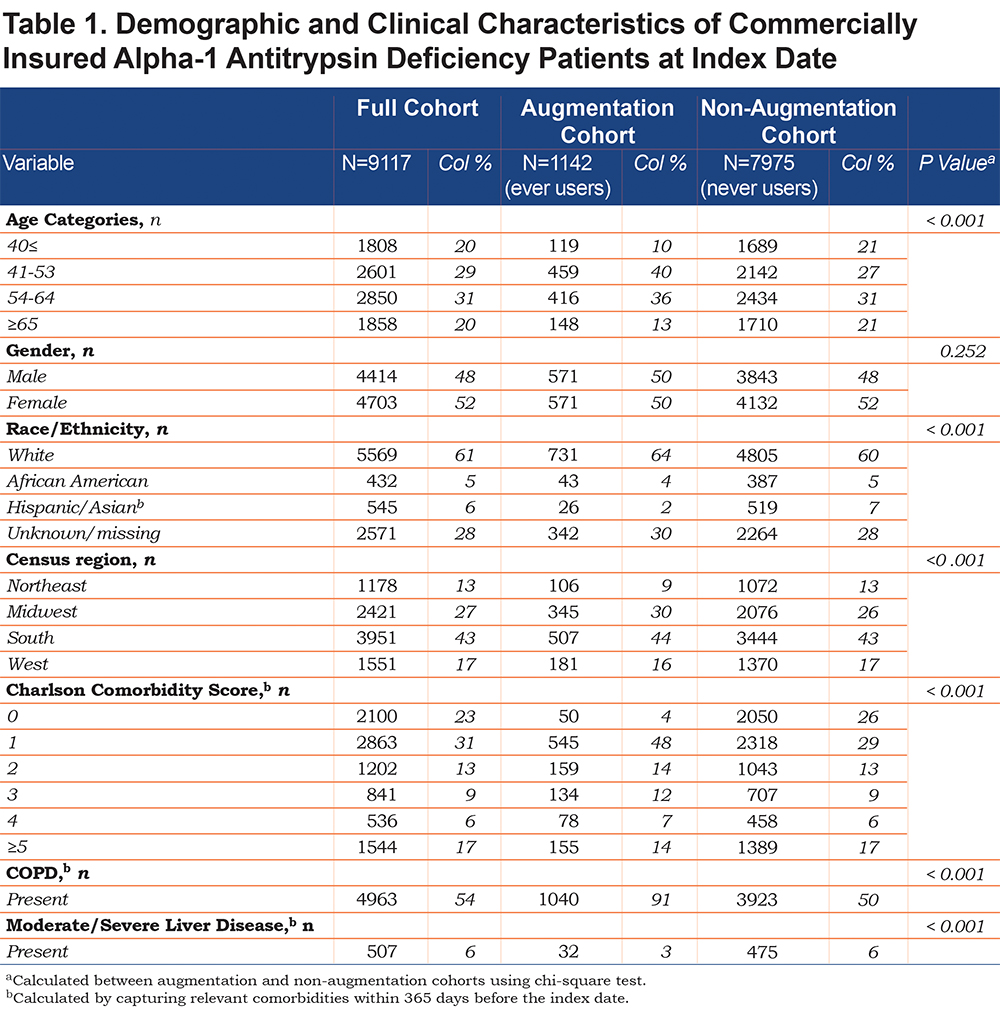
Table 1 lists the demographic and clinical characteristics of the cohort at index date. Of note, only 1142 AATD patients (12.5%) ever used augmentation therapy during the observation period. Compared to never users, patients who ever received augmentation infusions were statistically different in terms of distribution across age and Deyo-Charlson Comorbidity Score categories, race/ethnicity and census regions (p < 0.001). A higher proportion of augmentation therapy users had COPD as compared to never users.
Aim 1: Costs to Insurer and Patient
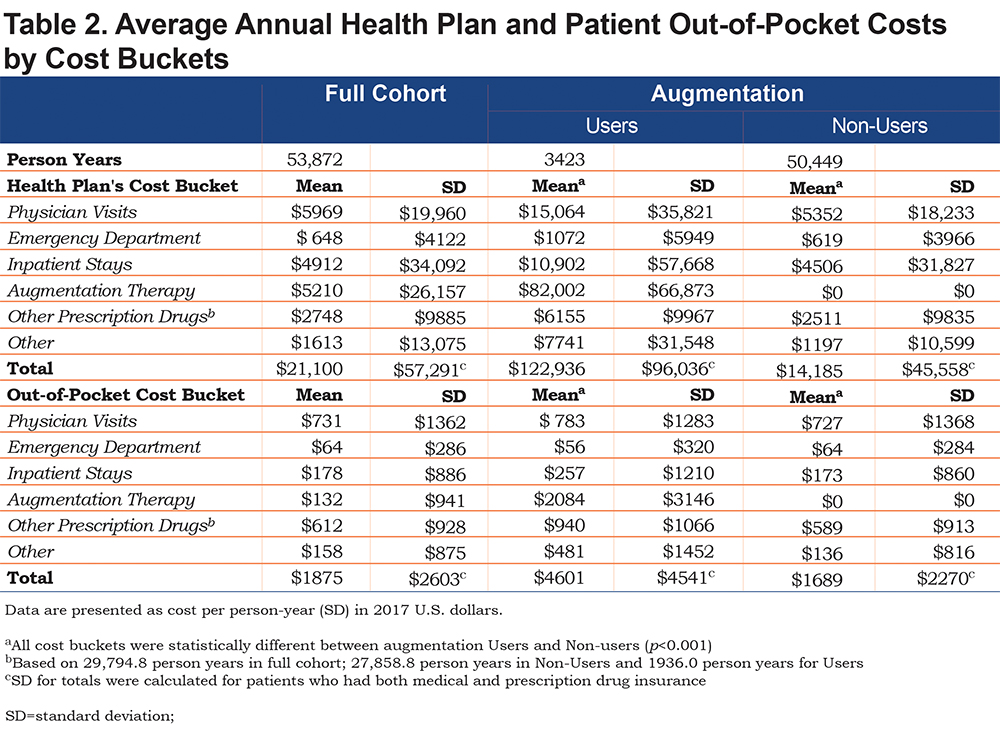
Table 2 summarizes the mean direct medical costs per person year. All cost buckets were statistically different between augmentation therapy users and non-users (all p <0.001). Within the full cohort, the main cost drivers for the insurer were PV, AUG, and IP, with relatively large variations as depicted in standard deviations (Table 2). Averaged across the entire cohort, the annual direct medical cost per person year totaled $22,975. However, the annual costs of patients with AATD differed drastically depending on augmentation therapy use status and amounted to $127,537 among users and $15,874 among non-users (p < 0.001).
Insurers’ annual expenditures did not differ substantially between never users and not-yet users (users prior to their initiation of augmentation therapy); these totaled $14,128 versus $15,357, respectively. Patients’ out-of-pocket costs were higher for never users as compared to not-yet users: $1693 versus $1592, respectively. When comparing costs among not-yet users with users after excluding augmentation therapy cost, augmentation users incurred an additional $26,502 ($43,451 versus $16,949, respectively) in average total annual costs.
The proportion of the direct medical cost per person year (and the proportion of the total cost) paid by the insurer for augmentation non-users was: PV: 37.7%; ED: 4.4%; IP stays: 31.8%; RX: 17.7%; OTH: 8.4%. For the 1142 patients who began augmentation therapy, these costs were: PV: 12.3%; ED: 0.9%; IP: 8.9%; AUG: 66.7%; RX: 5.0%; OTH: 6.3%. Direct medical costs per person year paid by the insurer for augmentation users were higher than non-users in all buckets.
The annual out-of-pocket costs for AATD patients are summarized in the lower panel of Table 2. Statistical differences were observed between augmentation therapy users and non-users for every cost bucket (p < 0.001). Within the full cohort, the main cost drivers of out-of-pocket expenditures were PV and RX, followed by IP. Out-of-pocket costs (and proportion of total cost) per person year paid by the AATD patients not on augmentation therapy were: PV: $727 (43%); ED: $64 (3.8%); IP stays: $173 (10.2%); RX: $589 (35%); OTH: $136 (8%). Among the 1142 users of augmentation therapy, these costs were: PV: $783 (17%); ED: $56 (1.2%); IP: $257 (5.6%); AUG: $2084 (45.3%); RX: $940 (20.4%); OTH: $481 (10.45%). The mean annual out-of-pocket cost for AATD patients was equal to $1875. The difference in annual out-of-pocket costs was $4601 versus $1689 among augmentation therapy users and non-users, respectively. Never users and not-yet users until their first augmentation therapy claim are not substantially different from the insurer or patient’s cost standpoints. The never users incurred an annual cost of $11,638, and not-yet users incurred $10,410 from the insurers’ perspective. From a patient’s perspective, never users totaled $1108 and not-yet users amounted to $910 annually (disaggregated data not shown).
The annual costs among AATD patients with prescription drug coverage are only slightly higher as compared to patients without prescription drug coverage (data not shown). Thus, Table 2 presents totals for all buckets with the caveat that RX costs were only available for a subset of patients.
Aim 2: Changes in Costs Over Time
The overall average costs of care by bucket over time are presented in Figure 2. Generally, buckets increase over time at fairly consistent rates; however, in the last 10 years inpatient and physician visits stayed relatively flat while augmentation therapy and drug costs have continued to increase to the insurer and to a lesser extent to patients.
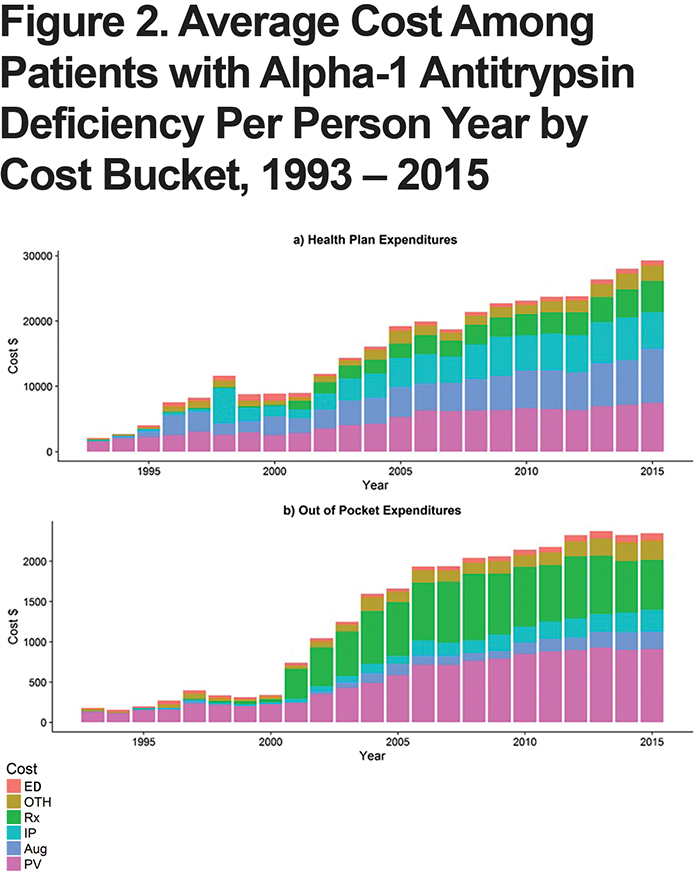
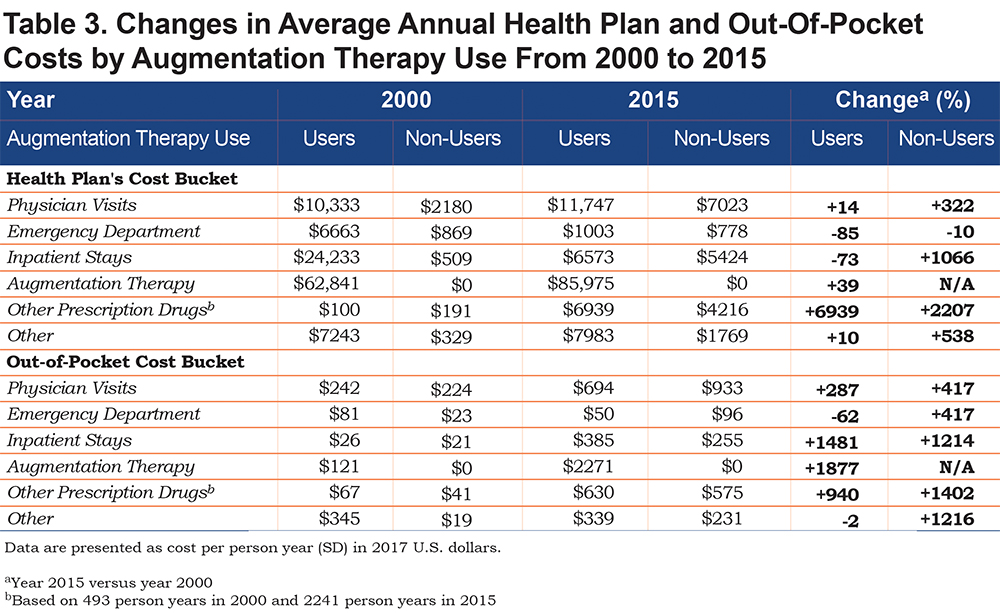
Changes in average insurer and patient expenditures, among augmentation therapy users, over time are presented with corresponding observed person years in Figures 1 and 2. The years used for comparison show the newest year of data (2015) as well as the year preceding a substantial increase in the number of diagnosed patients (2000).
From the insurers’ perspective, increases in annual expenditures, among augmentation therapy users, were noted for all cost buckets except for ED visits and IP stays which actually decreased in cost between 2000 and 2015 (Table 3). The largest increase in expenditures was observed for prescription drugs. Among AATD patients not on augmentation therapy, insurers’ expenditures increased for all cost buckets except for ED visits.
Discussion
The goal of this study was to estimate medical costs of AATD to both payers and patients. Overall, the analysis showed that the annual direct medical costs for AATD patients were $22,975 with an average of $21,100 to insurers and $1875 to patients. This study is the first to utilize a large claims database and the data represents the first U.S.-based longitudinal estimates of costs among patients with AATD. To the authors’ knowledge, this AATD medical costs analysis reflects the largest ever reported cohort of AATD patients (9117).
A summary of preceding cost reports related to AATD and AATD-associated diseases are presented in Table 4. The first cost estimates published in the United States included total health care costs, including RX, AUG and out-of-pocket expenditures.17 As noted by the authors, previously reported costs were likely underestimated due to unavailability of cost information on other cost buckets (e.g., physician visits). After adjusting for inflation, RX and AUG costs among augmentation users reported in 2001 were lower as compared to findings reported in our study. The second U.S. analysis was a follow-up to the first study and included formerly missing information on several cost buckets.14 After adjusting for inflation, the total health care costs for augmentation users in 2003 were also lower, while the prescription drug costs were slightly higher for augmentation users in light of findings reported in this analysis.
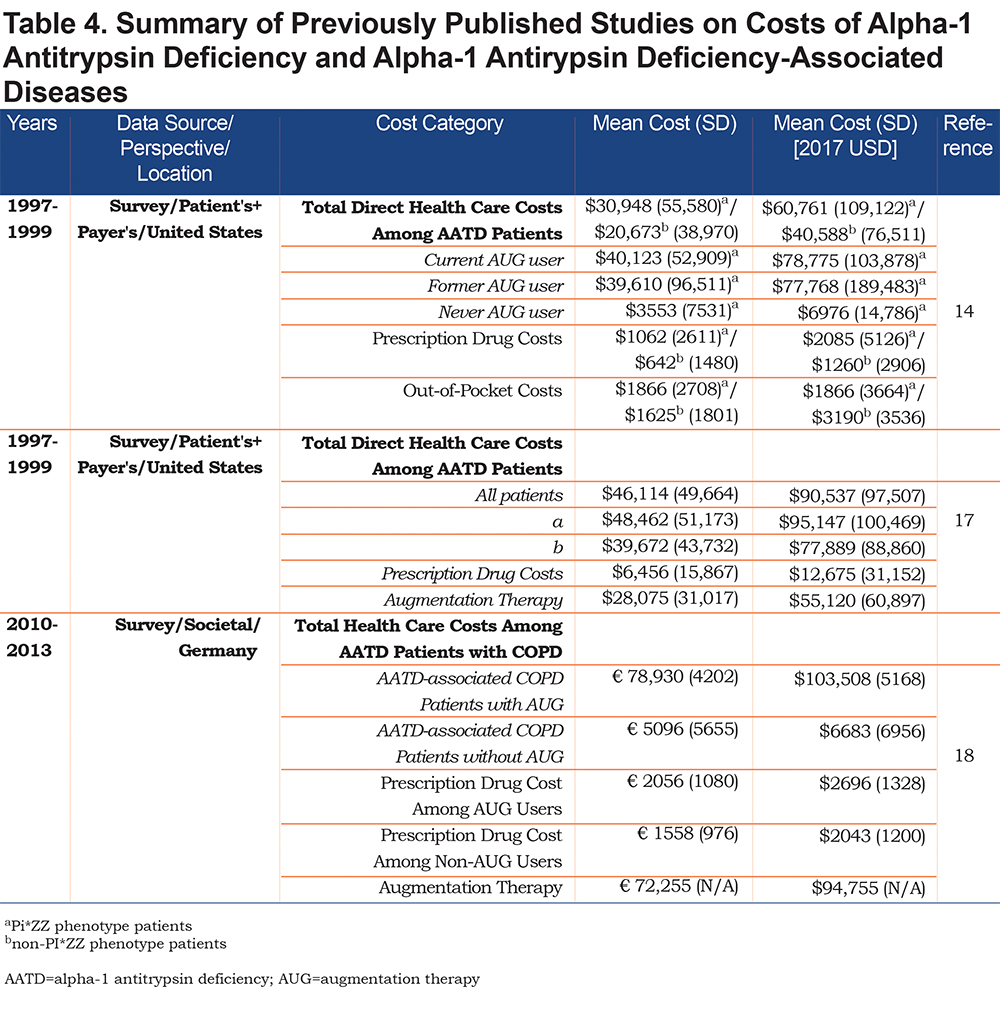
A recent European study provides some cost estimates for comparison. The annual costs of augmentation therapies in the United States were lower than in Europe ($82,002 versus $94,755; Tables 2 and 4).18 However, European AATD patients receiving augmentation therapy incurred lower annual direct medical costs ($103,508) as compared to American patients receiving augmentation therapy ($122,936). The health care expenditures among augmentation non-users also were lower in Germany (the mean direct annual costs in the cohort not receiving augmentation therapy were €6099, equal to $7337 in 2017 U.S. dollars18). These differences can be at least partially explained by differences in financing mechanisms between the German and American health care systems,19,20 variations in the length of follow-up observed in each study, and distinct cohort definitions (AATD-associated COPD cohort in German study versus overall economic burden of AATD irrespective of AATD-associated comorbidities in this report).
The rationale regarding cost comparisons at 2 points in time is as follows: before a substantial increase in the number of diagnosed patients (2001), the authors believe that only very severe cases were diagnosed with AATD in the 1990s and early 2000s. Over time, along with increasing recognition, less severe cases were identified and disease management programs in the United States became available, resulting in decreased hospitalizations due to better management of mild/moderate exacerbations of COPD, possibly accounting for observed cost reductions.
This cohort sheds light on the use of augmentation therapy among a large group of patients in whom AATD has been diagnosed. Not surprisingly, Table 1 shows that the vast majority (91%) of augmentation users had a diagnosis of COPD. The 9% of augmentation users who did not have a COPD diagnosis likely reflects the use of augmentation therapy for other health conditions associated with AATD (e.g., bronchiectasis, panniculitis), use of augmentation therapy in a manner inconsistent with guidelines, and possible issues with misdiagnosis or misclassification in this dataset. Among the individuals in this cohort who did not use augmentation, 50% had a diagnosis of COPD. This finding may reflect the application of older prescribing guidelines for augmentation therapy (i.e., guidelines prior to 2015 recommended the use of augmentation therapy for only a subset of cases of AATD-associated COPD), and also likely, it is indicative of limited utilization of augmentation therapy due to patient preference, cost, and other barriers to the use of this treatment regimen.
The fact that only 12.5% of our cohort used augmentation therapy during the study period may be explained in part by the fact that follow-up averages only 5.91 years per patient and is shorter for augmentation users than never users (mean follow-up of 5.00 versus 6.04 years). Another cross-validation of our results stems from a utilization study among a cohort of Medicare AATD patients with COPD, in which it was found that only 13% of AATD patients were using augmentation therapy.21
This cost analysis revealed that never users and not-yet users until their first augmentation therapy claim are not substantially different from the insurer or patient costs standpoint. However, some AATD patients identified in this study might have been diagnosed based on their family history of the disease, while they were actually symptom-free. This is more likely to be the case for individuals who did not receive augmentation therapy.
A major limitation of this study is the lack of data regarding smoking status and phenotype information. While this analysis did not focus on AATD-associated COPD, the severity of COPD, forced expiratory volume in 1 second scores, Tiffeneau index or patient’s weight were not accounted for due to unavailability of these data. Another limitation relates to generalizability. Only commercially insured patients of one large health plan were included in this analysis, hence AATD patients receiving health care services through public or other payers are not represented.
The distribution of patient characteristics (e.g., census region) may mirror differences in coverage by the insurer, not true differences in geographical distribution of AATD patients nor augmentation therapy use across the United States. While cost reductions were observed for ED visits and IP stays among augmentation users over time, the design of this study does not allow for sound conclusions regarding the effects of augmentation therapy on inpatient stays and other health expenditures. The impact of augmentation therapy on health outcomes and costs were analyzed in 3 cost-effectiveness studies comparing augmentation therapy use with conventional health interventions.22-24
The estimates obtained in this study can be utilized by various stakeholders: patient advocacy groups, insurers, pharmaceutical manufacturers and researchers. First, the results can be used by patient advocacy groups to further their goals of increased recognition of AATD and affordable treatments. Second, insurers can utilize cost data for budget impact projections to assure appropriate allocation of resources for AATD patients. Third, pharmaceutical manufacturers and researchers should gain insight into the current costs of the disease and look for new methods of alpha-1 antitrypsin protein production and delivery to lower costs associated with the use of augmentation therapy.
The purpose of this analysis was to present descriptive, real-world differences between augmentation and non-augmentation users without imposing any assumptions about the patient’s health status or cost of comorbid conditions management. Because costs of patients with AATD might be related to management of associated comorbid conditions, the authors did not intend to control for differences in comorbid status clinically associated with AATD with the use of multivariate analyses. Additionally, this analysis does not aim to show a causal relationship between AATD and annual costs. Instead, it presents real-world differences between use of augmentation therapy (or lack of thereof) and costs among AATD patients irrespective of AATD-associated conditions to payers and decision-makers on an aggregate level.
The results of this study highlight the feasibility of rare disease research using claims databases and are intended to fuel active discussions in the rare disease policy arena. Further contributions to an increasing awareness of AATD among physicians are warranted; even today, AATD remains an under-recognized and under-diagnosed disorder.5,25 Future studies should evaluate both cost-effectiveness and affordability of AATD treatments and delineate cost differences between AATD-associated COPD and non-AATD-associated COPD using claims for large AATD patient samples in the United States, to contrast with survey studies based on small cohorts conducted in Europe.18
Conclusions
Annual medical costs of patients with AATD are $127,537 and $15,874 among augmentation therapy users and non-users, respectively. Based on past expenditures showing increases in direct medical costs of care among AATD-affected individuals and their insurers, future increases in their health care spending may be expected.
Further studies are needed to assess the impact of augmentation therapy on health outcomes and costs to both patients and insurers. This will require study designs that utilize cohorts derived from real-world sources such as insurers’ databases to enhance data from clinical trials, which typically have much smaller numbers of patients.
Acknowledgments
None.
Declaration of Interest
Jan Sieluk: Research funding from Bayer HealthCare (recipient: University of Maryland, Baltimore), research funding from AlphaNet (recipient: University of Maryland, Baltimore), research funding from Alpha-1 Foundation (recipient: University of Maryland, Baltimore); Joseph Levy receives postdoctoral fellowship support from Merck & Co., Inc.; Robert Sandhaus: Medical Director of AlphaNet; medical advisor to Grifols, CSL Behring, Shire, Octapharma, Inhibrx, AstraZeneca; grants from the National Institutes of Health, CSL Behring, Grifols, Matrx; Henry Silverman: nothing to declare; Kristen Holm:consulting income from AlphaNet; C. Daniel Mullins: Research funding from Amgen, Bayer, Merck, Novartis, Pfizer (recipient: University of Maryland, Baltimore), consulting income from Amgen, Bayer, Janssen/Johnson & Johnson, MundiPharma, Novartis, Pfizer, Regeneron/Sanofi-Aventis.