Running Head: GOLD ABCD 2011 vs 2017: Mortality and Exacerbations
Funding Support: COPDGene® is supported by funding from the National Heart, Lung, and Blood Institute (R01 HL089897 and R01 HL089856, HL138188). COPDGene® is also supported by the COPD Foundation through contributions made to an Industry Advisory Board comprised of AstraZeneca, Boehringer-Ingelheim, Novartis, Pfizer, GlaxoSmithKline, Siemens and Sunovion.
Date of acceptance: August 24, 2018
Abbreviations: Global Initiative for Chronic Obstructive Lung Disease, GOLD; forced expiratory volume in 1 second, FEV1; Genetic Epidemiology of COPD Study, COPDGene®; standard deviation, SD; hazard ratio, HR; confidence interval, CI; area under the curve, AUC; chronic obstructive pulmonary disease, COPD; modified Medical Research Council dyspnea scale, mMRC; COPD Assessment Test, CAT; St George’s Respiratory Questionnaire, SGRQ; social security death index, SSDI; COPDGene® Longitudinal Follow-up Program, LFU; receiver operating curve, ROC; 6-minute walking distance, 6MWD
Citation: Criner RN, Labaki WW, Regan EA, et al; for the COPDGene Investigators. Mortality and exacerbations by Global Initiative for Chronic Obstructive Lung Disease Groups ABCD: 2011 versus 2017 in the COPDGene® Cohort. Chronic Obstr Pulm Dis. 2019; 6(1): 64-73. doi: http://doi.org/10.15326/jcopdf.6.1.2018.0130
Online Supplemental Material: Read Online Supplemental Material (378KB)
Introduction
The Global initiative for chronic Obstructive Lung Disease (GOLD) grading system for chronic obstructive pulmonary disease (COPD) has evolved greatly over the past 20 years. Initially, only forced expiratory volume in 1 second (FEV1) was used to classify COPD severity.1 This decision was later criticized because FEV1 is an imperfect measure of the individual disease experience, which is better captured using additional measures such as dyspnea and walking distance.2-4 In 2011, the GOLD committee proposed a classification system of groups ABCD, based in a 2-step process that uses the worst value of 1of 2 predictors of risk (FEV1 or exacerbation history), combined with a measure of the burden of symptoms (based in the modified Medical Research Council dyspnea [mMRC] or the COPD Assessment Test [CAT] scores).5,6
The ABCD system was considered as an improvement, which acknowledged that COPD is a multidimensional disease with different factors determining disease impact and brought an opportunity to provide more individualized care to COPD patients.7 However, the 2011 ABCD system lacked superiority to the earlier simple spirometry criteria in predicting mortality and there was confusion regarding group D as it was defined by both lung function and exacerbation history.6,8-11 Therefore, in the most recent iteration of the GOLD consensus statement released in 2017,2,3,6,8-10 spirometry-determined airflow limitation was separated from clinical parameters. Currently, the ABCD classification is based on measures of symptoms (on the horizontal axis) and risk (on the vertical axis), which is determined only by exacerbation history.6
The 2017 ABCD system is an assessment tool, designed to aid clinicians in creating optimal treatment regimens for their patients based on disease characteristics, and not intended for prognostication.6 Nonetheless, it is important to analyze the impact of the 2017 ABCD system in comparison to the 2011 ABCD system, in regards to association with exacerbation and mortality, as they guide management for millions of COPD patients worldwide.
Using cross-sectional and longitudinal data from the Genetic Epidemiology of COPD Study (COPDGene®) cohort, we examined whether there are differences in mortality and exacerbation prediction between the 2011 ABCD group (defined using the worst descriptor of risk, either spirometry or exacerbation history, with mMRC as descriptor of symptoms) and the new 2017 ABCD group (exacerbation history and symptoms). Specifically, we investigated if, using GOLD 2017 criteria relative to GOLD 2011 criteria: (1) the distribution of individuals between groups ABCD are altered; (2) the mortality and exacerbation risk differ between groups ABCD; and (3) the discrimination ability to predict mortality between groups ABCD are changed.
Methods
Study Design and Participants
This is a longitudinal analysis of individuals with COPD enrolled in the COPDGene® cohort (Clinicaltrials.gov identifier NCT00608764), which comprises 21 academic clinical centers within the United States. In its initial phase, COPDGene® enrolled over 10,000 ever-smokers at risk for and with COPD. Individuals were required to be between 45-80 years of age with a ≥10 pack-years smoking history and free of exacerbations in the 4 weeks before enrollment. Additional inclusion and exclusion criteria have been published.12
For the current analyses, we included the 4469 COPDGene® participants fulfilling the fixed-ratio spirometry definition of COPD as a post-bronchodilator FEV1/FVC < 0.7. All participants provided informed consent, and institutional review board (IRB) approval was obtained in all participating centers. Using self-administered, validated questionnaires, COPDGene® investigators collected data on demographics, biometrics, medical history, and medications. Participants also answered the modified American Thoracic Society Respiratory Epidemiology Questionnaire13 to identify exacerbation frequency, the St George’s Respiratory Questionnaire (SGRQ)14 for obstructive disease-specific quality of life measurement, and the mMRC scale for dyspnea assessment.
Exposure
We applied GOLD 2011 and GOLD 2017 criteria to all enrolled individuals on whom vital status was available as of October 2016 (median follow-up time 6.8, interquartile range 6.0, 7.7 years); based on data collected at Visit 1, we classified their GOLD stage and severity based on ABCD groups.7 Symptoms were first assessed using the mMRC dyspnea scale. Individuals scoring mMRC 0-1 were low symptom burden. To determine the risk descriptor in the 2011 grouping system, we used spirometry (with low risk defined as GOLD spirometry stages 1-2 [FEV1 > 50% predicted]) and exacerbation history (low risk 0-1 outpatient exacerbations and no inpatient treated exacerbations; high risk 2 or more outpatient-treated exacerbations or 1 or more exacerbations leading to a hospital admission). A combination of a descriptor of symptom burden (mMRC) and risk (the worst risk descriptor, either spirometry or exacerbation history) were used to create groups ABCD, resulting in group A as low risk/low symptoms, group B low risk/high symptoms, Group C high risk/low symptoms, and group D high risk/high symptoms.
The GOLD 2017 criteria did not use spirometry to guide ABCD grouping; instead burden of symptoms (similar mMRC criteria) and exacerbation history alone were used as descriptors of risk (low risk 0-1 outpatient exacerbations and no inpatient treated exacerbations; high risk 2 or more outpatient-treated exacerbations or 1 or more exacerbations leading to a hospital admission).6 The combination of mMRC and exacerbations was used to create the 2017 ABCD groups.
Outcomes
Our outcomes were all-cause mortality and longitudinal, patient-reported exacerbations. Information on exacerbations was obtained using a previously described automated telecommunication system, with longitudinal follow-up data on exacerbations available up to October of 2013 (median follow-up 3.7, interquartile range 2.8, 4.8 years).15 Briefly, all participants agreed to be contacted by email or telephone on a regular basis and to provide information about development of new exacerbations in the interval since the initial visit. Participants were followed longitudinally via either an automated telephone or web-based system on an every 6-month basis. Individuals not reached through the automated system were contacted by a research coordinator for a phone-based interview. Exacerbations were defined as any episode of increased cough, sputum production, or shortness of breath lasting >48 hours and requiring treatment with antibiotics, systemic steroids, or both; exacerbations requiring hospital admission or emergency department visits were considered severe.
We confirmed participant vital status using multiple sources; information from the social security death index (SSDI), next-of-kin interviews, clinical records, and the COPDGene® Longitudinal Follow-up (LFU) Program were utilized. The mortality dataset was created in December 2016. Care was taken to avoid ascertainment bias, which can occur when deaths are reported more consistently than alive status. Due to individual center IRB restrictions, only 8675 individuals had vital status searched by SSDI. Deaths and vital status for those who were searched via SSDI were back censored 3 months from the search date to account for expected lag time between a death and its appearance in the SSDI dataset. The centralized SSDI search was performed on October 14, 2016. For a subset of 333 individuals participating in the LFU program and for whom SSDI search could not be performed, but had a survey completed in the 7 months prior, ensuring that they were being actively followed, they were back censored 6 months prior to dataset generation date (June 18, 2016). For those in the LFU program who expired prior to the 6-month censor date, follow-up time terminating in death was included in the dataset if an LFU contact in the prior 7 months indicated that the individual was being “actively followed” at the time of death.
Statistical Analysis
Descriptive statistics used means and standard deviation, or proportions, according to the variable of interest. Bivariate associations between each ABCD grouping system and mortality and annualized exacerbation frequency were performed. Agreement of assignment of individuals to ABCD classification groups between the GOLD 2011 and GOLD 2017 systems was examined using the kappa statistic. We assessed differences in all-cause mortality across groups A to D in each classification using Kaplan-Meier analysis. Using Cox proportional hazard models, we also analyzed the association between each group in the GOLD 2011 and 2017 systems with mortality. Cox models were adjusted for demographics (age, sex, race), cardiovascular comorbidities (a combination of myocardial infarction, angina, congestive heart failure), cardiovascular risk factors (diabetes, obesity, hypertension, hyperlipidemia), musculoskeletal disease (combination of osteoarthritis and osteoporosis) and asthma. We tested associations of ABCD groups with exacerbations using both zero-inflated Poisson regression models, equally adjusted. The discrimination ability of the 2011 (mMRC and spirometry) and 2017 (mMRC and exacerbation history) systems were tested by a comparison of the area under the receiver operating curves (ROC) for mortality during follow-up and any exacerbation during follow-up.
We also performed 2 additional sensitivity analyses. First, because the GOLD consensus statement allows for symptom burden with CAT, in addition to mMRC, we looked for an alternative measure of symptoms. Because COPDGene® did not collect information on CAT during the first visit, we tested a modified ABCD grouping alternative, combining SGRQ (cut-point of 25 based on previous data showing that this value is comparable to a CAT score of 10)16,17 as measure of risk, with spirometry (2011) or exacerbations (2017) and replicated all analyses with these 2 grouping systems. Second, we examined whether the associations were maintained when the outcome was severe (hospital or emergency department treated) exacerbations, using the 2011 and 2017 ABCD groups. All analyses were performed using the statistical package STATA v.12 (Stata Corp. College Station, Texas), and a p value <0.05 was considered statistically significant.
Results
Description of Participants
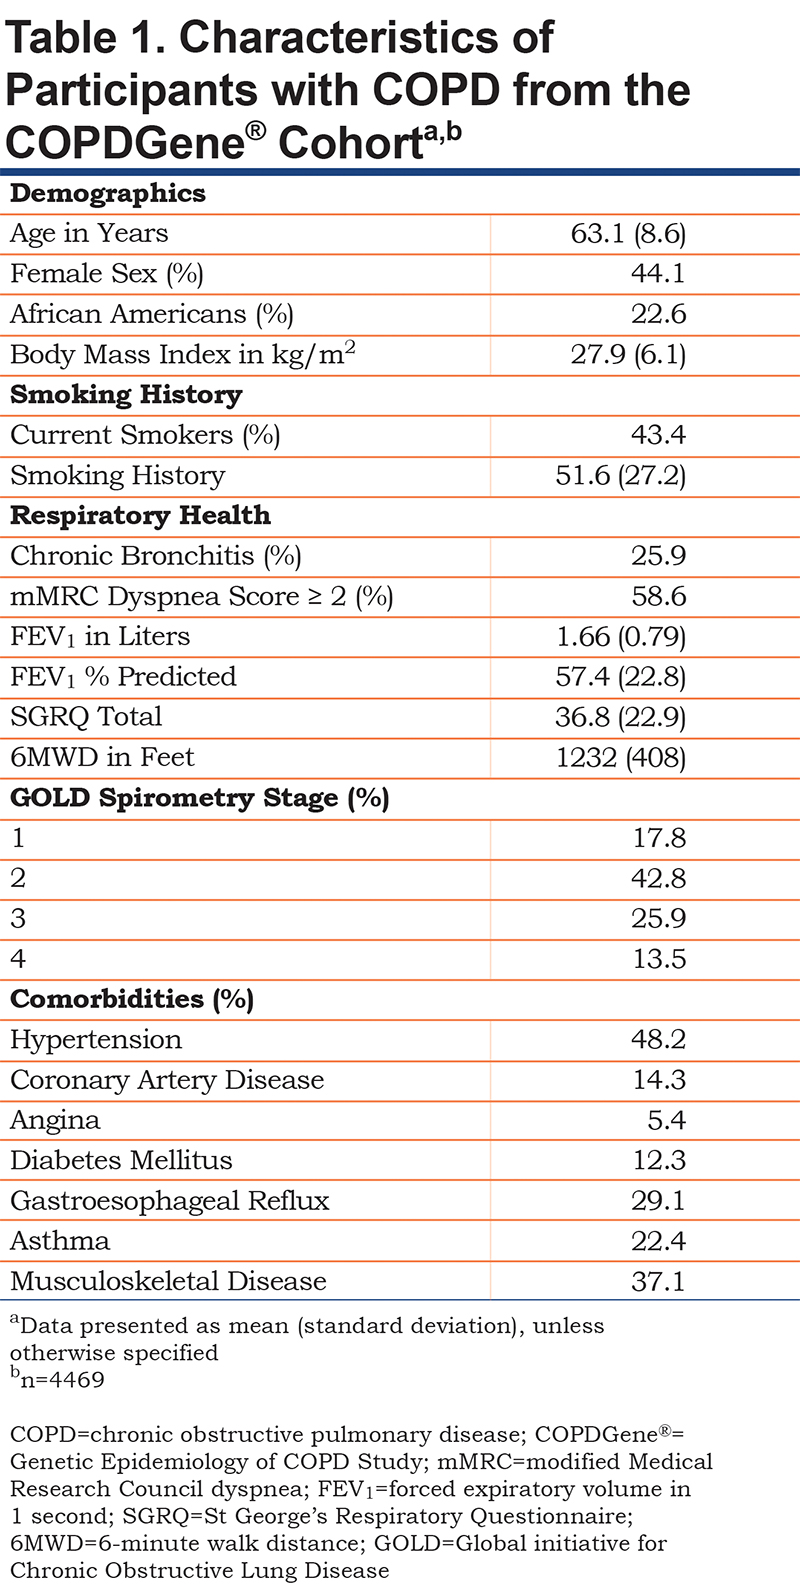
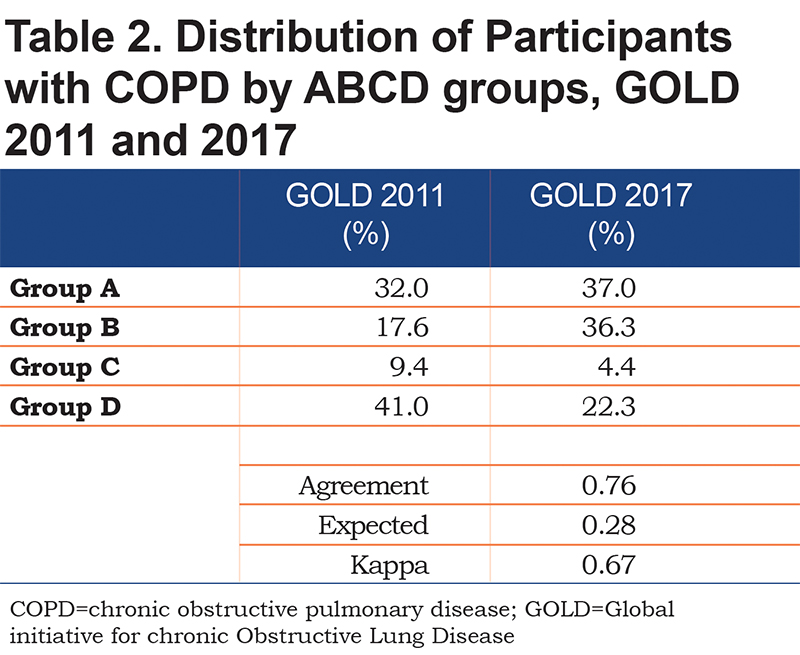
We included 4469 COPDGene® enrollees who fulfilled the fixed ratio definition of COPD, GOLD stages 1-4. Individuals were middle-aged (mean 63.1 years) with sizeable fractions of women (44%) and African-Americans (22.6%) (Table 1). The group had a significant burden of common comorbidities, included hypertension (48.2%), musculoskeletal disease (37.1%), gastroesophageal reflux disease (29.1%), and asthma (22.4%). The distribution of individuals based on the 2011 versus 2017 systems showed fair agreement (kappa score 0.67, p<0.001). Relative to the 2011 system, the 2017 classification scheme resulted in increased percentages of individuals categorized as groups A and B and a decrease in groups C and D (Table 2).
Mortality by GOLD ABCD Groups
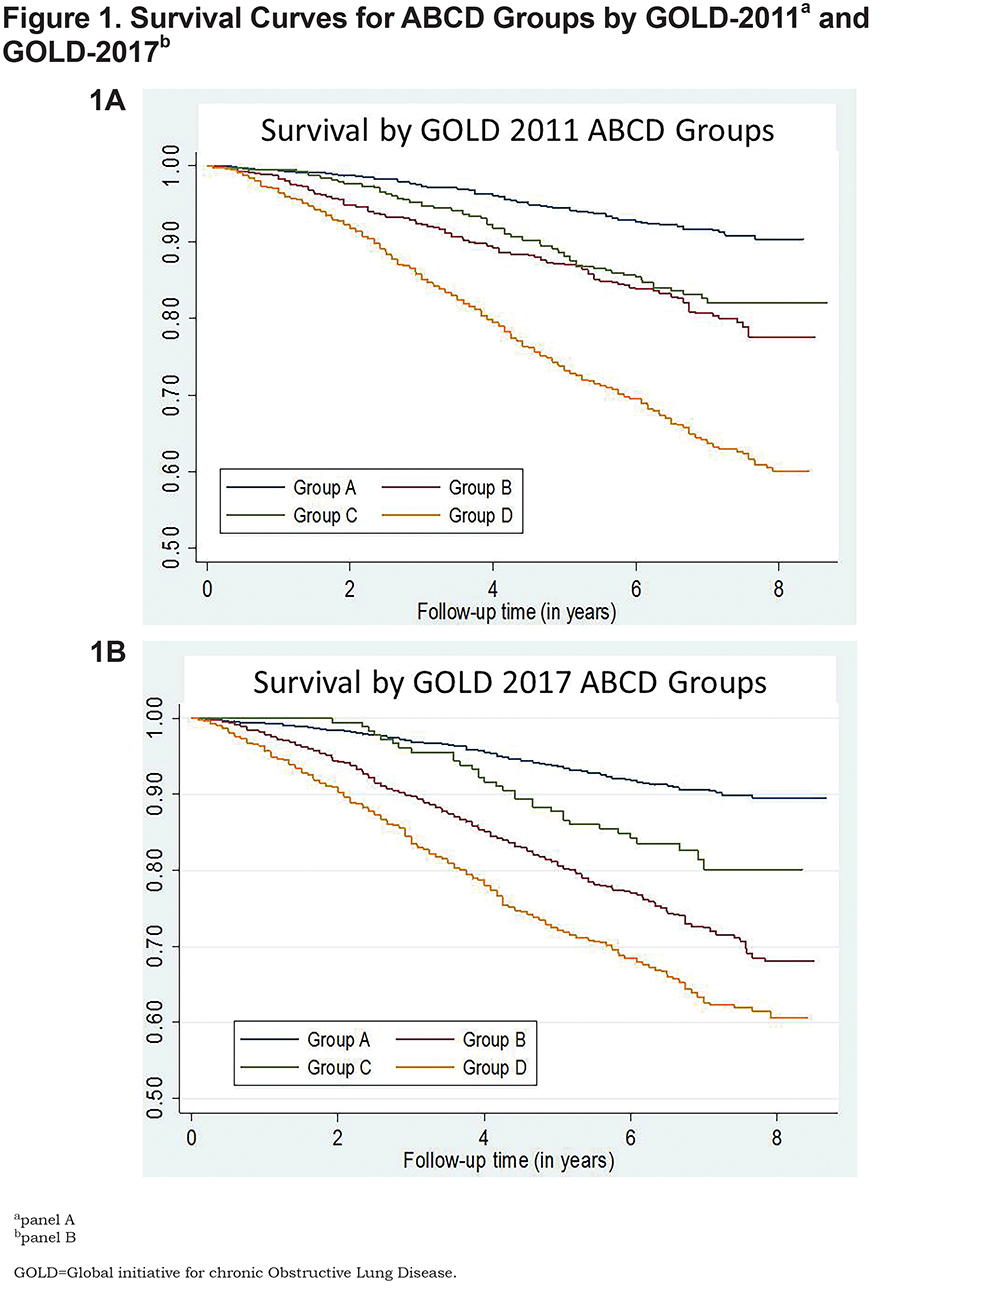
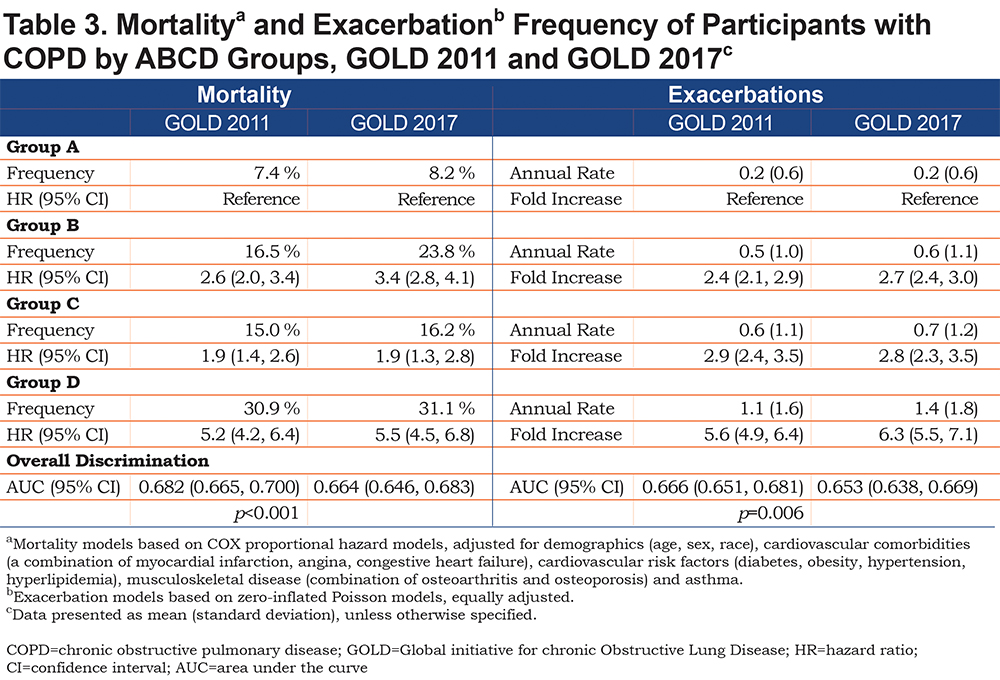
As anticipated, Kaplan-Meier analysis showed greatest all-cause mortality over the study period in group D individuals, whether classified by 2011 GOLD criteria (Fig. 1A) or 2017 GOLD criteria (Fig. 1B); 8-year survival in this group was <60%. Eight-year survival (roughly 80%) did not differ between groups B and C in the 2011 classification; in contrast, unadjusted survival using the 2017 system was greater for group C than group B (Fig. 1). Nevertheless, adjusted Cox proportional models (using group A as reference) demonstrated that the risk of death using either system was lowest for group C individuals, intermediate for group B, and greatest for group D (Table 3). Although a small difference, GOLD 2011 exhibited significantly better discrimination in predicting mortality, as defined by area under the curve (AUC) for receiver-operator analysis, than the 2017 classification (AUC 0.68 [95% CI 0.67, 0.70] versus 0.66 [0.65, 0.68], p<0.001 for the comparison) (Table 3).
All Exacerbations by GOLD ABCD Groups
Similarly, the unadjusted exacerbation frequency was greatest in group D by either GOLD classification scheme (GOLD 2011, 1.1 ± 1.6 exacerbations/year [mean ± SD]; GOLD 2017, 1.4 ± 1.8). In adjusted models with group A as a reference, group D had a markedly elevated fold-increase in exacerbations (GOLD 2011, hazard ratio (HR) 5.6 [95% confidence interval (CI) 4.9, 6.4]; GOLD 2017, 6.3 [5.5, 7.1]). Despite the changes in ABCD groupings seen in Table 2, there were no significant differences in exacerbation rates between groups B and C as assigned by the 2011 versus 2017 classification schemes (Table 3), although both were significantly elevated relative to group A in their respective schemes (B-2011, fold-increase HR 2.4 [95% CI 2.1, 2.9] versus B-2017, 2.7 [2.4, 3.0]; C-2011, 2.9 [2.4, 3.5] versus C-2017, 2.8 [2.3, 3.5]). Only a small difference between GOLD classifications was seen for prediction of all exacerbations (GOLD 2011, AUC 0.67 versus GOLD 2017, AUC 0.65, p = 0.006 for the comparison) (Table 3).
Analyses of Severe Exacerbations
When defined by GOLD 2017, the annual rate of severe exacerbations also increased progressively from groups A through D (Online data supplement Table 1). By contrast, for GOLD 2011 (using group A as reference), although group D had the highest annual exacerbation rate (1.1 ± 2.2), group B had a similar rate to group C (0.4 ± 1.1 versus 0.4 ± 1.4). There was no significant difference between the 2011 and 2017 systems when predicting severe exacerbation frequency (AUC 0.69 versus 0.69, p = 0.88 for the comparison) (Online data supplement Table 1).
Analyses Using SGRQ as Measure of Symptoms
Finally, we substituted SGRQ for mMRC as a measure of respiratory symptoms and assessed the effect on mortality rates. Relative to the 2011 classification, this modification also increased the frequency of individuals categorized as being in groups A and B, had a negligible effect on group C, and decreased those in group D (GOLD 2011, 44.7% versus GOLD 2017, 24.5%) (Online data supplement Table 2). The agreement between schemes was again fair (kappa 0.66).
Results of this modification were similar to those using mMRC as measure of symptoms (Online data supplement Table 3). Unadjusted mortality according to the 2011 scheme was greatest in group D (29.8%) and indistinguishable in groups B and C (15.6% versus 13.3%), whereas in the 2017 scheme, it was again greater in group B than group C (22.5% versus 14.1%). However, in this case, adjusted Cox proportional models (using group A as reference) demonstrated that for both GOLD classification schemes, mortality risk was greater in group B (GOLD 2011, HR 2.6 [95% CI 2.0, 3.3]; GOLD 2017, 3.4 [2.7, 4.1]) than in group C (GOLD 2011, HR 1.8 [95% CI 1.2, 2.6]; GOLD 2017, 1.8 [1.0, 3.1]) (Online data supplement Table 3).
Importantly, even for this alternative definition of respiratory symptoms, GOLD 2011 again showed stronger mortality discrimination by ROC analysis than GOLD 2017 (GOLD 2011, AUC 0.68 versus GOLD 2017, AUC 0.66, p<0.001 for the comparison) (Online data supplement Table 3). Once again, prediction of all exacerbation differences between classification schemes was minimal (GOLD 2011, AUC 0.66 versus GOLD 2017, AUC 0.66, p = 0.05).
Discussion
This analysis of longitudinal data on 4469 individuals in the COPDGene® cohort, comparing the newly published GOLD 2017 COPD classification to the 2011 criteria, has 4 principal findings. First, though group D continued to have the highest rates of deaths and exacerbations in both classifications, GOLD 2011, using either spirometry or exacerbation history as risk descriptor, provided more accurate mortality discrimination in all ABCD groups. Second, we found a higher mortality rate in group B than in group C in both GOLD 2011 and GOLD 2017. Third, the 2 classifications showed similar overall performance in predicting the frequency of exacerbations, including severe exacerbations. Finally, GOLD 2017 distributed more individuals in our cohort to group B and fewer to group D, compared to GOLD 2011, and in both classifications, group C was the smallest.
Although the GOLD classification system is intended to guide management, several studies over the years have compared the association between GOLD groups and mortality and exacerbation rates. The thrust of this analysis and those of others address whether successive modification of the GOLD criteria is actually producing better prognostic instruments and whether a single scheme identifies those both at risk for exacerbations and death. Our finding that, in both classifications, mortality was highest in group D and lowest in group A agrees with and extends studies that examined the 2011 criteria,2,3,18 or which compared 2007 and 2011 GOLD criteria.2,8,19 Similar or better performance for mortality prediction of the 2007 GOLD criteria, relative to the 2011 criteria, was seen in the GenKOLS and UPLIFT cohorts.8,11 COCOMICS also found similar mortality rates for 2007 and 2011 criteria at 1, 3 and 10 years.9 In agreement, a patient-pooled analysis by Soriano and colleagues also found similar predicted mortality rates for GOLD 2007 and 2011 over a 10-year follow-up period. Collectively, these analyses of earlier GOLD classifications suggested that symptoms and exacerbation history add little to prediction of death.10
Hence, our finding that GOLD 2011 is a better predictor of mortality than GOLD 2017 is a finding that warrants testing in other cohorts with longitudinal mortality data. Importantly, this disparity persisted when alternate definitions were used for classification, such as using SGRQ for mMRC. Our results agree with an analysis showing that survival rates based on spirometry-only criteria were lower than those based on exacerbation history-only criteria.9 Interestingly, in that study, combining spirometry and exacerbation history did yield additively decreased survival rates.9 Aligned with these findings of the additive value of information on spirometry to exacerbation history, we found that a model including both GOLD 2017 ABCD groups and spirometry severity could increase the discrimination ability for mortality, obtaining an AUC 0.73 (data not shown), significantly better than ABCD groups alone, 2011 or 2017. Unfortunately, combining these data will create at least 8 groups, which may limit practical utility.
There was only a minimal difference between GOLD 2011 and 2017 when predicting exacerbations, including severe exacerbations, suggesting that simplification of the 2017 ABCD system to exclude spirometric data performs just as well as the 2011 ABCD system in predicting these key health care utilization events. These results align with a large population-based study in Copenhagen by Lange and colleagues, in which they found that the 2011 ABCD classification predicted future exacerbations better than the 2007 criteria, implying that symptoms and exacerbation history are key contributors to the natural history of COPD.3 Lange et al and our findings contrast to Han and colleagues, who performed an analysis using the same COPDGene® cohort as in this study and focused only on the GOLD 2011 classification3,20; they subcategorized individuals in group D into D1 (met FEV1 criteria only), D2 (met exacerbation criteria only) and D3 (met FEV1 and exacerbation criteria) and found that those meeting both exacerbation and spirometry criteria had the highest number of and most severe exacerbations.20 It is unlikely that the lack of difference between GOLD 2011 and GOLD 2017 in the current analysis in exacerbation prediction performance results from massive changes in allocation of individuals, as in both, group D had the greatest number of exacerbations, groups B and C were intermediate and group A had the least, as seen in other cohorts. Instead, our current analysis suggests that exacerbation history performs just as well as lung function combined with exacerbation history in predicting future exacerbations.5
Our finding that groups B and C had similar annual exacerbation rates, in both GOLD 2011 and GOLD 2017 grouping systems and even when using alternate definitions such as SGRQ, contrasts with prior studies. GOLD group C was the smallest category in our analysis, in agreement with multiple studies comparing GOLD 2007 and 2011.8,18,21,22 Group C has been suggested to be superfluous, as its treatment options are very similar to those of group B,10 and due to crossover of individuals between groups B and C during the 3-year follow-up.2 However, our data argue against combining them, as we found a significantly higher mortality rate in group B. The agreement of this finding with 2 studies comparing GOLD 2007 and GOLD 2011 criteria8,19 suggests that the mortality difference was unlikely to have resulted solely from the smaller sample size of group C. This mortality gap has been proposed to reflect high rates of cardiovascular disease and malignancy in group B.3 An initial analysis of the COCOMICS cohort found similar mortality rates between these groups at up to 3 years follow-up,9 but a separate study using patient-based pooled analysis found a higher mortality risk in group C thereafter.10
We acknowledge several limitations. While the ABCD grouping aims to identify those at risk for poor outcomes in order to guide therapy, it was not designed specifically as a mortality or exacerbation risk prediction tool. While the GOLD 2011 exhibited significantly better discrimination in predicting mortality, as defined by AUC for receiver-operator analysis, than the 2017 classification, the confidence intervals for the AUCs do overlap. A third limitation is that we used all-cause, rather than COPD-specific, mortality, an approach also used in other investigations with similar goals. Nevertheless, COPDGene® has used multiple approaches to ascertain vital status of its enrollees, providing strength to our findings. Finally, the GOLD consensus statement is intended for global application to COPD patients, whereas we analyzed a non-population-based sample from 21 U.S. centers, although large enough to have a wide scope and representation of individuals with different disease severity.
In summary, we present an analysis contrasting the new GOLD 2017 and GOLD 2011 classification schema for its association with exacerbation risk and mortality. In our sizeable cohort, the elimination of FEV1 as a classifier in GOLD 2017 reduced ability to discriminate survival, highlighting the need to consider severity of airflow obstruction in assessing mortality risk. Our findings support the GOLD Scientific Committee decision to remove spirometry for exacerbation risk assessment.
Acknowledgements
Author contributions: MeiLan K. Han and Carlos H. Martinez performed the data analysis. MeiLan K. Han, Carlos H. Martinez, and Susan Murray interpreted the data. Rachel N. Criner, MeiLan K. Han, and Carlos H. Martinez drafted the manuscript. Rachel N. Criner, Meilan K. Han, Carlos H. Martinez, Wassim M. Labaki, Elizabeth A. Regan, Jessica M. Bon, Xavier Soler, Surya P. Bhatt, Susan Murray, John E. Hokanson, Edwin K. Silverman, James D. Crapo, Jeffrey L. Curtis, Fernando J. Martinez, and Barry J. Make revised the final draft. All authors approved the final version to be published.
Declaration of Interest
Fernando J. Martinez reports COPD-related personal fees and non-financial support from the American College of Chest Physicians; grants, personal fees, and non-financial support from AstraZeneca and GlaxoSmithKline; personal fees from Columbia University, Haymarket Communications, Integritas, Inthought Research, MD Magazine, Methodist Hospital Brooklyn, New York University, Pearl Pharmaceuticals, Unity, UpToDate, WebMD/MedScape, and Western Connecticut Health Network; personal fees and non-financial support from ConCert, Genentech, Inova Fairfax Health System, Continuing Education, Miller Communications, National Association for Continuing Education, Novartis, PeerView, Prime, Puerto Rican Respiratory Society, Chiesi, Roche, Sunovion, Theravance, and Boehringer Ingelheim; and non-financial support from ProterrixBio. Barry J. Make reports grants from National Heart, Lung, and Blood Institute; personal fees from Novartis, CSL Bering, Verona, Boehringer Ingelheim, Theravance, and Circassia; grants and personal fees from AstraZeneca; receives research funds from Pearl, which is provided to and controlled by National Jewish Health; reviews clinical trial data and serves on the Data and Safety Monitoring Board for Spiration; receives grants from and serves on the advisory board of GlaxoSmithKline; and participates in continuing medical education activities from Consensus Medical Education, Integrity Medical Education, Mt. Sinai Medical Center, WebMD, Up-To-Date, National Jewish Health, SPIRE Learning, American College of Chest Physicians, Projects in Knowledge, Hybrid Communications, Peer Review Institute, Cleveland Clinic, Medscape, and Ult Med Academy. Surya P. Bhatt and Susan Murray declare grants from the National Institutes of Health. Edwin K. Silverman reports grants from National Institutes of Health, personal fees from Novartis, and grant and travel support from GlaxoSmithKline. Jeffrey L. Curtis reports grants from the National Institutes of Health/National Heart Lung and Blood Institute, Department of Veterans Affairs, Department of Defense, National Institutes of Health's National Institute of Allergy and Infectious Diseases and MedImmune Corp., Ltd. MeiLan K. Han reports personal fees from GlaxoSmithKline, AstraZeneca, and Boehringer Ingelheim, research support from Sunovion, and non-financial and research support from Novartis. All other authors have nothing to declare.