Running Head: Physiologic Insights from the COPDGene® Study
Funding Support: The project described was supported by Award Number U01 HL089897 and Award Number U01 HL089856 from the National Heart, Lung, and Blood Institute. The content is solely the responsibility of the authors and does not necessarily represent the official views of the National Heart, Lung, and Blood Institute or the National Institutes of Health. The COPDGene® project is also supported by the COPD Foundation through contributions made to an Industry Advisory Board comprised of AstraZeneca, Boehringer Ingelheim, GlaxoSmithKline, Novartis, Pfizer, Siemens and Sunovion.
Date of Acceptance: April 18, 2019
Abbreviations: COPD Genetic Epidemiology, COPDGene; chronic obstructive pulmonary disease, COPD; computed tomography, CT; asthma-COPD overlap syndrome, ACO; forced expiratory volume in 1 second, FEV1; forced vital capacity, FVC; Preserved Ratio Impaired Spirometry, PRISm; 6-minute walk test, 6MW; forced expiratory volume in 6 second, FEV6; lower limit normal, LLN; low attenuation area, LAA; Hounsfield units, HU; St George’s Respiratory Questionnaire, SGRQ; modified Medical Research Council, mMRC; Global Lung Initiative, GLI; body mass index, BMI; bronchodilator response, BDR; acute exacerbation of COPD, AECOPD; prebronchodilator obstruction, PREO; postbronchodilator obstruction, POSTO; prebronchodilator obstruction not present, PREN; postbronchodilator obstruction not present, POSTN; Body mass index-airway Obstruction-Dyspnea-Exercise, BODE
Citation: Stringer WW, Porszasz J, Bhatt SP, McCormack MC, Make BJ, Casaburi R. Physiologic insights from the COPD Genetic Epidemiology study. Chronic Obstr Pulm Dis. 2019; 6(3): 256-266. doi: http://doi.org/10.15326/jcopdf.6.3.2019.0128
Online Supplemental Material: Read Online Supplemental Material (529KB)
Description of the COPD Genetic Epidemiology Study (Phase I and II)
The COPD Genetic Epidemiology study (COPDGene®) is a federally funded, observational, multicenter (21 sites, see online supplement), longitudinal study of 10,300 cigarette smokers in the United States. The population is biracial, including non-Hispanic whites (approximately two-thirds), and African Americans, (approximately one third), and is now embarking on its third, 5-year cycle of participant visits (denoted Phase I, II and III). The study is designed to better understand genetic risk factors for COPD in current and former smoking individuals from these 2 racial populations. All enrolled individuals were male or female smokers with at least a 10 pack-year history of cigarette use, between 45 and 80 years of age. Individuals with normal and abnormal spirometry were included, however, those with established lung diseases other than COPD and asthma, such as lung cancer, bronchiectasis, and interstitial lung disease were excluded.1
Introduction
Physiologic Testing Methodology
Spirometry was performed (Easy-One Spirometer; NDD, Andover, Massachusetts) before and after administration of 180 μg of metered-dose inhaler albuterol (via Aerochamber Activis, Parsippany, New Jersey). Bronchodilator reversibility was defined as at least 12% and 200-ml increase in forced expiratory volume in 1 second (FEV1) and/or forced vital capacity (FVC) post-bronchodilator.2 COPD severity was assessed using post-bronchodilator spirometry criteria outlined by the Global initiative for chronic Obstructive Lung Disease (GOLD) guidelines with reference values from the National Health and Nutrition Examination Survey III.2,3 GOLD stage 0 refers to current and former smokers without COPD (normal FEV1, FVC and FEV1/FVC > 0.70), a classification which has been removed from current GOLD guidelines, but was used previously.4 Participants with Preserved Ratio Impaired Spirometry ( PRISm) have an FEV1 less than 80% of predicted but normal FEV1/FVC ratio (>0.70).5 PRISm has previously been defined with reference to the COPDGene® population.6
The 6-minute walk test (6MW) was performed once without practice and with standardized encouragement according to American Thoracic Society/European Respiratory Society criteria.7
Novel Spirometric Insights
Assessment of Small Airway Disease by Spirometry
Key Section Insights:
- The FEV1/ forced expiratory volume in 6 seconds (FEV6) ratio may be more useful than FEV1/FVC in identifying COPDGene® participants with greater gas trapping, higher airway wall thickness, more exacerbations, greater morbidity, poorer functional status, and reduced quality of life.
- An earlier diagnosis of COPD could be achieved in the COPD cohort using FEV3/FEV6<LLN rather than FEV1/FVC<0.70 or FEV1/FEV6 <0.73.
The COPDGene® project has revealed new opportunities to detect airflow obstruction at an earlier stage. By the nature of the pathophysiological processes, the development of emphysema affects the alveolar wall and respiratory bronchioles first, causing confluence of the smallest anatomical structures. The widespread chronic inflammation of the alveoli and small airways eventually leads to a loss of elastic recoil. Alveolar cell death and impaired alveolar wall maintenance are players in the pathological processes that are linked to chronic inflammation and oxidative stress.8,9 Assessment of these patho-anatomic changes relative to spirometric results are now possible using modern imaging technologies, including inspiratory and expiratory computed tomography (CT) and, using the “Parametric Response Map of CT” in COPD patients, there is evidence that small airways disease precedes the development of emphysema based upon cross-sectional data.10
There are 2 significant publications from the COPDGene® investigators examining gas trapping and small airway disease.11,12 Bhatt et al11 showed that FEV6 can replace the use of FVC in spirometry. The authors found that participants with isolated FEV1/FEV6 reduction had greater gas trapping and airway wall thickness, worse functional capacity, and had a higher frequency of exacerbations than those without a reduced FEV1/FEV6 in the sub-population with normal FEV1/FVC and in comparison to those with only FEV1/FVC abnormality. Although the number of FEV6-COPD patients (FEV1/FEV6 abnormal only) was very small (1.3%), these participants had greater morbidity, poorer functional capacity (6MW distance), and reduced quality of life indices, along with significantly greater airway thickness and gas trapping on CT than the COPD or normal spirometry groups.
These results are important in the sense that the timed exhalation is, by definition, more exact than the FVC as the test endpoint for FVC varies between participants and sometimes even within the same participant in the series of spirometry assessments across consecutive visits. In chronic airway obstruction, this means that as the exhalation time increases, volume measured over time continues to increase and this rise is more pronounced in those with more severe obstruction. One of the criticisms of using the timed exhalation measured at 6 seconds is that it might underestimate the diagnosed cases as the ratio becomes higher.
Another work addressing small airway disease proposed that an earlier diagnosis of COPD than using FEV1/FVC < 0.70 or even FEV1/FEV6 < 0.73 could be obtained using the criterion of FEV3/FEV6 < lower limit normal (LLN).12 The physiologic basis of this measurement is that FEV3 by definition assesses the exhaled volume over a longer period of time (i.e., the first 3 seconds), instead of only the first second of the forced exhalation. Physiologically, this means that the more peripheral airways and lung compartments with slower time constants contribute to the measured volume. Dilektasli et al12 has shown that 15.4% of those with normal spirometry using the LLN criteria established by Hansen et al13 have FEV3/FEV6 < LLN. This group of patients had a higher degree of gas trapping (15% low attentuation area [LAA]exp < -856 Hounsfield units [HU]), worse symptomatology (by the St George’s Respiratory Questionare [SGRQ] and modified Medical Research Council [mMRC] scores) and worse functional indices (6MW distance) than the group with normal spirometry, including FEV3/FEV6 > LLN. However, radiologically defined emphysema (5% LAAinsp < -950HU) was not significantly increased. Patients with isolated FEV3/FEV6 abnormalities are a distinct population with abnormal radiological measures, clinical symptomatology and functional indices, and FEV3/FEV6 can be considered to be a diagnostic tool for early detection of COPD. Dilektasli’s study demonstrates the presence of structural and functional changes associated with gas trapping before airflow obstruction becomes evident by the classic spirometric criteria of FEV1/FVC < LLN.
Challenging the Definitions of Normal Spirometry and Severity of Spirometric Impairment
Key Section Insights
- Fixed ratio FEV1/FVC < 0.70 as the sole criteria for the diagnosis of COPD has been found to underdiagnose younger participants and over-diagnose older participants in comparison to the LLN approach.
- Participants with an FEV1/FVC below the LLN had higher degrees of emphysema and gas trapping relative to the fixed FEV1/FVC of 0.70.
- The optimal threshold (LLN versus fixed ratio) for COPD patients remains controversial.
- Global Lung Function Initiative (GLI)-defined spirometric impairment correlates well in a graded fashion, with respiratory related phenotypes.
COPDGene® incorporated anatomic and clinical approaches to assessing smoking-induced lung damage (inspiratory and expiratory CT scans) which have contributed to our understanding of the sensitivity and specificity of spirometric criteria using a fixed FEV1/FVC value of < 0.7014 as the sole criteria for the diagnosis of COPD. Fixed ratio targets are particularly important as they have been found to underdiagnose younger participants and over-diagnose older participants in comparison to an LLN approach.15,16 As such, Bhatt17 investigated the use of LLN (lower 5% of the healthy non-smoking population) versus a fixed FEV1/FVC of 0.70 in post-bronchodilator spirometries as compared to the “gold standard” CT measures of emphysema and gas trapping. Participants with FEV1/FVC less than the fixed 0.70 but negative by LLN had a higher degree of emphysema (4.1% versus 1.2%) and gas trapping (19.8% versus7.5%) compared with those positive by LLN. COPD detection using LLN and fixed number for FEV1/FVC had a high degree of agreement, but 566 (7.3%) were discordant by the 2 criteria. It was noted that the discordance was most prominent in the older age group. Finally, these investigators found that participants with fixed ratio obstruction had higher risk for exacerbation on follow-up than those with abnormal LLN only. The optimal threshold (LLN versus fixed ratio) for COPD patients remains controversial.
Vaz Fragoso et al in 2 recent papers18,19 used the COPD spirometry database to explore the changes in spirometric values related to aging by contrasting the GLI and GOLD criteria. In their 2015 study, the authors studied 5100 participants (ages 45-80, smoking history ≥ 10 pack years) who had normal spirometry by GLI criteria. In this group, GOLD criteria identified impairment in 22.5% (restrictive 9.1%, mild COPD 7.5%, moderate COPD 5.9% and severe COPD 0%). These 5100 GLI-defined normal spirometry participants also had normal mean values for dyspnea grade (0.8), SGRQ (15.9), 6MW distance (434 m), bronchodilator reversibility (2.75% FEV1 change), percentage of emphysema (0.9%), percentage of gas trapping (10.7%), and airway diameters. The authors concluded that GOLD spirometry criteria may misclassify a substantial number of normal older individuals as having respiratory impairment.
In the second paper (2016), the authors focused on the GLI abnormal spirometry groups (49.7% of the entire COPDGene® population, or 5031 participants).19 The authors found that 6.6% of this population had mild COPD, 8.5% had moderate COPD, and 24.9% had severe COPD with 9.6% being restrictive pattern using GOLD criteria. In the GLI mild, moderate, and severe COPD groups, respectively, mMRC dyspnea grade (1.31, 2.2, 10.73), SGRQ health-related quality of life (1.49, 2.69, 14.61), exercise performance on 6MW (1.11, 1.58, 4.58), percentage of bronchodilator reversibility (2.76, 5.18, 6), percentage of emphysema (4.86, 6.41, 17.79), and percentage of gas trapping (3.92, 5.20, 16.28) were all associated in a graded fashion with GLI classification. The PRISm patients had high prevalence of multiple respiratory-related symptoms and activity limitations, but not emphysema or gas trapping. The authors concluded that GLI-defined spirometric impairment correlates, in a graded fashion, with respiratory related phenotypes.
Characterization of Smokers with Normal Spirometry and PRISm
Key Section Insights
- Smokers with normal spirometry (GOLD 0) enrolled in COPDGene® were found to have respiratory impairments that included increased symptoms, use of respiratory medications, physical functional limitation, CT abnormalities, or impaired quality of life measures in over half of the patients.
- PRISm was identified in about 12% of the COPDGene® cohort.
- PRISm participants had higher body mass index (BMI), comorbidities such as diabetes mellitus and greater smoking history as well as increased respiratory symptoms, increased emphysema on CT scan, greater segmental wall area, and lower total lung capacity.
- Over 50% of GOLD 0 (smokers with normal spirometry) had CT evidence of emphysema or airway wall thickening.
COPDGene® has made advances in defining characteristics of patients with different patterns of spirometry, beyond those with classic airflow obstruction that defines COPD. These patterns of spirometry include smokers with normal spirometry, which has been described as GOLD 0,6 and those with PRISm,6,20,21 which has also been referred to as the non-specific pattern, unclassified and restrictive spirometry.22,5
The GOLD 0 patients enrolled in COPDGene® were found to have respiratory impairments that included symptoms, use of respiratory medications, physical functional limitations, CT abnormalities, or impaired quality of life measures in over half of the patients.23 Quality of life assessed using the SGRQ was lower in the Gold 0 versus never smokers, as was 6MW distance. Inhaled respiratory medications were being taken by about 20% of GOLD 0 participants who experienced respiratory symptoms. Importantly, spirometry appears to underdiagnose smoking-induced lung damage since over 50% of GOLD 0 participants had CT evidence of emphysema or airway wall thickening with these findings being more common in former smokers compared to never smokers. These findings suggest that a subset of former and current smokers have structural and clinical lung disease that is not identified by spirometry and supports the application of radiographic imaging and symptom assessment to complement spirometry in classification of smoking-related lung disease. These findings also identify the need to better understand the role of pharmacotherapy in smokers with preserved spirometry who have respiratory symptoms.
The COPDGene® study has also provided an opportunity to extensively characterize individuals with the PRISm pattern of spirometry.6,20 The PRISm prevalence of about 12% in the COPDGene® cohort is consistent with the values reported in other cohorts.20,24,25 The COPDGene® findings have confirmed and extended our understanding of the contribution of obesity to the PRISm pattern. Increased BMI was found to be associated with the presence of PRISm, however, obesity did not fully account for the spirometry impairment. PRISm was also associated with increased prevalence of important comorbidities, such as diabetes mellitus and greater pack-year history of smoking. Finally, as compared to participants with normal spirometry, those with PRISm had lower 6MW distances, increased respiratory symptoms, increased presence of emphysema on CT scan, greater segmental wall area, and lower total lung capacity.20
Further insights related to PRISm have been gained from longitudinal analysis of COPDGene® data. About half of participants who had PRISm continued to demonstrate this pattern at the 5- year follow-up while 22% morphed into GOLD 0 and 25% progressed to GOLD 1-4 stages.2,21 The frequent transitions to other spirometric patterns among those with PRISm has been noted in other studies.24 Participants with stable PRISm, demonstrated at both the baseline and 5-year follow-up visits had a lower rate of decline in FEV1 and similar proportion of normal CT findings relative to the GOLD 0 participants. Stable PRISm participants in COPDGene® had higher mortality rates during the 5-year follow-up than GOLD 0, consistent with prior studies,24,25 but lower than GOLD 1-4. Participants who developed incident PRISm between the baseline and 5-year follow-up visit were shown to have unique clinical characteristics, including being younger, having increased BMI, and being more likely to be current smokers or of African American descent.21 Those participants with PRISm had accelerated decline in FEV1 and increased respiratory morbidity, suggesting that this may be a higher risk group.
Asthma-COPD Overlap
Key Section Insights
- More than 25% of COPDGene® participants self-reported a history of asthma.
- Asthma-COPD overlap syndrome (ACO) was observed more often in younger participants, African Americans, participants with higher BMI, and current smokers.
Cosentino et al26 analyzed the spirometric and CT data from the COPDGene® study to better understand the asthma-COPD overlap syndrome (ACO). The authors state that up to 25% of patients with COPD report a history of asthma, and that ACO patients have poorer quality of life, more rapid decline in lung function, higher mortality, and use a greater amount of health care resources.26 To assess this, the authors analyzed 10,192 COPDGene® participants and categorized the participants as having ACO-bronchodilator response (BDR) if there was evidence of obstructive lung disease on spirometry (FEV1/FVC < 0.70), a bronchodilator response (FEV1 improvement > 200 ml and 12%), less than 15% emphysema on CT and a positive or negative history of hay fever or asthma. The COPD group was defined as having spirometry with an FEV1/FVC < 0.70, no history of asthma or hay fever, and > 15% emphysema on CT. The authors found that 385 participants met the criteria for ACO and 620 for COPD with emphysema. Comparing those 2 groups, participants with ACO were younger (60.6 versus 65.9 years), more likely to be African American, had a higher BMI (29.6 versus 25.1), and were more likely to be current smokers (50.9% versus 20.7%). Using the GOLD guidelines ABCD assessment tool (A: minimal symptoms and no exacerbations; B: marked symptoms and no exacerbations; C: minimal symptoms and exacerbations; and D: marked symptoms and exacerbations) the authors categorized the ACO with a bronchodilator effect (ACO-BDR) with the ACO-COPD group (Figure 1).
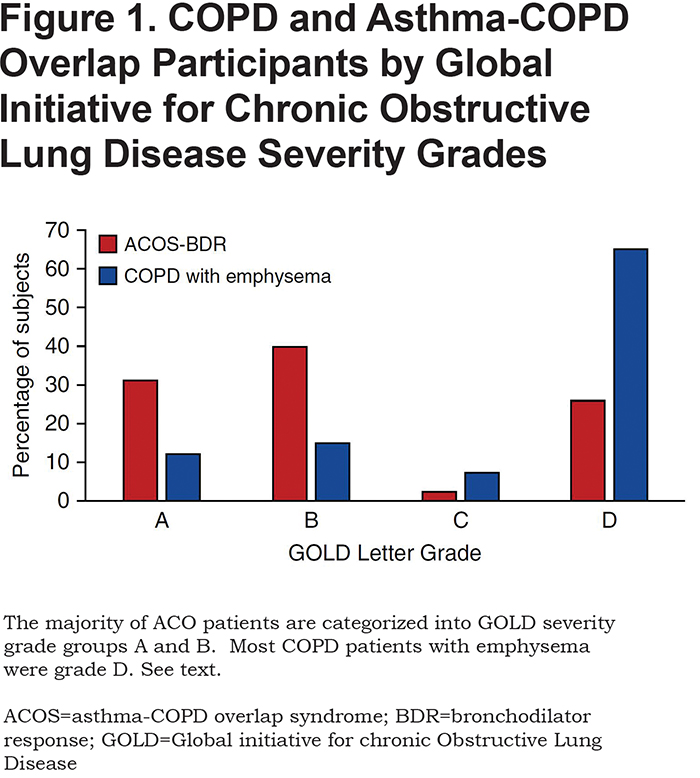
The majority of ACO participants were categorized as GOLD grade A or B, and most COPD with emphysema participants were GOLD grade D (Figure 1). There was no difference in frequent or severe exacerbations between the COPD and ACO groups. The authors concluded that bronchodilator responsiveness and degree of emphysema can help define ACO and that this group is a high -risk group for increased symptoms, possibly due to continued smoking status.
Determinants of 5-Year Decline in Spirometric Measures
Key Section Insights
- Post bronchodilator spirometric measures were better predictors of mortality over a 5-year period when compared to pre-bronchodilator values in the COPDGene® cohort.
- Acute exacerbations of COPD (AECOPD) and respiratory events were observed in more than one third (36.7%) of the COPDGene® participants within the 5-year follow-up window, with the following rates in individual subgroups: PRISm (30.5%) and GOLD Stage 0-4 (21.5%, 27.4%, 46.4%, 70.2%, 69.6%, respectively).
- Exacerbations or acute respiratory events of any severity were associated with statistically significant excess FEV1 decline in GOLD stage 1, 2, and 3 participants.
- GOLD 1 had the most rapid rate of decline in FEV1 (54.3 ml/yr), with slower rates of decline with increasing GOLD grades (2-4): 45.6, 28.8, and 8.0 ml/yr.
Fortis et al4 studied the COPDGene® database to compare the spirometric prebronchodilator obstruction (PREO) and postbronchodilator obstruction (POSTO) to selected COPD features and outcomes. The authors opined that since FVC is more responsive to bronchodilator than FEV1, post-bronchodilator FEV1/FVC < 0.70 should be more sensitive than pre-bronchodilator measurements to identify patients with clinically significant hyperinflation. From a population of 10,000, the authors reported on 4 groups: (1) PREO-POSTO, both pre and post FEV1/FVC < 0.70, 4150; (2) prebronchodilator obstruction not present (PREN)- postbronchodilator obstruction not present (POSTN) both pre and post FEV1/FVC > 0.70, 4683; (3) PREO-POSTN, pre FEV1/FVC < 0.70 but post > 0.70, 866; and (4) PREN-POSTO pre FEV1/FVC normal, and post FEV1/FVC < 0.70, 301. The authors conclude that the COPD prevalence was higher using the PREO (866 or 8.7 % had PREO positive, but not POSTO), however, both PREO and POSTO spirometries were associated with increased chronic bronchitis, dyspnea, exercise performance reduction, and COPD radiographic findings. The authors determined, using the initial and follow-up assessment (average number of days followed was 1956 ± 407, number of deaths 830) in COPDGene®, that post bronchodilator spirometric measures were better predictors of mortality when compared to pre-bronchodilator values over a 5-year period and that post bronchodilator spirometry may be a more accurate predictor of COPD features and outcomes.
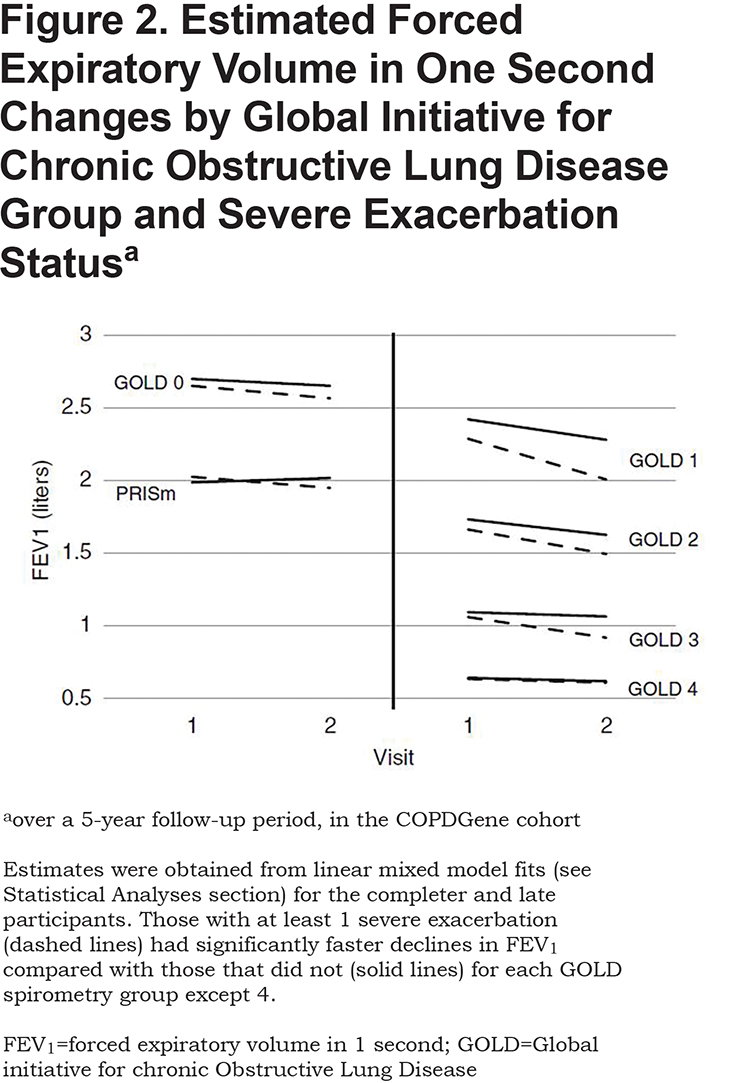
The presence and magnitude of the fall in FEV1 across various COPD GOLD spirometry stages plus GOLD 0 and PRISm remains an important concern in the pulmonary literature. Specifically, what causes the decline, are they associated with specific phenotypes, and can they be mitigated or improved? To address these important topics, Dransfield et al27 studied the first 2000 participants who returned for their 5-year follow-up visit (Phase II). Their assessment of AECOPD and respiratory events showed that more than one third (36.7%) of the participants experienced an exacerbation within the 5-year follow-up window, with rates increasing across PRISm (30.5%) and GOLD stages 0-4 (21.5%, 27.4%, 46.4%, 70.2%, 69.6%, respectively). Severe events requiring hospitalization were common even in the PRISm (14%) and GOLD stage 0 groups as well as GOLD stages 1-4 (8%, 10%, 24%, 42%, and 47%, respectively). Assessing the effects of these exacerbations on the FEV1 decline, the authors found that exacerbations or acute respiratory events of any severity were associated with statistically significant excess FEV1 decline in GOLD stage 1, 2, and 3 participants. The magnitude of effect was largest in GOLD stage 1 participants, where each exacerbation was associated with an additional 23 ml/yr decline in FEV1. Interestingly, there was no statistically significant excess decline in FEV1 for each additional exacerbation/acute respiratory event of any severity in the PRISm, GOLD stage 0, or GOLD stage 4 subgroup. Severe exacerbations were associated with even greater declines in FEV1 and the strongest effect was observed in GOLD stage 1 participants, where each severe exacerbation was associated with an additional 87 ml/yr decline in FEV1 (Figure 2). This study identifies a very strong association between exacerbations and progression of FEV1 loss in GOLD stages 1-3 participants, although causality is not assured due to the observational nature of the study.
In another study addressing FEV1 decline across time, Bhatt et al28 used paired inspiratory and expiratory CT scans from participants who had completed both the initial (Phase I) COPDGene® visit and follow up (Phase II) 5 years later. A sophisticated computer algorithm was used to identify the same voxels on both inspiratory and expiratory CT scans and determine a biomechanical metric (Jacobian determinant) which is a measure of regional parenchymal volume change with respiration. The authors sought to determine if the regional deformation in parenchyma related to emphysema might be causing further damage, or whether “…emphysema begets more emphysema.” Complete data was available on 680 participants who spanned the range of COPD 1-4 categories (120 [17.6%], 308 [45.3%], 190 [27.9%], and 62 [9.1%], respectively). The mean rate of decline in FEV1 was 39.0 ml/yr. Those with GOLD 1 had the most rapid rate of decline, 54.3 ml/yr. The rate of FEV1 decline was slower with increasing GOLD stages: 45.6, 28.8, and 8.0 for GOLD stages 2–4, respectively. The Jacobian determinant decreased progressively with GOLD stage, and the Jacobian determinant of voxels with normal density also progressively decreased with increasing GOLD stage. The authors showed that, in participants with emphysema, normal-appearing lung regions on CT have abnormal regional expansion, and that there is a spatial relationship between areas of emphysema and abnormal lung mechanics of normal appearing areas, resulting in a region of mechanically affected lung (MAL). Quantifying the amount of MAL can independently predict change in FEV1 over time.
Predictors of Functional Exercise Performance in COPDGene®
Key Section Insights
- COPDGene® participants with higher measures of emphysema and gas trapping tended to have lower 6MW distance however, use of more easily measured phenotypical characteristics removed the CT measures prediction of 6MW distance.
- Abnormalities on CT scans were associated with reduced 6MW distance in the COPDGene® cohort.
The COPDGene® study also incorporated a functional measurement of walking distance.29 This test is not a maximal test and is probably best termed a measure of functional exercise performance, rather than a measure of exercise capacity. In cross-sectional studies, a low 6MW distance has been found to be a predictor of mortality.30 Two publications utilizing the large COPDGene® database have explored the ability of other measures performed in COPDGene® to predict 6MW distance, with a prominent focus on CT characteristics.
Rambod et al31 utilized a data base of the first-recruited 2500 participants in COPDGene® to determine whether CT measures of emphysema or gas trapping provided additional predictive power of 6MW distance over that provided by more easily assessed determinants. They found that, as expected, participants with higher measures of emphysema and gas trapping tended to have lower 6MW distance. However, when the participants were divided by GOLD spirometry stage, after adjustment for age, sex, race and BMI, within each spirometry stage, percentage of emphysema and percentage of gas trapping were no longer predictive of 6MW distance. Therefore, after adjustment for other more easily measured phenotypical characteristics, CT measures were not predictive of 6MW distance. An interesting insight accompanying this analysis was that, within each spirometric stage, all of the measured variables explained only a small portion of 6MW distance variability (coefficient of determination ranging from 0.16 to 0.27). This may be related to the sensitivity of 6MW distance to non-physiologic factors (e.g., motivation, accustomed level of activity, comorbidity, cachexia, etc).
Doyle et al32 explored the impact of a specific CT abnormality on 6MW distance. Interstitial lung abnormalities (ILA) were defined as CT changes affecting more that 5% of any lobar region “including nondependent ground-glass or reticular abnormalities, diffuse centrilobular nodularity, nonemphysematous cysts, honeycombing or traction bronchiectasis.” Of scans from 2416 COPDGene® participants, 194 (8%) were found to have ILA and 1361 (56%) were found to have no ILA (the remainder were classified as indeterminate). Compared to those without ILA, those with ILA had mildly lower 6MW distance, averaging 23 meters. In participants with COPD, the 63 participants with ILA had lower 6MW distance than the 561 participants with no ILA. Similarly, in participants with normal spirometry, the 130 participants with ILA had lower 6MW distance than the 800 participants with no ILA.
Composite Physical /Physiologic Measures/BODE Index
Key Section Insights
- The BODE index results in the COPDGene® participants were most correlated with CT scan evidence of emphysema.
- BODE scores were most strongly influenced by its FEV1 component.
The Body mass index-airflow Obstruction-Dyspnea-Exercise (BODE), score, is a multidimensional index, originally proposed by Celli et al33 to provide a better predictor of mortality in COPD patients than its components. This index weighs the results of the 6MW distance, but also BMI, the percentage predicted FEV1 and the mMRC. Martinez et al34 explored the ability of CT metrics to predict BODE score in 1200 COPDGene® participants who met the spirometric definition of COPD. In both univariate and multivariate analyses, both emphysema and selected airway measures showed statistically significant association with BODE score, with percentage of emphysema showing the stronger relation. Not surprisingly, the relationship between emphysema and BODE was driven most strongly by its relationship with the FEV1 component of BODE; the relationship with the 6MW distance component was less prominent.
Limitations and Strengths of COPDGene®
Limitations in the physiologic assessments available in the COPDGene® study include the 5-year interval between assessments, observed variability in quality control of the spirometric tracings, lack of a gas transfer at the time of enrollment, use of 6MW instead of more sophisticated assessment of exercise tolerance/capacity, and exclusion of Hispanics and Asians due to greater genetic variability. Strengths include the size of the study, the detailed anatomic and genetic information acquired, the health-related questionnaires and exacerbation histories, and the very large proportion of African Americans included in the cohort.
Summary
COPDGene® has provided a substantial contribution to our physiologic understanding of smoking-induced lung injury, and this large data set will continue to mature with acquisition and analysis of the 10-year data in Phase 3. The message from CT anatomic assessment highlights the underdiagnosis of smoking-induced lung disease using spirometry or symptoms alone, and the marked improvement in sensitivity and specificity with CT scanning.
Acknowledgements
Author Contributions: All authors contributed to the content or editing of this review manuscript.
Declaration of Interest
WWS reports research grants from Boehringer Ingelheim, AstraZeneca, Astellas and consulting with Allergan and Syneos Health. SPB has received research grants from the National Institutes of Health (K23HL133438) and from ProterixBio. He has served on advisory boards for Sunovion and GlaxoSmithKline. MCM reports royalties for authorship from UpToDate and consulting with GlaxoSmithKline. BJM reports consulting agreements and/or grant funding and/or advisory board service for AstraZeneca, the National Heart Lung and Blood Institute, Spiration, GlaxoSmithKline, Sunovion, Pearl, Verona, Boehringer Ingelheim, Theravance, Circassia, Third Pole, Shire, and Phillips. RC reports research grants from Boehringer Ingelheim, Astra Zeneca, Astellas, Glaxo SmithKline; service on advisory boards from Boehringer Ingelheim, GlaxoSmithKline; consulting for Regeneron, Genetech; speakers bureau for Boehringer Ingelheim, Astra Zeneca and GlaxoSmithKline. JP has nothing to declare.