Running Head: COPD Subtypes and Mortality
Funding Support: COPDGene® is supported by the National Heart, Lung, and Blood Institute (U01 HL089897 and U01 HL089856). This work was also supported by National Heart, Lung and Blood Institute K01 HL125858 (SML). MHC was supported by NHLBI grants R01HL113264, R01HL137927, and R01HL135142. COPDGene® is also supported by the COPD Foundation through contributions made to an Industry Advisory Board comprised of AstraZeneca, Boehringer Ingelheim, GlaxoSmithKline, Novartis, Pfizer, Siemens and Sunovion.
Date of Acceptance: October 28, 2019
Abbreviations: chronic obstructive pulmonary disease, COPD; COPD Genetic Epidemiology, COPDGene®; computed tomography, CT; C-reactive protein, CRP; surfactant-D, SP-D; airway-predeominant disease only, APD-only; empysema-preeominant disease only, EPD-only; combined airway-predominant disease and emphysema-predominant disease, APD-EPD; preserved ratio-impaired spirometry, PRISm; Body mass index-airway Obstruction-Dyspnea-Exercise capacity index, BODE; soluble receptor for advanced glycation end products, sRAGE; Global initiative for chronic Obstructive Lung Disease, GOLD; longintudinal follow-up, LFU; body mass index, BMI; cardiovascular disease, CVD; modified Medical Research Council, mMRC; Social Security Death Index, SSDI; wall area percentage, WA%; standard deviation, SD; hazard ratio, HR; confidence interval, CI; analysis of variance, ANOVA; low attenuation area percentage, LAA%
Citation: Young KA, Regan EA, Han MK, et al and the COPDGene Investigators. Subtypes of COPD have unique distributions and differential risk of mortality. Chronic Obstr Pulm Dis. 2019; 6(5): 400-413. doi: http://doi.org/10.15326/jcopdf.6.5.2019.0150
Online Supplemental Material: Read Online Supplemental Material (236KB)
Background
Chronic obstructive pulmonary disease (COPD) is a heterogeneous disorder.1 Prior work clustered groups of individuals based on clinical features (e.g., ‘pink puffers’ and ‘blue bloaters’ being the classic example of distinct subtypes of COPD patients). Clustering techniques have used morphologic measures from chest computed tomography (CT)2-4 ; however, specific clinical disease clusters have been only modestly reproducible across multiple cohorts.5 Global initiative for chronic Obstructive Lung Disease (GOLD) criteria classify individuals as having COPD based on physiologic criteria of obstruction (forced expiratory volume in 1 second [FEV1] to forced vital capacity [FVC] ratio) and severity (FEV1 percent[%] predicted)6 and has been extended to include symptoms,7 but it does not include individuals with preserved ratio-impaired spirometry (PRISm) physiology (low FEV1 with a normal FEV1/FVC ratio). The Body mass index-Obstruction-Dyspnea-Exercise-capacity (BODE) index is designed to identify individuals with COPD at increased risk of mortality.8 Identifying COPD subtypes that integrate pulmonary morphologic abnormalities with associated pulmonary dysfunction and risk of mortality may provide insights into potentially modifiable disease pathways and protein biomarkers of disease.
Our proposed approach for understanding disease heterogeneity is to construct continuous disease axes that characterize different underlying pathophysiologic disease processes in COPD. These disease axes were built from unsupervised factor analysis of chest CT and pulmonary functions variables.9 Two multidimensional factors were related to reduced pulmonary function and were labeled the emphysema-predominant axis because of its strong correlation with low attenuation measures on CT and the airway-predominant axis because of its correlation with CT measures of airway-wall thickness.
In this current manuscript we risk-stratify individuals based on marked increased mortality associated with the highest 2 deciles of the 2 pulmonary disease axes. This provides an unsupervised COPD subtype classification scheme that incorporates CT morphologic differences with pulmonary function and that identifies individuals with greater risk for mortality. These COPD subtypes identify high-risk groups of individuals characterized by the underlying severity of disease processes that may provide targets for interventions to reduce pulmonary function decline and mortality.
Methods
COPDGene® Study
The COPD Genetic Epidemiology study (COPDGene®) (www.copdgene.org) is a multicenter observational study designed to identify genetic and epidemiologic factors associated with the development of COPD and to characterize the disease process using pulmonary function tests and volumetric CT scans.10 The COPDGene® study recruited 10,192 non-Hispanic whites and African Americans aged 45-80 years at 21 clinical centers across the United States. All were current and former smokers with at least a 10 pack years of smoking history. The COPDGene® study was approved by the institutional review board at each clinical center, and all participants provided written informed consent. All protocols were approved by the institutional review boards at National Jewish Health and the University of Colorado Denver (COMIRB). Individuals underwent detailed baseline characterization, including demographics, anthropometrics, respiratory symptoms, medical and smoking history, pre- and post-bronchodilator spirometry as well as 6-minute walk distance testing according to American Thoracic Society standards.11,12 Inspiratory and expiratory CT scans were done using a standardized protocol.10 Quantification of airway wall thickness, emphysema and gas trapping was performed by Thirona (Thirona, The Netherlands). Enrollment in Phase 1 of the COPDGene® study took place between 2008 and 2011, and participants were prospectively followed at 6-month intervals by telephone and web-based inquiry as part of the longitudinal follow-up (LFU) program to determine mortality, comorbid disease events and disease status.13
Height (meters) and weight (kilograms) measurements were used to calculate body mass index (BMI)(kg/m2). BMI was categorized as < 20, 20–25, and > 25. Hypertension was defined as participants who answered “Yes” on the medical history questionnaire as having been told by a physician that they have high blood pressure. Cardiovascular disease (CVD) was defined as answering “Yes” to any of the following conditions: heart attack, coronary artery bypass graft, angioplasty, congestive heart failure, or coronary artery disease, peripheral vascular disease, stroke or transient ischemic attack. Body mass index, airflow Obstruction (from FEV1), Dyspnea (from modified Medical Research Council [mMRC] scale), and Exercise capacity (from the 6-minute walk distance test) were used to calculate the multidimensional BODE index which has been shown to be a predictor of respiratory mortality.8 Current smoking status and pack years of smoking were determined by questionnaire. Classic COPD was grouped as spirometric stages 1–4 based on GOLD guidelines.14 Participants without spirometric evidence of airflow obstruction based on population-defined normal boundaries (FEV1/FVC ≥ 0.70 and FEV1 ≥ 80% predicted) were classified as GOLD 0.15 Participants with FEV1/FVC ≥ 0.70 and FEV1 < 80% predicted were classified as preserved ratio-impaired spirometry (PRISm).16
Biomarker Measurement
Fibrinogen, C-reactive protein (CRP), surfactant protein D (SP-D), soluble receptor for advanced glycation endproducts (sRAGE), and clara cell secretory protein (CC16) were measured in the stored plasma of a subset of participants from COPDGene® using standard immunoassays.17 For these analyses, 1275 individuals had available biomarker data. Biomarker values were log transformed for statistical testing due to non-normality.
Mortality Ascertainment
Vital status (mortality assessed through January 31, 2018) was determined through ongoing participant tracking and the COPDGene® LFU program. For a subset of the cohort with available social security numbers the assessment of vital status was augmented by searching the Social Security Death Index (SSDI). Results of all death tracking were aggregated centrally. Deaths ascertained only from the SSDI were back censored 3 months to account for the expected lag time between a death and its reporting in the SSDI. Participant follow-up time was the time between their baseline study visit and identified death or most recent active LFU participation.
Death adjudication: A committee of 6 physicians reviewed available information about cause of death including death certificate, informant interview, and medical records. Two reviewers evaluated and classified each death and a single primary cause of death was determined by the committee using modified TORCH criteria.18 Eighty-four percent of the deaths were adjudicated, and these were classified into the following categories: respiratory, cardiovascular, cancer, or other (e.g., accidental). If a probable cause of death could not be adjudicated, the death was classified as unknown.
Identification of High-Risk Subtypes Based on Mortality in the Airway-Predominant and Emphysema-Predominant Axes
Continuous airway-predominant and emphysema-predominant axes were built from unsupervised factor analysis of 26 chest CT (including measures of emphysema and airways) and pulmonary function variables (including FEV1 and FEV1/FVC).9 Factor analysis uses the correlation between measures to aggregate variables into a reduced number of “factors”. Using this method, we previously found 5 disease factors and labelled them based on their correlations: emphysema-predominant, airway-predominant, gas trapping, CT intensity variability axis, and the total lung capacity and functional residual capacity axis. The emphysema-predominant and airway-predominant axes were associated with reduced pulmonary function and with increased mortality and are the 2 focused on within these analyses. The correlation (factor loading scores) for each variable for the airway-predominant and emphysema-predominant axes are shown in Supplementary Figure S1. Note that the correlations for low attenuation measures on inspiration CT are high on the emphysema-predominant axis. Measures of airway wall thickness (wall area % [WA%] for segmental airways) are correlated with the airway-predominant axis. Pulmonary function is partitioned between these 2 disease axes with FEV1/FVC more strongly correlated with the emphysema-predominant axis and FEV1 % predicted more strongly correlated with the airway-predominant axis.
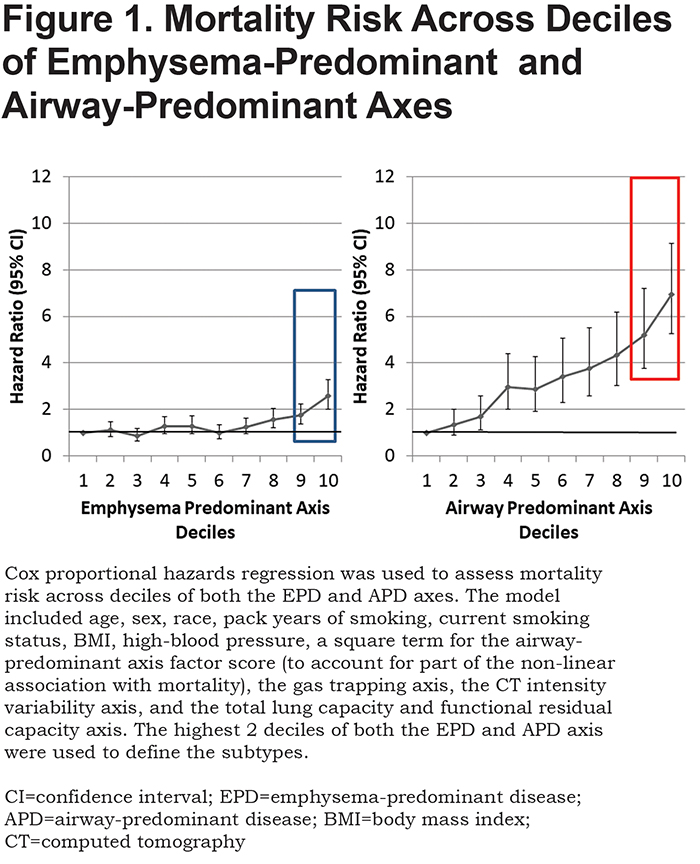
Both the emphysema-predominant and airway-predominant axes are associated with mortality, and this association remained after additionally controlling for FEV1 and FEV1/FVC. However, this association was complex.9 To account for the non-linear association with mortality that was observed in our previous work9 and to determine if the association remained significant after adjustment for additional covariates, a Cox proportional hazards regression was used to assess mortality risk across deciles of both the emphysema-predominant and airway-predominant axes. The model included age, sex, race, pack years of smoking, current smoking status, BMI, high-blood pressure, a square term for the airway-predominant axis factor score (to account for part of the non-linear association with mortality), the gas trapping axis, the CT intensity variability axis, and the total lung capacity and functional residual capacity axis. Inflection points for mortality across these disease axes from Cox proportional hazards models defined high-risk subtypes (Figure 1). Since all 8157 participants are represented on both the airway-predominant and emphysema-predominant axes, the overall mortality is identical. The airway-predominant axis is more robust in characterizing mortality risk, with marked difference between mortality in the lowest 2 deciles compared to the highest 2 deciles.
Statistical Analyses
Statistical analyses were performed using SAS 9.4 (SAS Institute, Cary, North Carolina). P-values less than 0.05 were considered statistically significant. Data are presented as means (standard deviation[SD]), percentages, or hazard ratios (HR) and 95% confidence intervals (CI) where appropriate. Baseline demographic and clinical characteristics between groups were compared with the Chi square test for categorical variables and one-way analysis of variance (ANOVA) for continuous variables. Associations between the biomarkers and high-risk pulmonary subtypes were assessed by testing for differences in the least squares means for each subtype compared to those without a high-risk subtype.
The proportionality assumption was not violated for any of the Cox proportional hazard models. All Cox proportional hazards regression models included the following baseline covariates: age, race, sex, current smoking status, pack years of smoking, BMI category, high blood pressure and diabetes status.
In evaluating the independent effect of the high-risk pulmonary subtypes on all-cause mortality, models included the baseline covariates with additional models adjusted for GOLD spirometry stage and BODE category.
Cause-specific mortality was assessed by Cox proportional hazards with competing risks. Cardiovascular, respiratory and cancer mortality were modeled separately for associations with high-risk pulmonary subtypes that included baseline covariates plus self-reported CVD.
Results
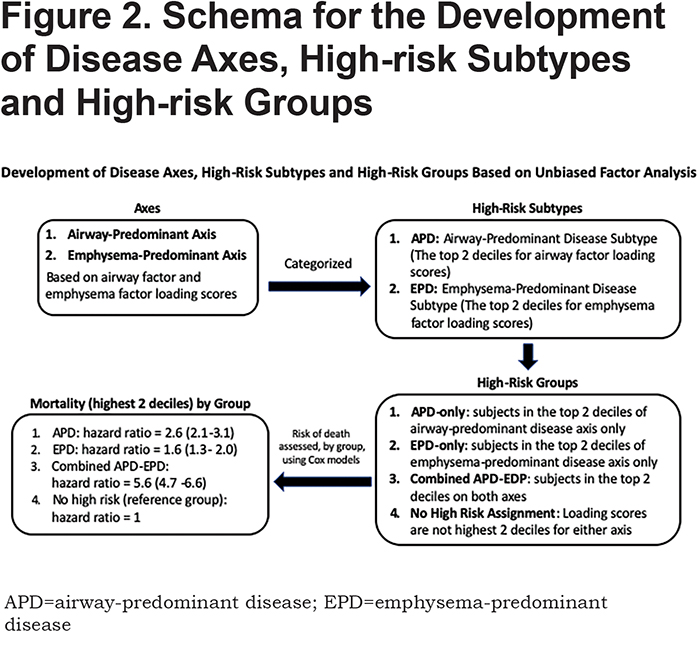
In the 8157 individuals with complete dase axes data, we examined deciles of both the airway-predominant axis and the emphysema-predominant axis for risk stratification for all-cause mortality. High-risk subtypes were defined based on high all-cause mortality rates in the upper 2 deciles of both the emphysema-predominant axis (decile 9: HR 1.74; 95% CI 1.36–2.24; decile 10: HR 2.57; 95% CI 2.00–3.29) and airway-predominant axis (decile 9: HR 5.20; 95% CI 3.75–7.20; decile 10: HR 6.95; 95% CI 5.27–9.15) (Figure 1). Using these inflection points the upper 2 deciles on the 2 axes defined 2 high-risk subtypes: an airway-predominant disease high-risk subtype (APD) and an emphysema-predominant disease high-risk subtype (EPD) (Figure 2). These 2 high-risk subtypes were then divided into 3 high-risk groups: APD-only (n=1007 participants who are in the top 2 deciles of the airway-predominant axis and who are not in the top 2 deciles of the emphysema-predominant axis);EPD-only (n=1006 participants who are in the top 2 deciles of the emphysema-predominant axis and not in the top 2 deciles of the airway-predominant axis), and combined APD-EPD (n=625 participants who have characteristics placing them in the upper 2 deciles of both the airway-predominant and emphysema-predominant axes).
APD-only group individuals were on average younger, more likely to be male, a current smoker with more pack years of smoking, and to have a BMI > 25 (Table 1). These participants had lower FEV1 % predicted, representing a substantial number of the individuals in PRISm (27.4% of individuals in APD-only) and were distributed across GOLD spirometry stage 2 (25.1%), stage 3 (37.8%), and stage 4 (9.1%). No individuals in the APD-only group were in GOLD stage 1. They had striking increases in airway wall thickness (WA% = 60.0%) but minimal emphysema (3.6%).
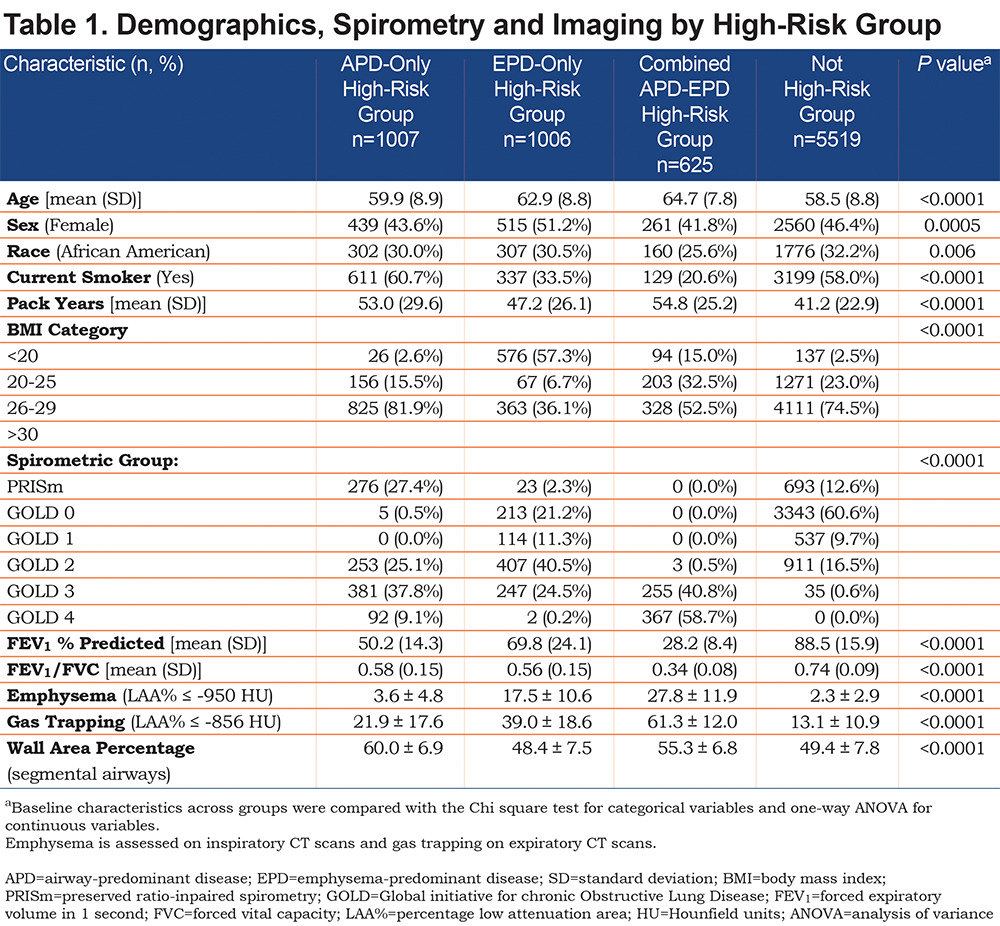
The EPD-only group included individuals in GOLD stage 0 (21.2% of EPD), as well as GOLD spirometry stages 1 (11.3%), 2 (40.5%) and 3 (24.5%), with few in GOLD stage 4 (0.2%) (Table 1). Only 2.3% of individuals in the EPD-only group were in PRISm. The EPD-only group unsurprisingly had greater emphysema (17.5%) and less airway wall thickness (WA% = 48.4%) and 57% of its participants had a BMI < 20. Interestingly, there were 946 individuals in GOLD stage 2 and stage 3 that were not in a high-risk group based on their factor scores.
The combined APD-EPD group was more likely to be older and non-Hispanic white, with the highest average pack years, but were least likely to be a current smoker (Table 1). These individuals in the combined APD-EPD group appeared to have late-stage disease with low pulmonary function: FEV1/FVC (0.34%) and FEV1 % predicted (28.2%) and consisting of individuals in GOLD spirometry stages 3 and 4 only. Imaging findings demonstrated both increased emphysema (27.8%) and airway wall thickening (WA% = 55.3%).
All 3 groups had shorter 6-minute walk distance, increased BODE, St George’s Respiratory Questionnaire (SGRQ) and dyspnea scores, and increased exacerbation frequency and increased number of severe exacerbations (Table 2). The EPD-only group appeared on average to have the least severe of these clinical characteristics while the combined APD-EPD group was the most severe in these measures. The APD-only group had the highest proportion of individuals with cardiometabolic features, including substantially more CVD, diabetes, hypertension, and high cholesterol.
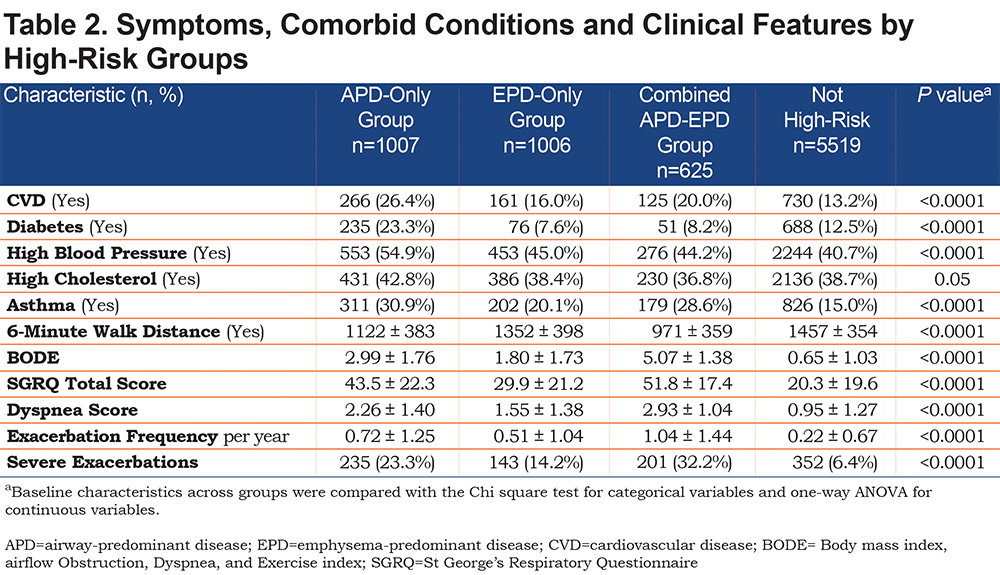
Figure 3 shows the distribution of the high-risk individuals by group in terms of pulmonary function. The APD-only high-risk participants and the EPD-only high-risk participants have markedly different distributions when graphed as a function of FEV1 % predicted and FEV1/FVC. The EPD-only group (blue) distributes strongly in the GOLD stage 0 quadrant and distributes as commonly expected in classic descriptions of COPD in GOLD stages 1, 2 and 3. The APD-only group (red), in contrast, distributes strongly in the PRISm quadrant and then through GOLD stages 2, 3 and 4 with minimal overlap with the EPD-only group. The combined APD-EPD group distributes primarily in GOLD stages 3 and 4. Participants without increased risk characteristics based on the factor scores are shown in grey on Figure 3 and are concentrated in the GOLD stage 0 group but are also present in the GOLD stages 1 and 2 and PRISm categories.

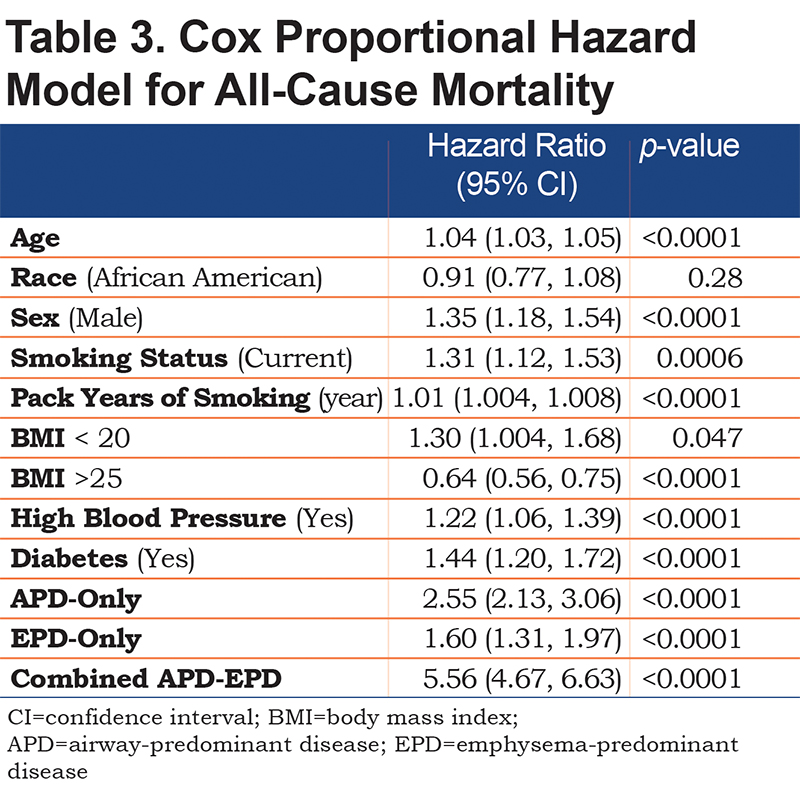
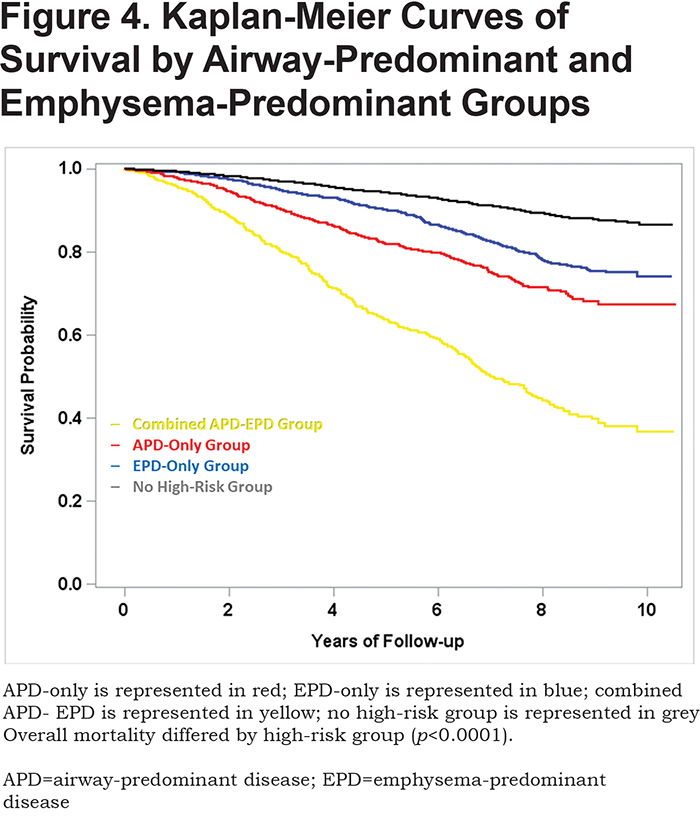
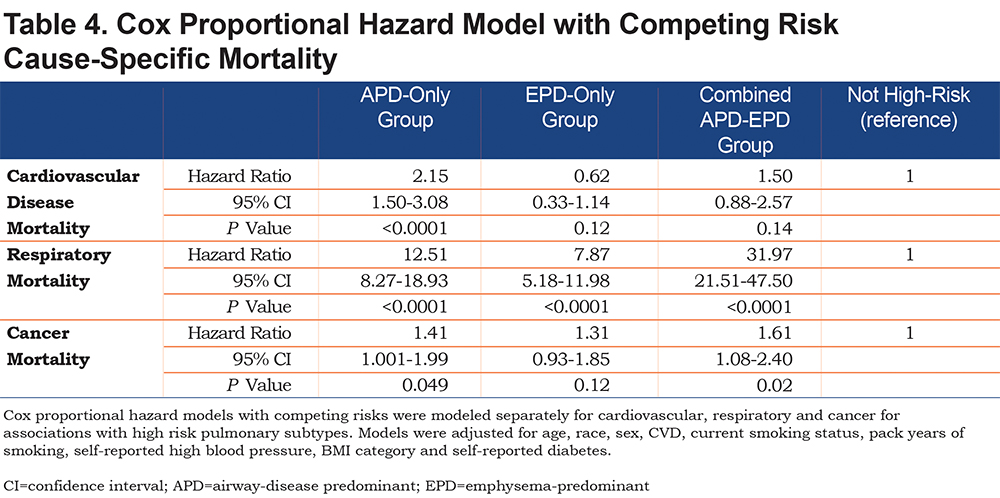
Mortality risk for the airway-predominant axis and the emphysema-predominant axis was determined using the Cox proportional hazard model (Table 3). Kaplan-Meier curves (Figure 4) show the overall mortality experience for the cohort and demonstrate substantial differences related to the 3 high-risk groups. Figure 5 illustrates cause-specific death showing the distribution based on pulmonary function for APD-only, EPD-only, combined APD-EPD and no high-risk subtype. Total mortality was 53.6% in the combined APD-EPD group, 26.3% in the APD-only group, 21.1% in the EPD-only group, compared to 10.1% in those not in a high-risk group. Higher mortality was observed across all levels of pulmonary function and GOLD stages within the APD-only and EPD-only groups. The most common cause of death within all groups was respiratory death, accounting for 39% of deaths in the APD-only group, 47% in the EPD-only group, and 67% in the combined APD-EPD group, compared to only 8% in the not high-risk group. This was statistically significant after accounting for competing risks (Table 4). Notably, cardiovascular disease accounted for 24% of deaths in the APD-only group, a similar proportion to that seen in the not high-risk reference group, but with total deaths lower in the reference group, the enhanced risk for cardiovascular death in the APD-only group was statistically significant after accounting for competing risks (Table 4). Cardiovascular-related deaths occurred in only 7%-8% of deaths in the other pulmonary subtypes (Figure 5).
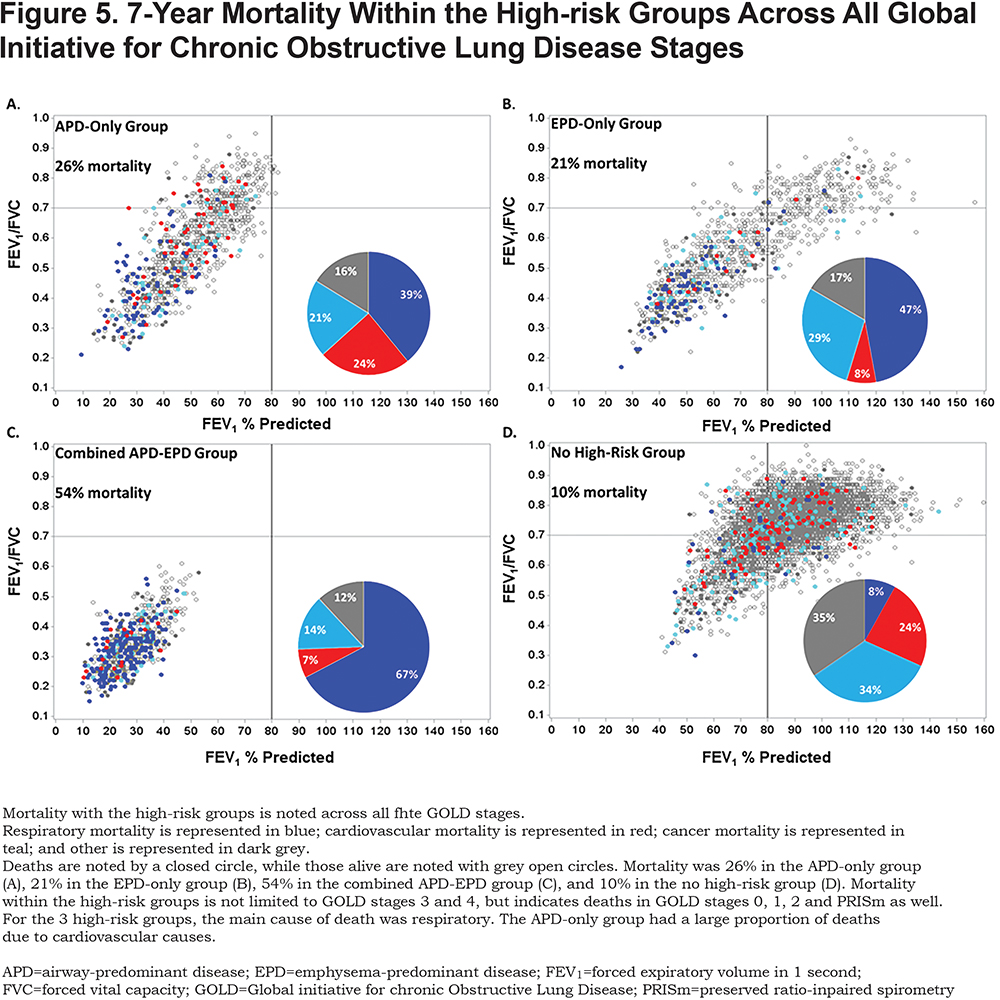
In addition to these differences in mortality by group, there is a distinct difference in the pattern of mortality for the APD-only versus the EPD-only high-risk groups. As seen in Figure 5, mortality within the APD-only high-risk group is distributed throughout its range of pulmonary function including those in PRISm. Mortality for the EPD-only group is primarily in GOLD stage 2 and greater.
In this cohort, 1371 deaths occurred over a mean follow-up time of 7.07 years representing 57,694 person years of follow-up. All 3 of the high-risk groups were independently associated with mortality (Table 3, which uses a multivariable model adjusting for each of the covariates listed). In addition, when using the same multivariable model and additionally adjusting for GOLD spirometry stage, each of the 3 high-risks groups also remained associated with mortality (combined APD-EPD group [HR 2.98; 95% CI 2.31–3.84]; APD-only group [HR 1.78; 95% CI 1.44–2.20] and EPD-only group [HR 1.23; 95% CI 0.99–1.53]). Finally, the associations of the groups with mortality also remained significant after additional adjustment for BODE in the multivariable model (combined APD-EPD group [HR 2.17; 95% CI 1.68–2.80]; APD-only group [HR 1.42; 95% CI 1.14–1.78] and EPD-only group [HR 1.30; 95% CI 1.04–1.62]).
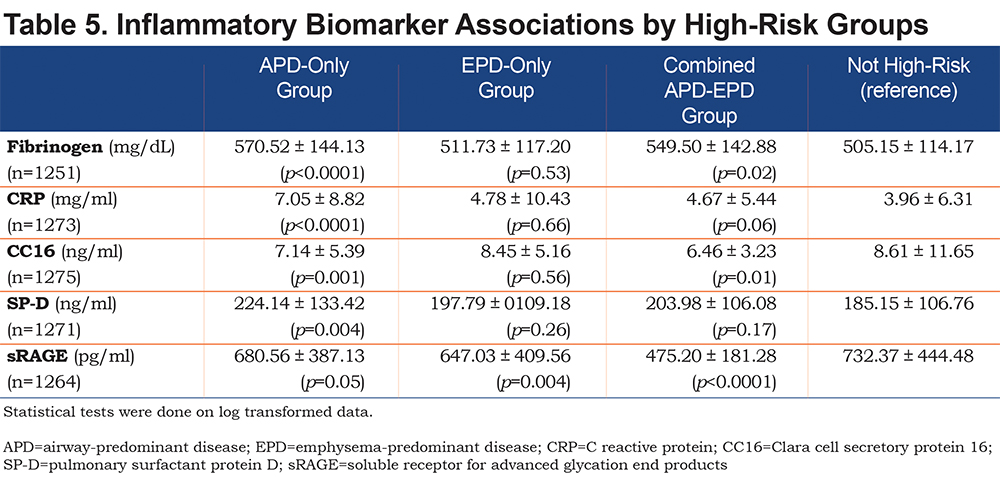
Biomarkers were differentially associated with the high-risk groups in a subset of the COPDGene® study. In this pilot study individuals in the EPD-only group and the combined APD-EPD group had lower levels of sRAGE. Individuals in the APD-only group had higher levels of CRP and SP-D. Individuals in the APD-only and combined APD-EPD groups had higher fibrinogen levels but lower CC16 levels (Table 5).
Discussion
We defined high-risk subtypes using the top 2 deciles of the emphysema-predominant and airway-predominant axes in relationship to all-cause mortality. Unlike the GOLD classification criteria, which are based on a composite of pulmonary function and symptoms, these subtypes were not chosen based on clustering of individuals with COPD.6,7,14 The subtypes we describe are based upon the continuum of the underlying pathophysiologic characteristics and indicate different disease processes that portend different clinical characteristics, all-cause mortality risk and cause-specific mortality risk, and include individuals not meeting current COPD diagnosis criteria. These subtypes show unique distributions across pulmonary function, as well as distinct patterns of all-cause and cause-specific mortality. We hypothesize that these subtypes will be important to a more complete understanding of COPD as a syndrome19,20 and that they suggest new ways to identify individuals early in the disease process, determine effective treatment in a clinical or research setting, and assist in the development of novel therapeutics.
The association between the high-risk groups and mortality was significant after accounting for pulmonary function. Interestingly, within both the APD-only and EPD-only groups, mortality was observed across all levels of pulmonary function, including those in GOLD stage 0 and PRISm. Coupled with the Cox proportional hazards models, this indicates that increased mortality is observed not only in those traditionally identified as having poor health due to low pulmonary function and worse symptoms (i.e., GOLD stages 3 and 4) but also in people who would be considered to have no COPD by current definition (GOLD). The average yearly probability of death observed in participants not associated with a high-risk group is similar to that seen in current and former smokers > 45 years of age in the United States,21 indicating that the individuals in the COPDGene® cohort do not have a higher baseline rate of mortality due to age and smoking history.
The combined APD-EPD group represents a well-recognized subset of individuals in clinical practice and in the emergency department. These individuals are mainly in GOLD spirometry stages 3 and 4 (99.5%) and have frequent and severe exacerbations. The combined APD-EPD individuals are older and have the highest number of pack years of smoking. They are also the least likely to be current smokers, perhaps due to clinical complications, poor health and physician recommendations which resulted in these participants quitting smoking. The 7-year mortality in this late-stage disease was 54.0% mortality.
In all high-risk groups, some of the increased association with mortality was independent of pulmonary function and GOLD stage. Further studies will be needed to determine if these findings are primarily due to a higher rate of cardiovascular mortality. The inflammatory biomarkers assessed in this study, both alone and in combination, were associated with lower pulmonary function, increased emphysema, and progression of these measures.17 The inflammatory marker CRP was most strongly associated with the APD-only group as was SP-D. sRAGE was more closely related to the EPD groups (both EPD-only and combined APD-EPD groups). These preliminary biomarker data are consistent with the hypothesis that the APD-only and EPD-only groups represent different pathophysiologic processes and suggest the need for different approaches to effective clinical intervention or prevention.
The APD-only group experienced 26% mortality, 2.6 times the mortality in the not high-risk group. These individuals had the most pack years of smoking history and, similar to those not in a high-risk group, were most likely to be a current smoker. The APD-only group represents the highest proportion of individuals who are overweight (BMI > 25). In addition, these individuals have more cardiometabolic comorbidities, with the highest proportion of self-reported cardiovascular disease, diabetes, hypertension, high cholesterol, and physician-diagnosed asthma than the other high-risk subtypes. Some of these findings may be due to the increased proportion of males and younger age compared to the other high-risk subtypes. However, 27.4% of individuals in the APD-only group are classified as in the PRISm category. PRISm individuals within COPDGene®, have been described as having more cardiometabolic risk factors and an increased smoking history,16 as well as increased mortality.22 Nevertheless, those in the APD-only group are not limited to PRISm, but are rather distributed across GOLD spirometry stages 2, 3, and 4 as well. Interestingly, almost all individuals within the APD-only group had abnormal spirometry, with a lower mean FEV1 % predicted than the emphysema subtype. The APD-only group and, to some extent, the combined APD-EPD group were associated with biomarkers associated with more inflammatory processes. While inflamed airways may be an underlying cause of this association, many of these biomarkers, particularly fibrinogen and CCP, are also associated with multiple inflammatory processes,23 including cardiovascular disease, which is highly prevalent in the APD-only group. These results indicate that an inflammatory process is occurring in those with the APD-only group.
The EPD-only group experienced 2 times the mortality (21.0%) of those with no high-risk. Individuals in this group were most likely to have a BMI < 20, indicating that cachexia is associated with this subtype. Although slightly older than those in the APD-only group, the EPD-only group had fewer pack years of smoking, and were less likely to be current smokers. Remarkably, 21.2% of the EPD-only group are classified as having GOLD stage 0 physiology, suggesting that some participants with high-risk of mortality related to emphysema would not generate clinical concern based on pulmonary function testing alone. This is in agreement with previous work that found that some individuals with GOLD stage 0 physiology have significant disease.15,24 These observations are consistent with population-based studies that show an overall effect of quantitative emphysema (lung density) on mortality.25 A significant proportion of individuals in our EPD-only group would be classified by GOLD spirometry criteria as being in stages 2 and 3. Although clinical measures in the EPD-only group were worse than those with no high-risk group, in general, participants in the EPD-only group had better pulmonary function, better quality of life measures, and fewer exacerbations compared to the other high-risk groups.
All of the high-risk groups had an increased BODE score compared to those not in a high-risk group. As expected, the combined APD-EPD group had the highest BODE score due to the decreased pulmonary function and significant dyspnea. In all high-risk groups, an association with higher mortality remained after adjustment for BODE category. The BODE index was designed as a predictor of mortality in individuals diagnosed with COPD, and relies on clinical symptoms already present. The utility of the BODE index in individuals without COPD defined by GOLD spirometry stage is unknown. These high-risk groups were defined based on quantitative CT metrics and pulmonary function tests, and include individuals across a range of pulmonary function and clinical symptoms, including those who do not have COPD by current GOLD spirometry stage. This indicates that an increased risk of respiratory death is found in individuals not diagnosed with COPD by current definition, and suggests that the definition of COPD needs expanding.
All high-risk groups were associated with an extremely elevated risk of respiratory mortality compared to those not in a pulmonary subtype, with adjusted mortality hazard ratios ranging between 8 and 32. This increased risk of respiratory mortality is likely influenced by the individuals with lower pulmonary function and more severe disease within these groups. All high-risk groups had increased risk of death from cancer, which was statistically significant for the APD-only group and the combined APD-EPD group. This is likely due to the known increased risk of cancer attributable to smoking, particularly long-term, heavy smoking as represented by the COPDGene® cohort.
Strengths of this study include the use of a large, well-characterized cohort with long-term mortality follow-up. All participants had extensive smoking exposure, and the study design increased the portion of severe COPD cases. The individuals in the COPDGene® cohort had a mean smoking history of 41.2 ± 22.9 pack years and this work is best generalized to individuals with a substantial smoking history.
This analysis of COPD disease axes requires both pulmonary function testing and inspiratory and expiratory chest CT. Novel methods for quantifying both inspiratory and expiratory chest CT images are resulting in major technical advancements in assessing morphologic differences related to underlying disease processes. As new algorithms for quantifying CT images are developed we anticipate that it will enable greater precision in the assessment of airway-predominant and emphysema-predominant disease.
These high-risk groups identified by an unbiased factor analysis identify different important disease pathways in COPD. These subtypes indicate unique targets for treatment and the need to identify individuals at risk before they show severe decreases in pulmonary function.
Acknowledgements
Author Contributions
KAY, GLK, JEH, SML and JDC designed the study. All others participated in data acquisition. KAY, GLK, JEH, SML and JDC participated in data analysis. All authors assisted with data interpretation. All authors assisted with the development of the manuscript and gave final approval for publication. KAY and GLK take responsibility for the integrity of the data and the accuracy of the data analysis.
Declaration of Interest
MHC and EKS have received grant support from GlaxoSmithKline. RPB has received consulting fees from Boehringer Ingelheim, AstraZeneca, and GlaxoSmithKline. All other authors declare they have no conflicting interests.