Running Head: Hepatocyte Senescence and Chronic Liver Disease
Funding Support: E.M. is funded by the Alpha-1 Foundation, the Pasteur Institute Cenci-Bolognetti Foundation and by Sapienza Research Grants
Date of acceptance: February 13, 2020
Abbreviations: alpha-1 antitrypsin deficiency, AATD; alpha-1 antitrypsin, AAT; serine protease inhibitor, serpin; endoplasmic reticulum ER; diastase positive periodic acid-Schiff, DPAS; hepatocellular carcinoma, HCC; qualitative fluorescence in situ hybridization, Q-FISH; Minichromosome Maintenance Complex Component 2, Mcm-2; diaminobenzidine, DAB; diamidino-2-phenylindole, DAPI; analysis of variance, ANOVA; receiver operating characteristic, ROC; confidence interval, CI
Citation: Mela M, Smeeton W, Davies SE, et al. The alpha-1 antitrypsin polymer load correlates with hepatocyte senescence, fibrosis stage and liver-related mortality. Chronic Obstr Pulm Dis. 2020; 7(3): 151-162. doi: http://doi.org/10.15326/jcopdf.7.3.2019.0158
Online Supplemental Material: Read Online Supplemental Material (637KB)
Introduction
Alpha-1 antitrypsin (AAT), a 394-amino-acid acute phase glycoprotein, is the prototypic member of the serine protease inhibitor (serpin) superfamily.1 The prevalence of alpha-1 antitrypsin deficiency (AATD) varies markedly across nations, affecting 1 in 2000 to 3000 live births in people of European ancestry.2
The SERPNA1 gene encoding AAT is highly polymorphic with over 100 alleles. AAT variants have been categorized as normal (M), deficient where S and Z are the most common mutations and dysfunctional or null alleles.2,3 The alleles of SERPINA1 are co-dominant, so individuals heterozygous for the Z allele and wild type M allele (MZ) have plasma levels 50% - 60% of normal (MM), while individuals homozygous for the Z allele (ZZ) have plasma levels 10% - 15% of normal.4
The majority of synthesized Z AAT is retained within the endoplasmic reticulum (ER) of hepatocytes and degraded subsequently. However, a proportion of AAT forms polymers within the ER lumen and these accumulate as inclusion bodies demonstrable histologically in routine clinical practice as diastase resistant, periodic acid-Schiff positive intracytoplasmic granules (DPAS-positive), found most often within periportal hepatocytes.
Accumulation of Z AAT, measured as DPAS-positive globules within the ER, was associated with a global increase in hepatocyte proliferation in a transgenic murine model of AATD5; however, increased proliferation was restricted to those hepatocytes negative for DPAS-positive AAT globules. One plausible explanation is that hepatocellular injury caused by DPAS-positive globule accumulation leads to a functional deficit stimulating compensatory hepatocyte proliferation and that globule-devoid hepatocytes are more responsive than globule-positive cells to regenerative stimuli.
The variable clinical course of patients with homozygous AATD is unexplained; some present in infancy or childhood with “neonatal hepatitis”6,7 while adults with AATD often develop cirrhosis without a preceding history of childhood liver disease.8 A Canadian series of adults with homozygous AATD indicated an overall prevalence of chronic liver disease close to 5%, reaching 15% in the sixth decade.9 Although in most cases the fibrosis and low-grade inflammation associated with AATD progress slowly, this condition predisposes to dysplasia, 8% of affected patients develop hepatocellular carcinoma (HCC)10 and 9% of affected adults die within 2years of the diagnosis of cirrhosis.11,12
It is less clear if heterozygous carriers of the mutant Z SERPINA1 allele are at risk of liver injury13; recent studies reveal that heterozygotes have an increased risk of progressive liver disease and are over-represented in series of patients undergoing liver transplantation.14,15,16 These data are consistent with both the heterozygous state as a single risk factor for liver disease or acting synergistically, increasing the risk of alcohol-related or non-alcohol-related fatty liver disease.17 It is not always clear at presentation which patients face an increased risk of liver-related complications and liver-related mortality.
Hepatocyte cell cycle arrest, accelerated aging and senescence have been implicated in the pathogenesis of common liver disorders including chronic viral hepatitis and alcohol-related and non-alcohol related fatty liver disease18-21 and correlate strongly with hepatic fibrosis and liver-related mortality. Thus, we investigated whether hepatocyte accumulation of AAT polymers (the polymer load) was related to the number of mutant alleles, fibrosis stage, the long-term clinical outcome and, in addition, whether there was a direct pathogenic relationship between AAT polymers and arrested cell cycle progression, accelerated aging and senescence as an underlying pathogenic mechanism.
Patients and Methods
Patient Selection
Patients with AATD were identified as part of a service review of unselected, new adult hepatology referrals attending Addenbrooke’s Hospital over a 10-year period. The center has a long-standing interest in respiratory disease related to AATD and provides a regional liver transplant service.
Patients with AATD were identified by routine biochemistry, review of clinic notes and liver biopsy. Within the histopathology department, all liver sections are stained routinely with DPAS to determine if AAT inclusions are present. The AAT phenotype was assessed by isoelectric focusing wheneverdeficiency was suspected because of a low or low normal plasma level (< 1.1 g/L, normal range above 0.8 g/L) or because of compatible liver biopsy findings, irrespective of the serum level. Genotyping was undertaken when isoelectric focusing was inconclusive.
Patients were followed to the censor point providing 5–15 years follow up, or to a defined clinical outcome including the need for liver transplantation, evolution to hepatocellular carcinoma or death from liver disease.
Control Liver Tissue
Fifteen formalin-fixed, paraffin-embedded liver biopsy specimens obtained within 1 month after transplantation with features of a normal regenerative response on haematoxylin and eosin stained sections following ischaemia-reperfusion injury served as positive control tissue for cell cycle phase markers. Ten formalin-fixed, paraffin-embedded liver specimens from patients with normal liver function tests who had undergone partial hepatectomy for colorectal cancer metastases served as “normal liver” (negative control tissue) for cell cycle phase markers. These specimens were tissue blocks distant to metastases and selected because they demonstrated normal histology, without evidence of PAS-positive granules or neoplastic cells.
Liver sections from 55 archived formalin-fixed paraffin-embedded liver needle biopsy specimens acquired from age-matched donor livers at the time of liver transplantation (time-zero biopsies) served as healthy controls for qualitative fluorescence in situ hybridization (Q-FISH) experiments as described previously.22 These sections were chosen to reflect normal liver on the basis of adequate length, no history of liver or senescence-related disease in the donor, a short medical illness preceding donor death, no or minimal reperfusion injury or steatosis at histological review and excellent graft function 1 year after transplantation.
Liver Histology
The biopsies were graded and staged according to a novel scoring system using a modified Ishak system for grading and staging of inflammation, fibrosis and steatosis if present. Histological indices of inflammatory activity (interface hepatitis, lobular inflammation, portal inflammation) and steatosis were each scored using a 5-point scale (0 - 4), while the severity of fibrosis was staged using a 7-point scale (0 absent to 6 cirrhosis). The presence of clear zone 3 pericellular fibrosis, ballooning regeneration or Mallory body formation was considered definite for steatohepatitis; changes falling short of this, in particular enlarged hepatocytes showing prominent cytoplasmic clumping, were considered borderline.
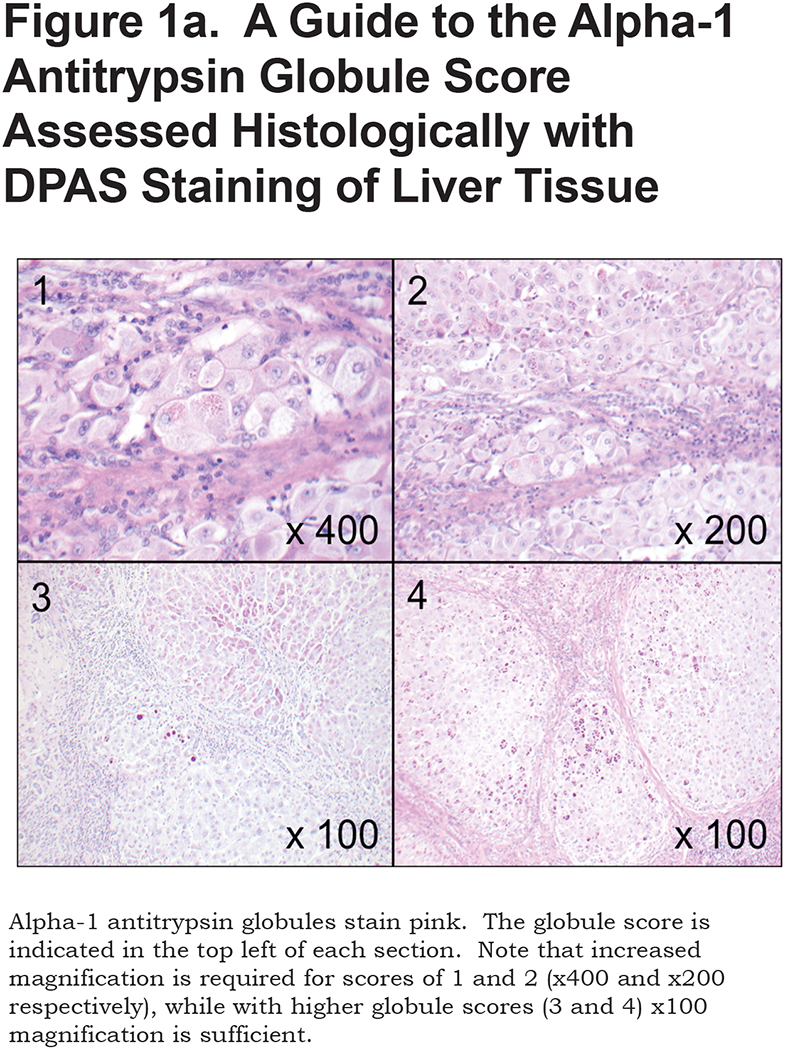
The extent of AAT accumulation was determined semi-quantitatively based on DPAS staining with a novel approach. See Figure 1a; section 1: represents patchy periportal deposition of small granules and globules; section 2: widespread small globules; section 3: widespread small granules with patchy large globules; section 4: ubiquitous small and large globules. Individual globules discernible at x40 magnification (approximate diameter 5µm) were considered large.
Immunohistochemistry
Archived formalin fixed, paraffin embedded 5µm thick liver sections were stained with 2C1 antibody, a conformation-specific monoclonal antibody developed to detect polymerized AAT with high specificity23 using a Leica Bond Bond-Max Autostainer. Sections were subjected to heat-induced antigen retrieval with epitope retrieval ER1 solution (Leica Biosystems) at 100°C for 20 minutes, then incubated with the 2C1 antibody for 20 minutes at a concentration of 1:50, then washed with Bond washing buffer (Leica Biosystems). After washing, slides were incubated with a secondary antibody (Bond Polymer Refine kit, Leica Biosystems) for 8 minutes at room temperature. Chromogenic detection of the antibody was achieved by incubation with 3,3’-diaminobenzidine for 10 minutes. The proportion of hepatocytes expressing 2C1 using image analysis (see below) served as an objective measure of the AAT polymer load. (Figure 1b).

Immunohistochemistry for cell cycle markers and immunofluorescence for hepatocytes was performed as described.19 Cell cycle phase markers included Minichromosome Maintenance Complex Component 2 (Mcm-2) (Abcam, ab109271), cyclin D1 (Abcam, IS083), cyclin A (Leicabiosystems NCL-CYCLINA), cyclin B1 (Leicabiosystems CYCLINB1) and PH3 (Upstate biotechnology 06-5700), representing different phases of the cell cycle (Mcm-2: cell cycle entry; cyclin D1: G1 phase; cyclin A: S phase; cyclin B1: G2 phase; PH3: transition from G2 through mitosis). Immunohistochemistry was also used to detect p21, a universal inhibitor of cyclin dependent kinases blocking cell cycle progression G1 as described previously.21
Qualitative Fluorescence In Situ Hybridization
Paraffin embedded sections de-paraffinized with xylene were hydrated through graded ethanol and placed in de-ionized water. Slides were heated at 97oC in sodium citrate buffer (pH 6.0) for 30 minutes to enhance target retrieval. Following cooling at room temperature for 20 minutes, slides were transferred to phosphate-buffered saline for 5 minutes before fixation in 4% (w/v) formaldehyde for 5 minutes at room temperature. Enzymatic unmasking was achieved with a porcine pepsin solution containing 1mg/ml pepsin (Sigma, Gillingham, United Kingdom) in an 0.84% (v/v) hydrochloric acid solution (pH 2.0) for 10 minutes at 37oC. Slides were rinsed in de-ionized water and 80µl hybridization mix added (75µl of 50µg /ml PNA Cy5-labelled-telomere specific probe TelC Cy5-oo- [CCCTAA] 3 PNA probe with >95% purity [Cambridge Research Biochemicals, Billingham, United Kingdom] with 45µl 1M Tris-Cl, pH 7.2, 321µl MgCl2 25mM MgCl2 9mM citric acid, 8.2mM NaH2PO4 pH 7.4, 2.6ml de-ionized formamide [Sigma, Gillingham, United Kingdom], 186µl 10% [w/v] blocking reagent [Roche, Welwyn Garden City, United Kingdom], 498µl of de-ionized water).
Hybridization was carried out at room temperature for 2 hours in the dark after de-naturation at 80oC. Slides were washed twice with wash solution A (70ml formamide, 1 ml 1M Tris-Cl pH 7.2, 45µl 10% [w/v] bovine serum albumin stock solution, 28ml de-ionized water) and 3 times with wash solution B (15ml 1 M Tris-Cl pH 7.2, 15ml 1.5M NaCl, 120µl Tween 20 [0.08% (v/v) final], 120ml de-ionized water). Slides were washed in Tris buffered saline and incubated at room temperature for 45 minutes with appropriate murine monoclonal antibody to distinguish intrahepatic cell lineages: 100µl primary antibody (Hepar1 1:100 DAKO clone OCH1E5) for hepatocytes. 2C1 antibody was diluted 1:50 in a citrate buffer. Each antibody was diluted in 1% (v/v) goat serum in Tris-buffered saline with 4’,6-diamidino-2-phenylindole (DAPI) 1:500 to identify cell nuclei (SIGMA, Gillingham, United Kingdom). All antibodies were titrated to their optimum concentration. Three 5-minute washes with Tris-buffered saline-Tween 20 were followed by incubation with 90µl Alexa Fluor® 488 donkey anti-mouse IgG (H+L) (1:100 in 1% v/v goat serum-Tris-buffered saline with DAPI 1:500; Invitrogen Ltd, Paisley, United Kingdom) for 30 minutes at room temperature. Slides underwent 3 further 5-minute washes with Tris-buffered saline-Tween 20 before dehydration using graded ethanols followed by air-drying at room temperature for 20 minutes. Finally, sections were mounted on a coverslip applied with neat fluorescent mounting media (DAKO, Ely, United Kingdom) for image analysis. A control sample was included with each run to ensure uniformity and reproducibility.
Fluorescent Microscopy Image Acquisition
Image acquisition was performed with an Olympus Scan^R high content screening fluorescence microscope. Forty-five photographs were taken per biopsy at x60 magnification and saved as a Z composite projection for further analysis. Images were acquired using Cy5 Z maximum fluorescence intensity and DAPI Z maximum fluorescence intensity to provide optimum detection and resolution of telomeres and nuclei respectively. Maximum telomere pixel intensity for each telomere in each cell was analyzed with ScanR analysis software.
Image Analysis
Images were analyzed using Scan^R Analysis software. Definitions were established for each cell lineage to enable accurate automated detection of nuclei and telomeres. Each included initial optimization of image processing with background correction filters set at 461nm emission for DAPI, 570nm for Cy3 and 670nmfor Cy5 to prevent artefact. Settings were maintained for analysis of data for each cell lineage on every liver section.
Telomere area was measured as the mean telomere area in pixels2 per nucleus for each cell lineage. The nuclear area and nuclear density for each cell lineage were measured by the mean DAPI staining pixels squared for each nucleus and the mean DAPI Z maximum fluorescence intensity, respectively.
Statistical Analysis
Statistical analyses were performed using GraphPad Prism Version 5 and SPSS v13. Data for cell cycle phase markers were analyzed using one-way analysis of variance (ANOVA). Correlations between fibrosis stage, p21, polymer load and DPAS expression were analyzed using the Spearman Rank coefficient. Clinical outcome data in relation to p21 and the AAT polymer load were analyzed by applying Kaplan-Maier curves. The receiver operating characteristic (ROC) was implemented to explore relevant cut offs for p21 and the AAT polymer load.
Results
Patient Cohort
By combining plasma AAT levels, AAT phenotype and liver biopsy, 92 patients of 1150 seen during the study period (8%) were shown to have AATD as the main or only cause of liver disease. Patients with investigations that suggested other primary causes of liver injury were excluded by appropriate investigations and histology.
Thirty patients were AATD homozygotes, (24 males) median age at presentation 55.5 years (34– 76). Sixty-two patients were heterozygous for an AATD-associated allele (41 males), median age at presentation 55 years (31–75).
Quantitation of Polymerized Alpha-1 Antitrypsin (Polymer Load)
The AAT polymer load was measured first with a semi-quantitative approach based on conventional DPAS using a novel scoring system and then more objectively with the monoclonal antibody 2C1 (Figures 1a & 1b). The latter allows every hepatocyte to be counted and then analyzed according to the presence or absence of immunofluorescence. It has much greater sensitivity, is time consuming and expensive but is more objective. However, the correlation between the 2 approaches was strong Spearman Rank ρ = 0.744, p < 0.0001.For subsequent analyses the figure derived using 2C1 has been used.
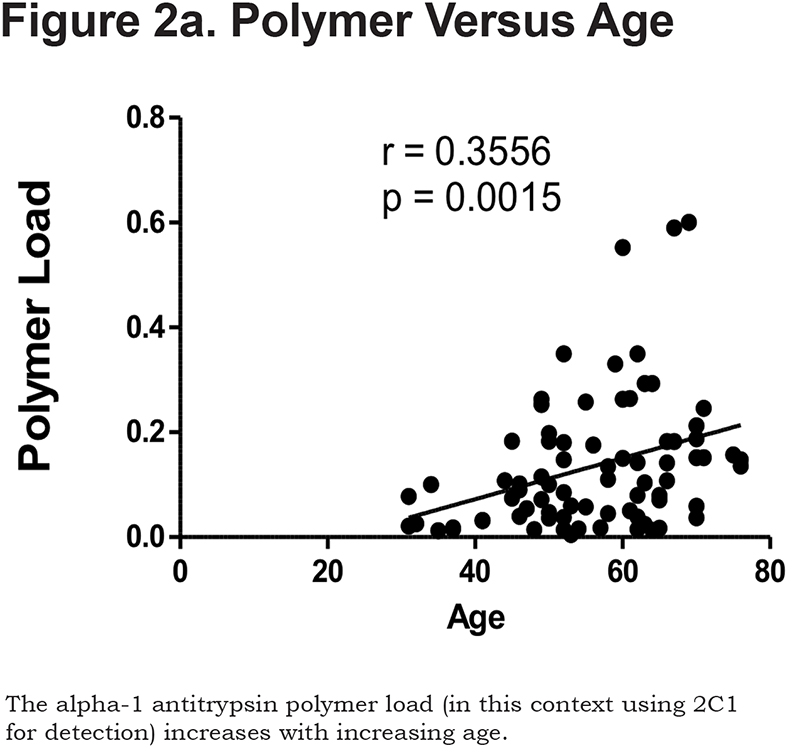
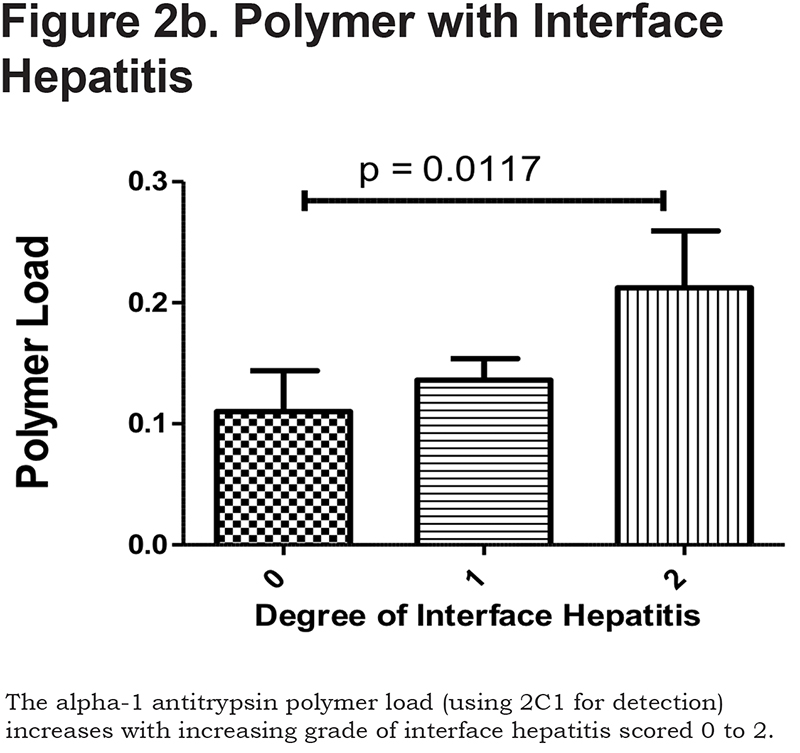
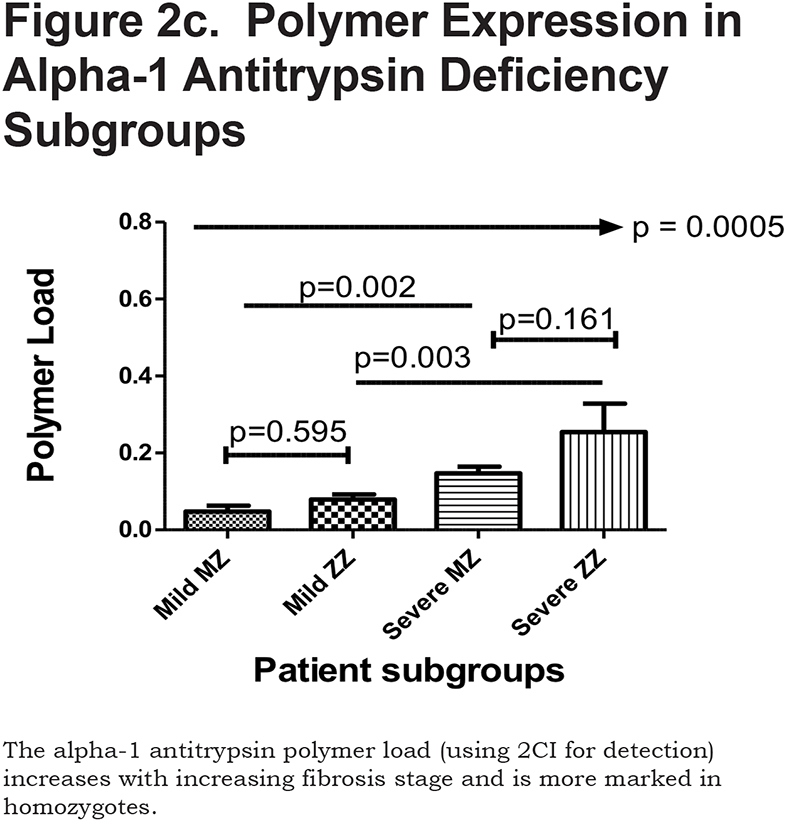
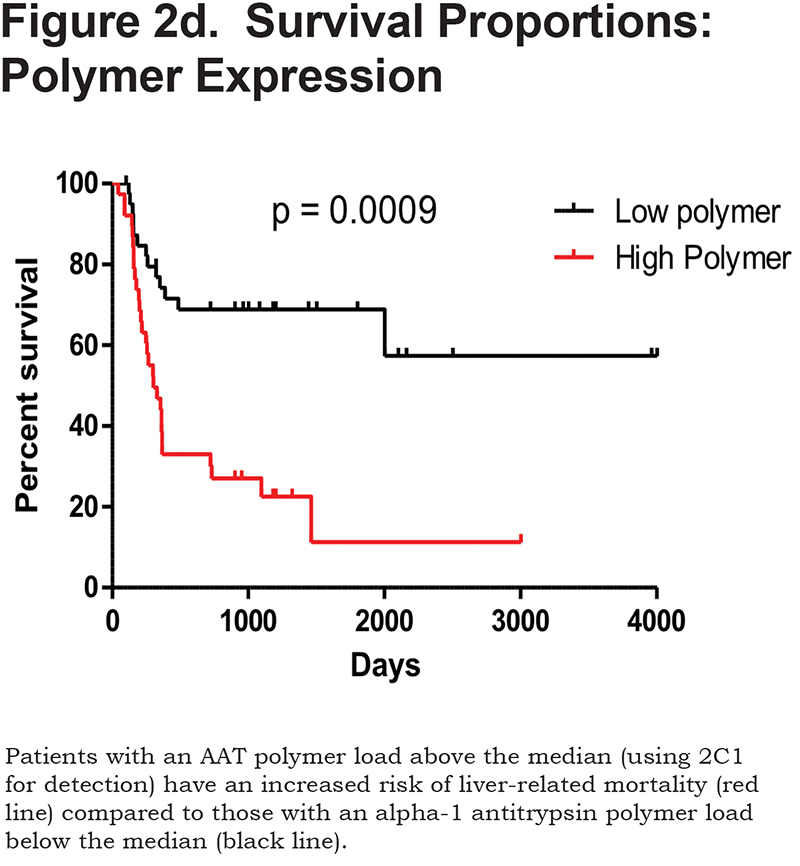
Hepatocytes containing AAT polymers were detected rarely before age 40, but the number rose with increasing age (p = 0.0015, Figure 2a). There was a significant correlation between the AAT polymer load and the grade of interface hepatitis, a recognized hallmark of AAT-related liver disease (p = 0.0117, Figure 2b), but not with lobular hepatitis, nor with portal tract inflammation. There was a close relation between the AAT polymer load and fibrosis stage in both homozygous and heterozygous AATD patients (Spearman rank ρ = 0.711, p < 0.001 and ρ = 0.40 p = 0.001, for homozygotes and heterozygotes respectively, Figure 2c). When patients were divided according to the median, those with the higher AAT polymer load had a greater risk of liver-related mortality (p = 0.0009, Figure 2d). There were weak correlations between the AAT polymer load and blood markers of liver synthetic function including serum albumin and prothrombin time (both p = 0.05), but not with serum bilirubin.
Hepatocyte Cell Cycle Phase Markers
Expression of Mcm-2, cyclin A, PH3 and p21 was negligible in normal tissue (always < 0.01% hepatocytes). In liver tissue from AATD patients, Mcm-2 expression (a marker of cell cycle entry) was greatest in hepatocytes in zone 1 and least in zone 3 (p = 0.001); cyclin A (a late cell cycle phase marker) was detected predominantly in zone 2 (p = 0.003). The mitosis marker PH3 was detected rarely and without a significant zonal distribution pattern in these patients. In contrast, all cell cycle phase markers (Mcm-2, cyclin A and PH3) had a similar distribution through zones 1, 2 and 3 in recovery following reperfusion injury.
There was no statistical difference in the expression of any cell cycle phase marker between AAT homozygotes and heterozygotes. The proportion of hepatocyte nuclei positive for Mcm-2 (evidence of cell cycle entry) was higher following reperfusion injury than in the study cohort (23.0% versus 11.1%; p = 0.04). The proportion of hepatocyte nuclei expressing cyclin A and PH3 were also higher in recovery following reperfusion injury than in the study cohort (11.1% versus 3.4%; p = 0.001 and 2.0% versus 0.9%; p = 0.003).
Thus, more hepatocytes had entered the cell cycle during recovery following reperfusion injury than in patients with either homozygous or heterozygous AATD, which may reflect the severity of the initial liver insult. However, a far greater proportion of hepatocytes had progressed beyond G1 to G2, S-phase or mitosis (i.e., expressed cyclin B, cyclin A or PH3 respectively) in recovery following reperfusion injury than in the study group, indicative of delayed or arrested cell cycle progression in homozygous or heterozygousAATD. Examples of the immunohistochemistry are shown in supplementary Figures 1a and 1b in the online supplement.
Hepatocyte Expression of p21
Hepatocytes expressing p21 were found more often in homozygous or heterozygousAAT compared with recovery following reperfusion injury (12.3% versus 5.6%; p = 0.03) suggesting a possible mechanism for delayed cell cycle progression, since p21 inhibits the G1 to S-phase transition.
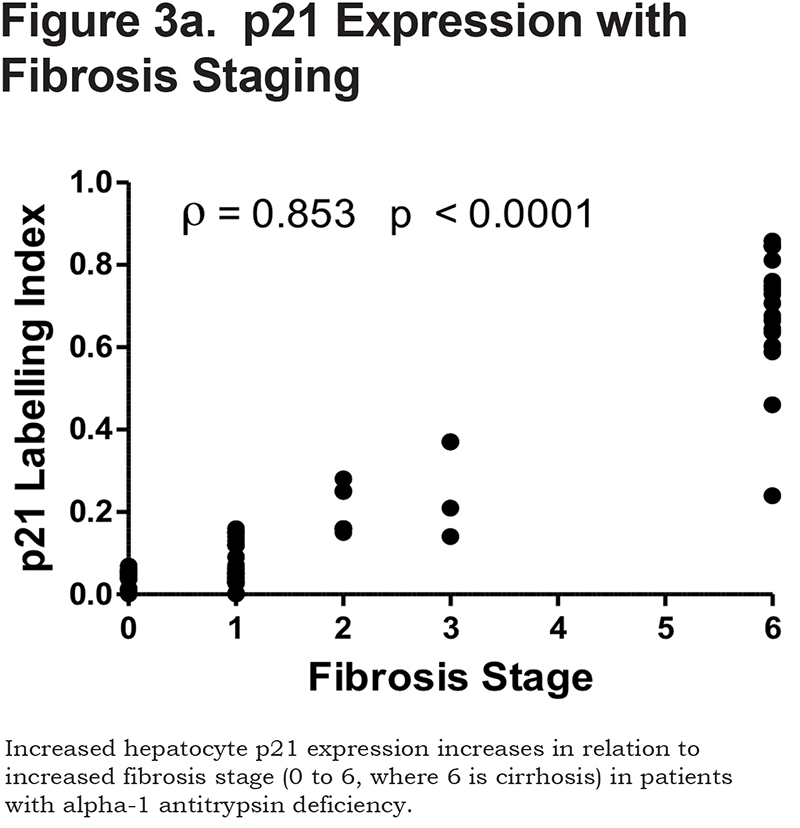
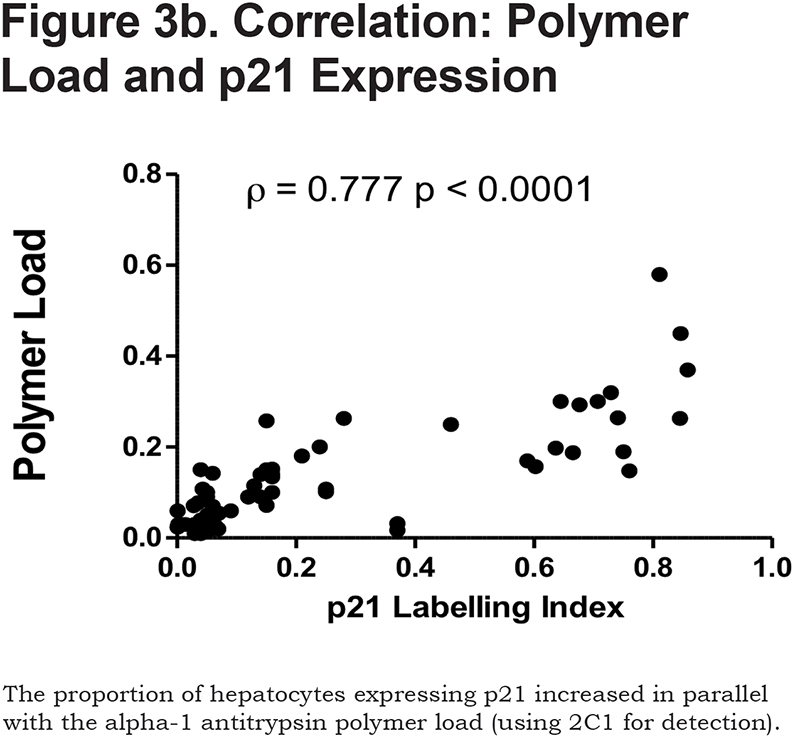
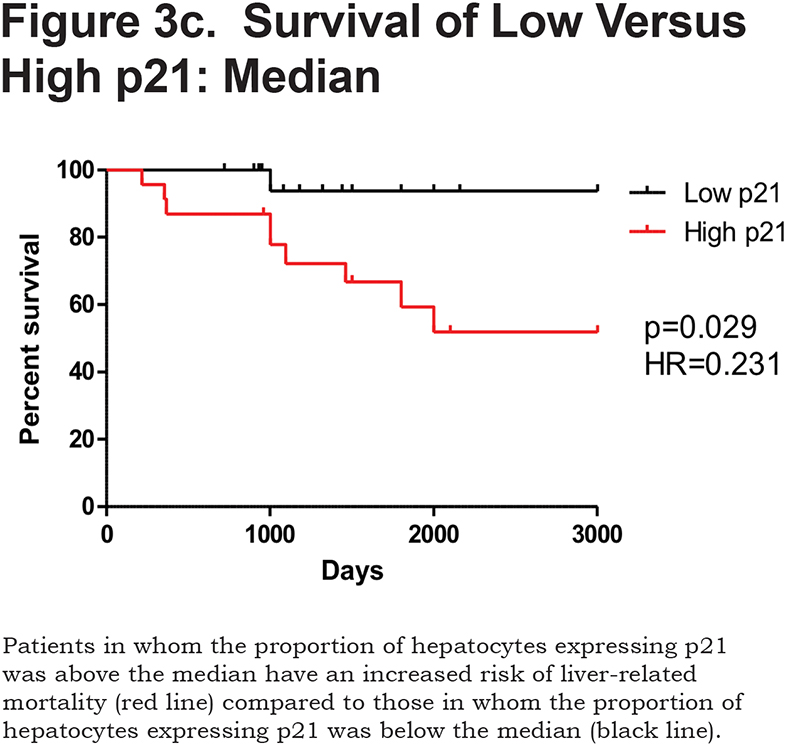
There was a positive correlation between the proportion of p21 positive hepatocytes and fibrosis stage in both heterozygous and homozygous patient groups (Spearman Rank ρ = 0.854, confidence interval [CI] 0.767– 0.909, p < 0.001 and ρ = 0.841, CI 0.712–0.915, p < 0.0001 respectively, Figure 3a). There was also a positive correlation between the AAT polymer load and the proportion of p21 positive hepatocytes (ρ = 0.777, p < 0.001, Figure 3b). When patients were divided according to the median proportion of p21 positive hepatocytes, those with a higher proportion of p21 positive hepatocytes had a greater risk of liver-related mortality (p = 0.029, Figure 3c).
Hepatocyte Telomere Length
There was no evidence of hepatocyte telomere attrition with increasing age in the control group (R2 = 0.0102, p = 0.671). Overall, hepatocyte telomeres in both homozygotes and heterozygotes were shorter than in the control group when matched for age and sex; this effect was more pronounced in homozygotes (p < 0.0001, supplementary Figure 2a in the online supplement). There was accelerated loss of telomere length with increasing age in homozygotes but not heterozygotes (R2 = 0.412, p = 0.004 and R2 = 0.009, p = 0.394 respectively, supplementary Figure 2b in the online data supplement). In both groups the reduction in telomere length was most prominent in AAT polymer positive hepatocytes when compared with AAT polymer negative hepatocytes (supplementary Figure 2c in the online supplement).
There was a close, inverse correlation between AAT polymer load and overall hepatocyte telomere length in both homozygotes (p = 0.0007, R2 -0.636) and heterozygotes (p < 0.0001, R2 -0.6914). There was an inverse correlation between overall hepatocyte telomere length and fibrosis stage in AAT heterozygotes (p = 0.039); however, this was not observed in AAT homozygotes, probably because in this group almost all hepatocyte telomeres were shortened beyond the limits of detection, as reflected by the reduced number of telomeres detected.
Patients with hepatocyte telomeres longer than the median had a survival advantage compared to patients with shorter telomeres (p = 0.013, supplementary Figure 2d in the online supplement), an effect that was even more marked when the median hepatocyte telomere length measurement in AAT polymer positive hepatocytes was used to separate patient groups (p = 0.0001, supplementary Figure 2e in the online supplement). ROC analysis demonstrated both low specificity and low sensitivity for hepatocyte telomere length in the prediction of liver-related mortality (both 53%, p = NS).
Hepatocyte Nuclear Area
There was no change in hepatocyte nuclear area with increasing age in the healthy controls (R2 = 0.150, p = 0.091). However, mean hepatocyte nuclear area was increased in both AAT homozygotes and heterozygotes compared to healthy controls (supplementary Figure 3a in the online supplement), increasing in parallel with fibrosis stage, but unrelated to age in either heterozygotes or homozygotes (R2 = 0.041, p = 0.2793) and R2 = 0.114, p = 0.1704) respectively. Nuclear area was even greater in AAT polymer positive hepatocytes than in AAT polymer negative hepatocytes (p < 0.0001), findings that were most marked in homozygotes (p < 0.001, supplementary Figure 3b in the online supplement). There was a close correlation between AAT polymer load and hepatocyte nuclear area in both homozygotes and heterozygotes (both p < 0.0001, supplementary Figure 3c in online supplement). There was no relation between hepatocyte nuclear area and hepatocyte telomere length in either heterozygotes (R2 = 0.017, p = 0.481) or homozygotes (R2 = 0.048, p = 0.397).
Patients with hepatocyte nuclear area above the median (37 µm2) also had an adverse liver-related survival compared to those with hepatocyte nuclear area below the median. ROC analysis revealed sensitivity of 55% sensitive (39–72) and specificity of 87% specific (71–96, p = 0.0286).
Patients with an AAT polymer load above the median 10.5% of the liver section had an increased liver-related mortality (p = 0.0009). Patients with hepatocyte p21 expression above the median 62% also had an increased liver-related mortality (p = 0.029).
ROC analysis revealed that a cut off for the AAT polymer load for liver-related mortality was more than 11% of liver biopsy area, similar to the median expression in the Kaplan-Meier curve (10.5%). Thus, the cut-off has prognostic value with an AUC of 0.804 (CI 0.702–0.883), with sensitivity 65.1% and specificity 85%.
The corresponding area under the ROC for hepatocyte p21 at p < 0.0001 was 0.616, which corresponded with an area under the ROC curve of 0.872 (CI 0.762–0.943), with sensitivity 85.7% and specificity 75.6%.
Discussion
These results demonstrate shortened hepatocyte telomeres in all AAT homozygotes and heterozygotes studied, consistent with accelerated aging. Telomere shortening was most marked in those hepatocytes that expressed AAT polymers, an observation that held true for both homozygotes and heterozygotes, suggesting a direct link between the presence of polymers and accelerated hepatocyte aging. Hepatocytes that expressed AAT polymers were usually p21 positive and did not express Cyclin A, indicating that increased hepatocyte turnover in those cells is an unlikely explanation for the shortened telomeres. Hepatocyte telomeres do not shorten with age in healthy liver tissue22 and so a more likely explanation for telomere shortening in AATD is that telomere damage is a consequence of cell injury. Telomere shortening with age in a normal healthy liver is observed in other intrahepatic and sinusoidal cell lineages22 and hepatocyte telomere length in patients with AAT homozygotes and heterozygotes was comparable to that in sinusoidal cell lineages in healthy individuals in their seventh decade and beyond. Overall hepatocyte telomere shortening was similar to that in other chronic liver disorders,18,20 but for those case series and the current cohort, the relation between telomere shortening and fibrosis stage or clinical outcome was weak.
Cells with telomeres that have sustained DNA damage or have shortened to a critical length are susceptible to cell cycle arrest24 and there was clear evidence in this series that AAT polymer positive hepatocytes demonstrated slow cell cycle progression and were usually p21 positive. Indeed, only AAT polymer negative hepatocytes expressed cell cycle phase markers indicating progression beyond G1. The presence of a further group of hepatocytes, which were negative for both AAT polymer and Mcm-2, i.e., cells that had not entered the cell cycle and were resting, indicates there are 3 distinct hepatocyte populations in AAT homozygotes and heterozygotes. These data are consistent with murine studies, which showed increased overall hepatocyte proliferation, but that AAT polymers positive hepatocytes were not proliferating.5
The presence of AAT polymer positive hepatocytes that have entered the cell cycle but cannot progress beyond G1 (and also express p21 with large nuclei), is consistent with the hypothesis that such cells are senescent. There is no single marker of cellular senescence; however, the combination of 4 markers characteristic of cellular senescence including enlarged nuclei, cell cycle phase markers (including Mcm-2), shortened telomeres and p21 expression makes this a likely explanation and in particular excludes apoptosis induced by AAT polymer as an explanation for the liver injury. We have demonstrated co-expression of p21 and γH2AX, a marker of DNA damage, in large, glycogenated nuclei across the spectrum of chronic liver disease.25 The proportion of senescent hepatocytes in this series (measured as p21 positive or those with a large nucleus) was associated closely with both fibrosis stage and the subsequent clinical course, consistent with our observations in chronic hepatitis B and C virus infections, alcohol-related and non-alcohol-related fatty liver disease.18,19,20,21 Since most hepatocytes that contained AAT polymers were senescent, as indicated by p21 expression and increased nuclear size, it is not surprising that the AAT polymer load was also associated closely with both fibrosis stage and the clinical course. In a previous study,19 we demonstrated a strong geographic correlation between fibrosis and senescent hepatocytes and in this series, AAT polymer positive hepatocytes were also associated geographically with tracts of fibrosis.
The proportion of hepatocytes expressing p21, the proportion of hepatocytes with an enlarged nucleus or expressing AAT polymers were all related to the subsequent outcome, an effect that was apparent years after liver biopsy in many and in advance of abnormal blood tests consistent with liver failure. Similar results were observed in alcohol-related and non-alcohol-related liver disease18,19 while p21 has been used to stratify patients with HCC.26 The proportion of p21 positive hepatocytes, enlarged nucleus or AAT polymers may have a role in stratifying risk in patients with AATD, a group with huge variation in severity despite apparent similarities and genetic homogeneity and may also permit stratification in clinical trials of therapeutic approaches now reaching phase 1 and phase 2. In practical terms, both p21 and AAT polymer expression can be measured readily, while assessing nuclear size accurately is time consuming (unless automated) and requires particular expertise.
Patients were selected for the study over a well-defined period and included all AATD homozygotes who underwent liver biopsy and all of those AAT heterozygotes without an alternative explanation for liver disease. The relatively large number of homozygous patients reflects a long-standing local interest in respiratory disease caused by AATD so attracting patients from far afield. We have described this series in more detail previously,27 in which a number of patients declined liver biopsy because there was no available clinical intervention. In contrast, the AAT heterozygous patients were recruited consecutively from a tertiary hepatology service that provides regional hepatology cover and liver transplantation. Those with alternative causes of liver disease, including non-alcoholic fatty liver disease, were excluded by review of the clinical scenario, histology and appropriate blood tests. It is noteworthy that the number of patients with liver disease attributed to heterozygous AATD alone was considerably greater than the number of homozygotes, suggesting that such patients comprise a much larger part of clinical practice than many may suspect. This is consistent with recent studies demonstrating that patients with advanced liver disease and those undergoing liver transplantation include a significant proportion that are heterozygous for the Z allele,14,15,16 in whom AATD may be the primary cause of liver injury or acting synergistically as a critical co-factor.
These data support the view that the AAT polymer load plays a causative role in the evolution of liver fibrosis. Although changes were in general most marked in homozygotes, some patients homozygous for the Z allele had a low polymer load with low fibrosis stage; conversely some patients heterozygous for the Z allele had a high polymer load with marked fibrosis and a poor clinical outcome.
Acknowledgments
The authors acknowledge, with gratitude, the support from the Addenbrooke’s Hospital Liver Transplant Patient Association to cover laboratory costs for work undertaken by M.M.
Declaration of Interest
None of the authors has a conflict of interest.