Running Head: History of Bronchitis in England and Wales
Funding Support: Not applicable.
Date of Acceptance: April 17, 2020
Abbreviations: chronic obstructive pulmonary disease, COPD; Reid index, RI; chronic mucus hypersecretion, CMH; forced expiratory volume in 1 second, FEV1; total suspended particle, TSP; disability-adjusted life-years, DALY; smoke particles, SP; particles < 2.5 μm in diameter, PM2.5
Citation: Widdicombe JH. A brief history of bronchitis in England and Wales. Chronic Obstr Pulm Dis. 2020; 7(4): 303-314. doi: http://doi.org/10.15326/jcopdf.7.4.2020.0135
Pathology
Bronchitis is an inflammation of the airway lining characterized by excessive production of mucus. It can be either acute or chronic. Acute bronchitis may be triggered by a viral or bacterial infection, in which case it is in effect a “chest cold.” It may also result from exposure to smoke or other irritants. It generally lasts a week or two. Chronic bronchitis is usually defined as “cough and phlegm (or sputum) production most days for > 3 months in 2 consecutive years.”1 It involves a major remodeling of the airway mucosa and submucosal glands. Chronic bronchitis is almost always associated with emphysema, and since the mid-1960s the combination of the 2 has been known as chronic obstructive pulmonary disease (COPD).
Catarrh, the excess build-up of mucus secretions in the nose or throat, the main clinical feature of bronchitis, was well known to Hippocrates and other ancient physicians.2 However, the first reasonably accurate clinical description of chronic bronchitis, then designated as “bastard peripneumonia,”3 did not appear until 1696. The term bronchitis itself was coined by Badham in 1808 to describe “an inflammatory affection of the mucus membrane which lines the bronchial tubes.”2 The descriptor, chronic, was added in 1837, but for some time the disease continued to be referred to as chronic mucus catarrh or just chronic catarrh.4
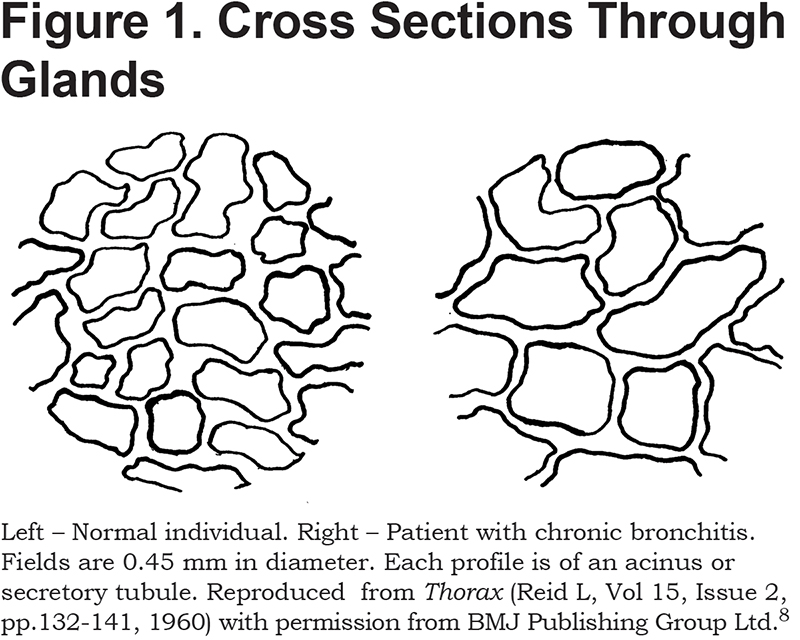
With the invention in 1816 of the stethoscope, the location, amount, and even consistency of the mucus secretions could be assessed.5 Clinicians, however, were little concerned with the source of these secretions, but there were a number of possibilities. Initially, Hesse, echoing Henle, wrote in 1841 that exfoliation of the epithelium led to increased extravasation, and catarrh consisted mainly of epithelial cells and plasma transudate. He did, however, state that hypertrophy of the mucus glands was one of the “organic results of catarrhal disease.”6 In 1854, Kolliker7 quantified the hypertrophy. He found a layer of glands about 1 millimeter beneath the surface epithelium and stated that in health the “rounded gland-vesicles” (i.e., acini) of laryngeal glands were 0.03 to 0.04 lines (68 – 90 µm), in diameter. However, they were “frequently altered in catarrh” such that they now had diameters of as much as 0.08 lines (180 µm) or even 0.16 (360 µm). A 100 years later, this was confirmed by Reid.8 Thus, as shown in Figure 1, she found acini to average about 75 µm in diameter in health and 120 µm in chronic bronchitis. Not only were individual gland profiles bigger in chronic bronchitis but the thickness of the gland layer as a whole was increased from 0.2 to 0.6 mm. Further, the bigger glands apparently secreted more – there was a positive correlation between the thickness of the gland layer and the amount of sputum produced daily.8
Because there is variation in the degree of shrinkage of fixed tissues, rather than use absolute values Reid preferred to normalize thickness of the gland layer— (A)—to the overall thickness of the tissue lying between the basement membrane of the epithelium and the outer surface of the cartilaginous rings—(B). She found this ratio (A/B), the so-called “Reid index” (RI), to increase from 0.26 in healthy airways to 0.59 in chronic bronchitis.8 Many have confirmed this increase but found it to be less dramatic. Thus, across 8 studies, the RI averaged 0.37 in controls and 0.50 in bronchitics.9 Though RI is undoubtedly of diagnostic value, of more interest to the physiologist is the volume of glands per unit area of airway surface. This can be obtained from RI as follows. For a continuous layer of constant thickness, the volume of glands in µl/cm2 is 100A (where A, defined earlier in this paragraph, is in mm). The RI by definition is A/B. Combining the 2 expressions gives:
gland volume (µl/cm2) = RI x B x 100
Reid provides values of B, as well as RI, and applying this equation to her data yields gland volumes of 17 µl/cm2 in health and 62 µl/cm2 in chronic bronchitis. When B is not given, the value of (B – A) given by Reid can be used in an alternative expression:
gland volume (µl/cm2) = ((B-A) x RI x 100) ÷ (1-RI)
The term (B – A) is the thickness of the gland-free layers. It averages 0.45 mm in both main and lobar bronchi and does not change in bronchitis.8 Applying the value of (B – A) from Reid to the average values of RI for all studies combined yields values of 26 and 45 µl/cm2 for gland volume in health and disease. More recently, gland volume has been measured by an approach that did not involve the RI and found to vary from 16 to 48 µl/cm2 across tracheas.10 Thus, gland volume increases approximately 3-fold in chronic bronchitis.
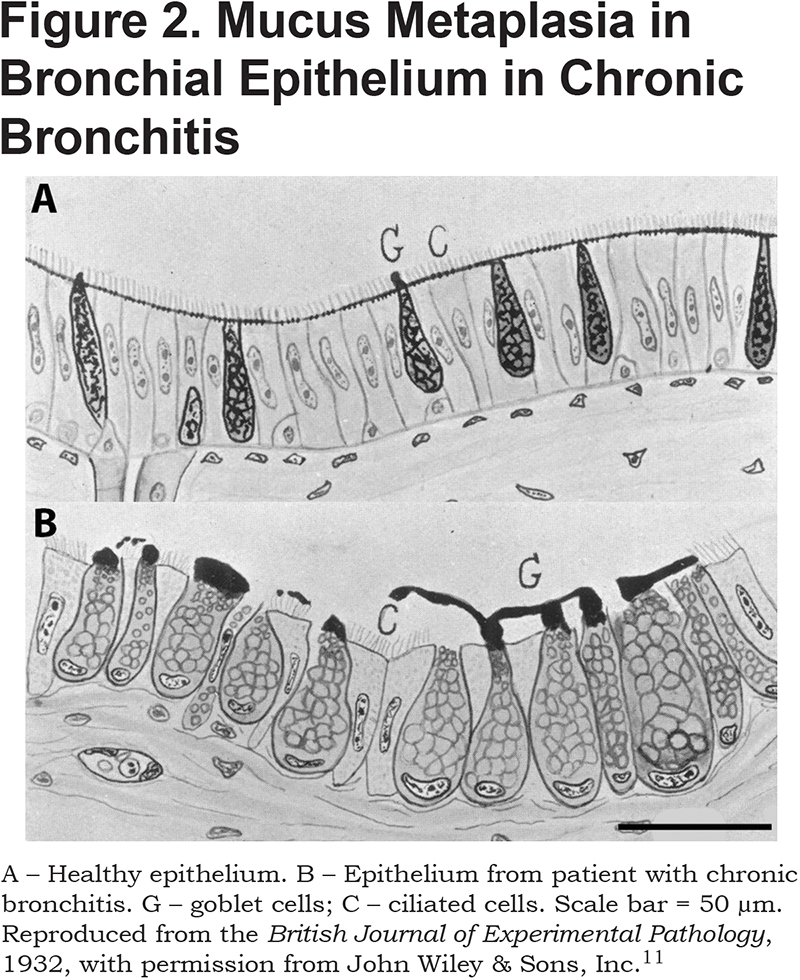
Not only do glands hypertrophy in chronic bronchitis, but there is also an increase in the numbers and size of goblet cells in the surface epithelium. This was first noted in 1932 when Florey et al11 found that in epithelia from 8 of 9 bronchitics, goblet-cells were greatly increased in numbers and size, and “in 2 specimens the major part of the mucosa was constituted solely of these cells.” One of these 2 is compared with healthy epithelium in Figure 2. Multiple later studies have confirmed an increase in the number of goblet cells, of from 2- to 3-fold, in both cartilaginous and non-cartilaginous airways.12-14
Squamous metaplasia of bronchial epithelium is also increased in chronic bronchitis.15,16 In one study, squamous metaplasia was detected in 19 of 30 patients with COPD, but in only 1of 15 healthy non-smokers.16
Mucociliary clearance is reduced in chronic bronchitis17 for a variety of reasons. First, mucus and squamous metaplasia reduce the number of ciliated cells per unit area of mucosal surface. Second, the beating of the remaining ciliated cells is less coordinated. Thus, cilia beat in fields of several hundred cells each. In health, all fields beat in much the same direction. However, in bronchitis the orientation of the beat among ciliary fields becomes essentially random, and motion in many fields ceases completely.18 Third, the increased size of the mucus-secreting apparatus results in much larger than normal volumes of sputum; some use sputum production of > 30 ml per day as a criterion for chronic bronchitis.1 Finally, the mucus secretions are abnormally concentrated.19 Large volumes of sticky mucus therefore accumulate, and the body compensates by increased coughing. Thus, whereas healthy individuals who have never smoked cough about once an hour, it is 9 times per hour for current smokers with COPD and 5 times per hour for ex-smokers with COPD.20
Other cellular changes in chronic bronchitis include increased diapedesis of white blood cells, degeneration of cartilage, perichondrial fibrosis, thickening of the smooth muscle layer, and bronchiecstasis.9
In 1837, it was noted that emphysema was “a frequent, yet still by no means a constant, complication” of bronchitis.4 It was not until 1966, however, that the association between the 2 was quantitatively established when it was reported that 70% of bronchitics dying in American and Australian hospitals had emphysema, compared to 34% of non-bronchitics.21 It had in fact been recognized, in the mid 1950’s, that the primary cause of both conditions was cigarette smoking.22-25 However, bronchitis and emphysema may not be entirely independent results of exposure to tobacco smoke (or other atmospheric pollutants). Thus, chronic mucus hypersecretion (CMH) in patients with COPD is associated with an accelerated decline in forced expiratory volume in 1 second (FEV1) and an increased risk of hospitalization from exacerbations.26 However, CMH in individuals with normal lung function does not predispose to airflow obstruction.27 Somehow, it seems, CMH accelerates the progression of emphysema in those with established COPD.
Mortality from Bronchitis 1838 to 1920
From July 1, 1837, all births, deaths, and marriages in England and Wales had to be reported to the newly created Registrar-General’s Office. Further, the cause of death had to be listed on a death certificate. A long list of approved causes was drawn up, one of which was “bronchitis.” Unfortunately, for the period 1838 to 1920 no distinction was made between acute and chronic.
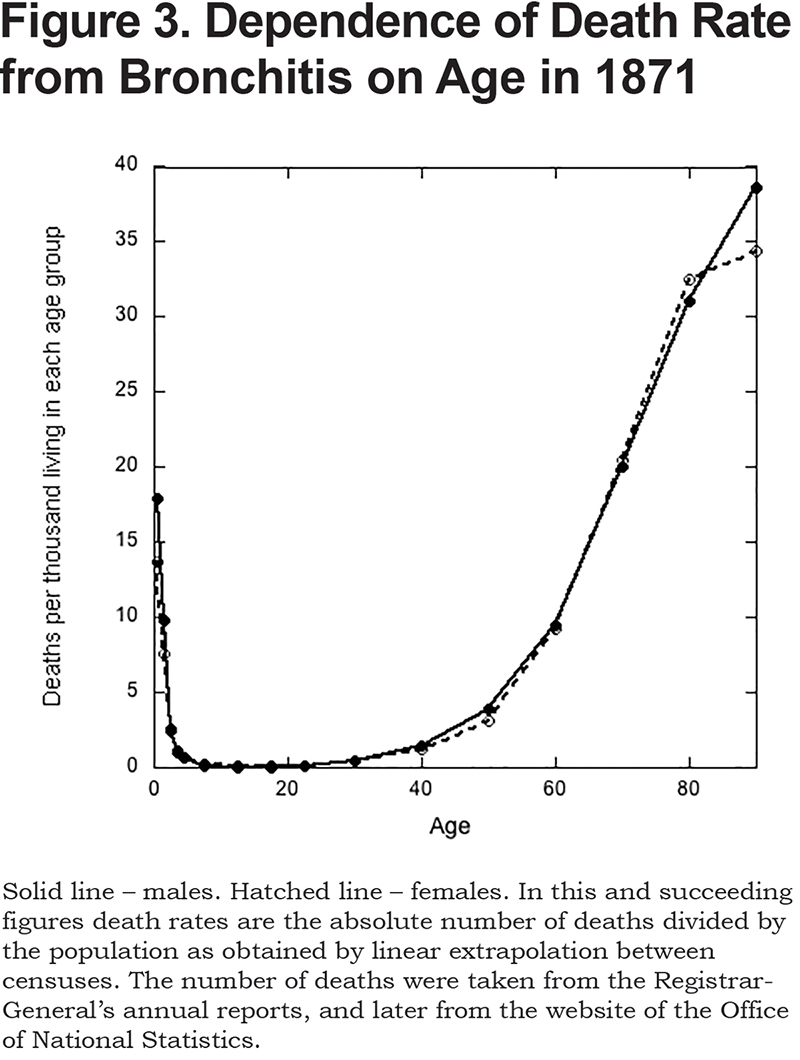
During this period, there were 40.3 million deaths recorded for England and Wales, and bronchitis accounted for 8.0% of these. As a cause of death, it was second only to phthisis (9.8%). The very young and the very old were most susceptible (see Figure 3). The death rate of infants (i.e., those aged less than one) was much the same as for a 70-year-old (Figure 3). It reached a minimum in those aged 10 to 14, and then increased exponentially with age. Males and females were equally susceptible (Figure 3).
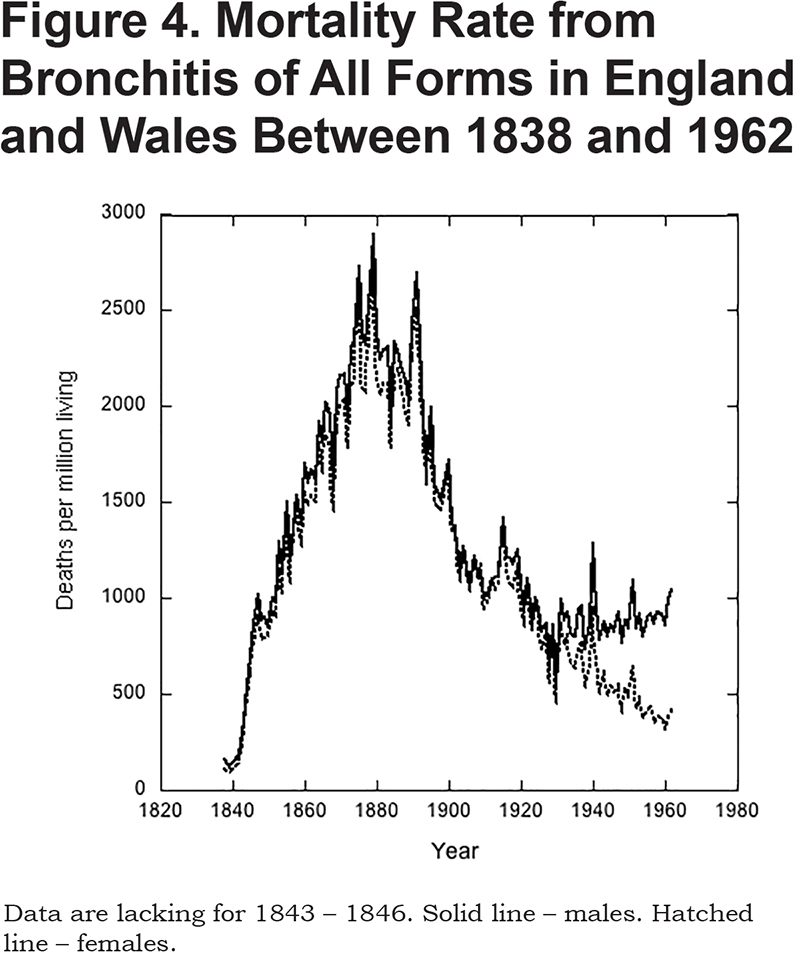
There were marked changes in the mortality rate over time (Figure 4). Thus, in 1838, bronchitis was responsible for only 0.6% of deaths. By 1879, however, it was the main cause of mortality, responsible for 14.3%. Thereafter, its importance as a killer waned, but even in 1920 it still accounted for 7.5% of all deaths. Note that up to about 1930, death rates from bronchitis were similar for men and women (Figure 4). After this, however, mortality for men became increasingly greater than for women. The reason for this divergence is the main topic of the next section.
For the period 1838 to 1920, it is impossible to know the proportion of deaths due to chronic, as opposed to acute, bronchitis. However, it seems likely that the majority were from acute. First, deaths of those under 20 must have been almost entirely due to acute bronchitis. These accounted for 30% of the total in 1855 (the first year for which data are available), 47% in 1885, and 24% in 1920. Second, life expectancy during this period increased from 41 to 50 years. Chronic bronchitis is a progressive disease of the elderly, and back then many fewer people were living long enough to die from it. Third, in 1921, bronchitis was differentiated into acute, chronic or “unspecified as to whether acute or chronic.” In this year, chronic bronchitis accounted for 30% of all deaths from bronchitis. Acute bronchitis accounted for 26%. The remaining 44% of deaths were ascribed to unspecified bronchitis. However, based on the change in mortality rates over time (described later), it is likely that most of these were due to acute bronchitis.
Why did the mortality from bronchitis increase so markedly between 1838 and 1880? The answer lies in the unprecedented rates of increase in overcrowding, urbanization, and industrialization seen during this period. Between 1801 and 1901 the population of England and Wales quadrupled (from 8 to 32 million), and the increase was absorbed entirely by towns and cities. Whereas, in 1800, 35% of the population was urban (i.e., living in cities and towns with populations of 2000 or more),28 the number was 50% by 1850, and 80% by 1900. By contrast, between 1851 and 1901 the rural population declined29 by 16%. Factories proliferated as fast as people. In 1801, 30% of the labor force was in manufacturing, mining, and industry, but by 1901 this had increased30 to 48%.
Coal was the most important source of man-made energy; it heated the residences and powered the factories. Coal consumption increased at an approximately constant rate30 from 32 million tons per year in 1840 to 167 in 1900. Air quality suffered. Industrial cities were shrouded in smoke, which affected rural areas many miles downwind.31 The soot particles in the air provided foci on which water vapor could collect, and urban fogs increased in frequency and thickness. In central London there were about 10 foggy days per year in 1800, but by 1900 there were 70 days.32 In Manchester, the yearly incidence of dense fogs increased31 from 3 per year for the period 1804-1810 to 26 for the period 1900-1901. By the end of the century, London fogs were present almost daily in December and January, but virtually absent from April to August. Worst during the morning hours, the fogs dispersed after midnight once the factories had closed and the evening fires in the homes had burned down. Severe fogs were known as “peasoupers,” being both strikingly colored and remarkably pungent. Visibility could be reduced to a few yards.33 The fog killed farm animals in their holding pens at the meat markets and slaughterhouses.34 Plants also suffered. In fact, the London plane owes its popularity as a landscaping tree to its smog-resistance.34 Soot coalesced into large flocculi, known as blacks, and coated anything that could not escape indoors. Clean clothes became filthy within a few hours. Statues were completely blackened: “The sitting figures….on the north side of Burlington House might, but for their European garb, be taken for Zulus.”35
These fogs were, of course, mixtures of water vapor and coal smoke, what are now called “smogs,” a term coined in 1905, though “smoke-fog” was in use35 by 1880. Scientific confirmation of their mixed nature came in 1885, when it was shown that the carbon content of London air in foggy weather averaged some 7 times higher than in fine weather. Further, the H2SO4(sulfuric acid) content was elevated 4-fold, and HCl (hydrochloric acid) and NH3(ammonia) both 3-fold.36
Several lines of evidence suggest that smokes and smogs were responsible for the nineteenth century increase in mortality from bronchitis. First, based on data from a handful of selected registration counties it was pointed out in 1883 that death rates from respiratory disease were some 50% higher in the most urbanized than in the most rural counties.37 In fact, if for 1879 (the year of highest mortality from bronchitis) one plots the death rate from bronchitis against the population density of the 3 registration areas of London and the 44 registration counties, the regression is statistically significant. It predicts a mortality rate of 1.91 deaths per 1000 living in the least populated district (Westmorland) and 3.09 in the most (London–Middlesex). The population density was thousands of times higher in London than in any of the registration counties, and this skews the plot. However, if the analysis is done excluding the data for London, the result is much the same: mortality increases from 1.77 in Westmorland to 2.52 deaths per 1000 in the most populated registration county (Lancashire). Second, deaths from respiratory diseases increased dramatically during specific, particularly severe fogs. Russell35 gives details for one that afflicted London in January and February 1880. Deaths from respiratory diseases in the 3 weeks before the fog averaged 509 per week. The fog lasted 3 weeks, and at its peak in the second week there were 1557 deaths from respiratory diseases. Of these, 1223 were due to bronchitis. Whereas deaths from respiratory disease increased 3-fold, deaths from other causes increased by a mere 40%. Third, deaths from bronchitis in metropolitan London over time correlate well with the numbers of foggy days per year. These increased progressively from 12 in 1800, to 34 in 1840, to a maximum of 68 in 1890, before declining32 to 55 in 1920. The corresponding values for death rate from bronchitis are 0.26 deaths per 1000 in 1840, 2.90 in 1890, and 1.02 in 1920. Even with only 3 points, the linear regression of deaths from bronchitis on number of smoky days is highly significant. Fourth, a similar correlation was seen in Manchester, but the time course was different. In this city, the numbers of foggy and gloomy days continued to increase well into the twentieth century.38 However, whereas deaths from bronchitis were decreasing in London and the country as a whole over this period, in Manchester they increased. Fifth, in the mid-19th century the death rates from bronchitis in the United States and Scandinavia were only 2%-5% of those in the much more heavily industrialized and densely populated United Kingdom.39 Sixth, deaths from bronchitis were highest in the winter months when there was the most smoke. Thus, in London, for the period 1846 to 1850, deaths were highest in the first quarter (January, February, March) and lowest in the third (July, August, September), with the average ratio between the 2 being 3.6. Comparing months, rather than quarters,39 in the 1930s the ratio of maximum (in January) to minimum mortality rate (in July or August) was about 6. The ratio was similar in 1961 but since, 1976, the death rate from COPD has been only about 2 times higher at its peak in mid-winter than its nadir in mid-summer.40 This closing of the gap between winter and summer, reflects marked improvements in air quality, particularly after the Clean Air Act of 1956.41
As mentioned, the decline in deaths from bronchitis after 1895 was associated with a decline in the frequency of smogs. The annual deposition of solids and of sulfates also fell in London32 by about 50% between 1910 and 1960. British coal consumption, however, remained essentially constant over the first half of the nineteenth century.42 Why, then, did urban air pollution decrease? The problem of air pollution was well recognized, and the era saw a proliferation of anti-pollution organizations, local and national anti-smoke laws, and government inspectors. The law, however, was ineffective. Prosecutions were few, and penalties were light in the main because it was felt that unduly strict enforcement of the law would damage an area’s economy.32,34,43 By contrast, technological changes in industry resulted not only in less coal being burnt but also in dramatic decreases in the amount of smoke generated per unit energy produced.42 Of particular importance was the widespread conversion from coal to oil or electricity as an energy source. Electricity is generated by coal-fired steam turbines, but these became increasingly efficient with the amount of coal needed to generate a given amount of electricity declining42 by 80% between 1900 and 1938. By contrast to industry, coal consumption in homes increased, by about 60%, between 1903 and 1940. Increasingly, however, people were living in the suburbs rather than city centers. More smoke was coming from the homes, but it was spread out comparatively evenly over a much wider area; smoke levels in urban areas were much reduced.42
Have similar correlations between atmospheric pollution and deaths from bronchitis been reported for other countries? This question can be most definitively answered if the changes in atmospheric smoke content were dramatic compared to any synchronous changes in tobacco consumption, if over the period in question the country was of constant geographical extent, and if recording of deaths and their causes was accurate and comprehensive. Modern-day China meets these criteria. From a peak in around 1980, the average atmospheric total suspended particle (TSP) content of China’s air has declined by 70% today.44 Simultaneously, indoor air pollution has been greatly reduced by conversion to cleaner fuels and by better design of stoves.45 These declines in indoor and outdoor smoke levels are associated with an equally dramatic drop in mortality from COPD. Thus, between 1992 and 2017, this fell from 165 to 45 deaths per 100,000 living for women. For men it fell from 210 to 80 deaths.45 The similarity of these changes indicates that they were not due to changes in smoking habits as these are very different between men and women in China. Thus, in 2010, 54% of Chinese men smoked but only 3% of women did.46 In India, levels of air pollution are among the highest in the world; 14 of the 15 cities with the world’s worst air pollution are in India.47 For 2016, it was estimated that of the disability-adjusted life-years (DALY; the sum of years of life lost due to premature death and years lived with disability), 34% were attributable to ambient air pollution, 26% to household air pollution and 21% to smoking.48 Worldwide, there are multiple other positive correlations between atmospheric pollution and the incidence of, and mortality from, COPD.49 The overall conclusion is that though tobacco use is the main risk factor in many western countries, elsewhere levels of atmospheric pollution are sufficiently high to make this more important. The appeal of the mortality data from England and Wales is that they cover a time span of nearly 200 years during which the effects of atmospheric pollution and of cigarette smoking are clearly separated.
Before leaving the topic of smoke in other countries, it should be noted that levels of atmospheric pollution in modern day China and India are very similar to those seen in British cities in the nineteenth century. Precise comparison is difficult because pollution has been variously reported as the content of smoke particles (SP), of TSP, or of particles less than 2.5 µm in diameter (PM2.5). The last is currently the most popular, and for convenience I will convert the other, earlier measures into PM2.5/m3 using the following approximate ratios50,51: TSP/PM2.5 = 4, and TSP/SP = 2. At its peak, towards the end of the nineteenth century, the average yearly PM2.5 content of London was about 150 µg/m3, but in the London smog32 of 1952, it reached 750 µg/m3.China’s average pollution level peaked44 at 175 µg/m3 around1980. The average for India as a whole47 in 2017 was 90 µg/m3, but in the cities, such as New Delhi,52 it frequently reaches levels close to 500 µg/m3. To put this in perspective, anything over 150 µg/m3 is now regarded as “unhealthy” and over 300 µg/m3 as “hazardous.”
Mortality from Chronic Bronchitis 1921 to the Present
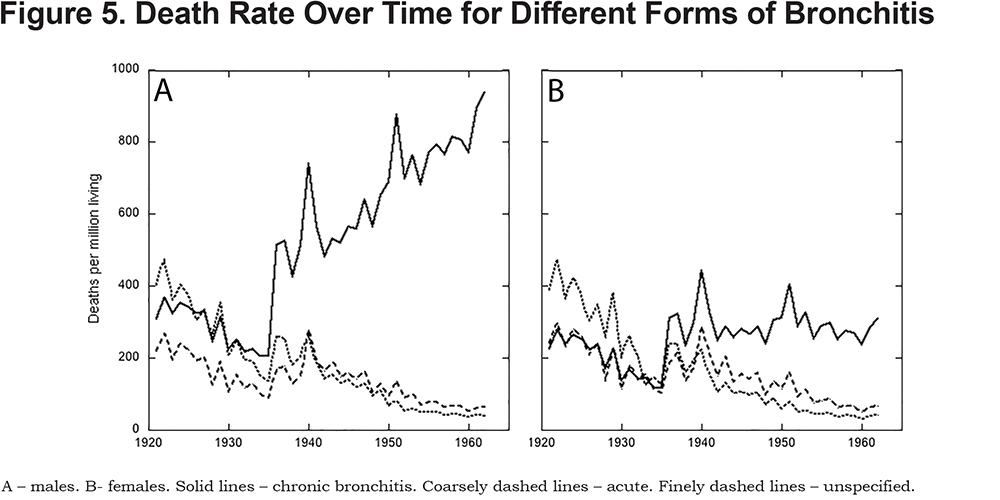
By 1921, the death rate from bronchitis was only about 50% of its peak in 1879. In 1921, acute and chronic bronchitis were distinguished as causes of death though some deaths continued to be described as due simply to bronchitis, without a qualifier. Deaths from all 3 categories declined until 1936 (Figure 5). In this year, new rules on the classification of deaths were applied. This resulted, between 1935 and 1936, in sharp increases in deaths ascribed to each of the 3 forms of bronchitis (see Figure 5). Thereafter, however, death rates from acute and unspecified bronchitis continued to decline (Figure 5), and today are insignificant. There may be several reasons for this (including improved medical care). However, in London, for instance, the average carbon content of air declined more or less continuously41 from 330 µg/m3 in 1900 to 8 µg/m3 in 2000. The death rate for chronic bronchitis behaved very differently than that for acute. For women it stayed constant after 1936, while for men it progressively increased (Figure 5). This meant that while chronic bronchitis accounted for 30% of deaths from bronchitis in 1921, by 1958 the number was 83%. Furthermore, in 1921 the likelihood that a man would die from chronic bronchitis was 1.3 times greater than that for a woman, but by 1958 it was 3.0 times.
The increase in the death rate from chronic bronchitis from 1935 on was preceded by an increase in cigarette smoking. Cigarettes were first sold in the United Kingdom in the early 1890s. From then, tobacco consumption increased 3.6-fold to a maximal level in 1961, at which time cigarettes accounted for 87% of total tobacco consumption. Over this period, consumption of tobacco in forms other than cigarettes53 declined by 55%. The higher incidence of chronic bronchitis in men than women is also explicable in terms of cigarette smoking. Thus, for most of the 19th century about twice as many men as women smoked.53 Further, the average number of cigarettes consumed daily by a woman smoker, in 1962 at least, was about half that by a man (19 versus 11).54
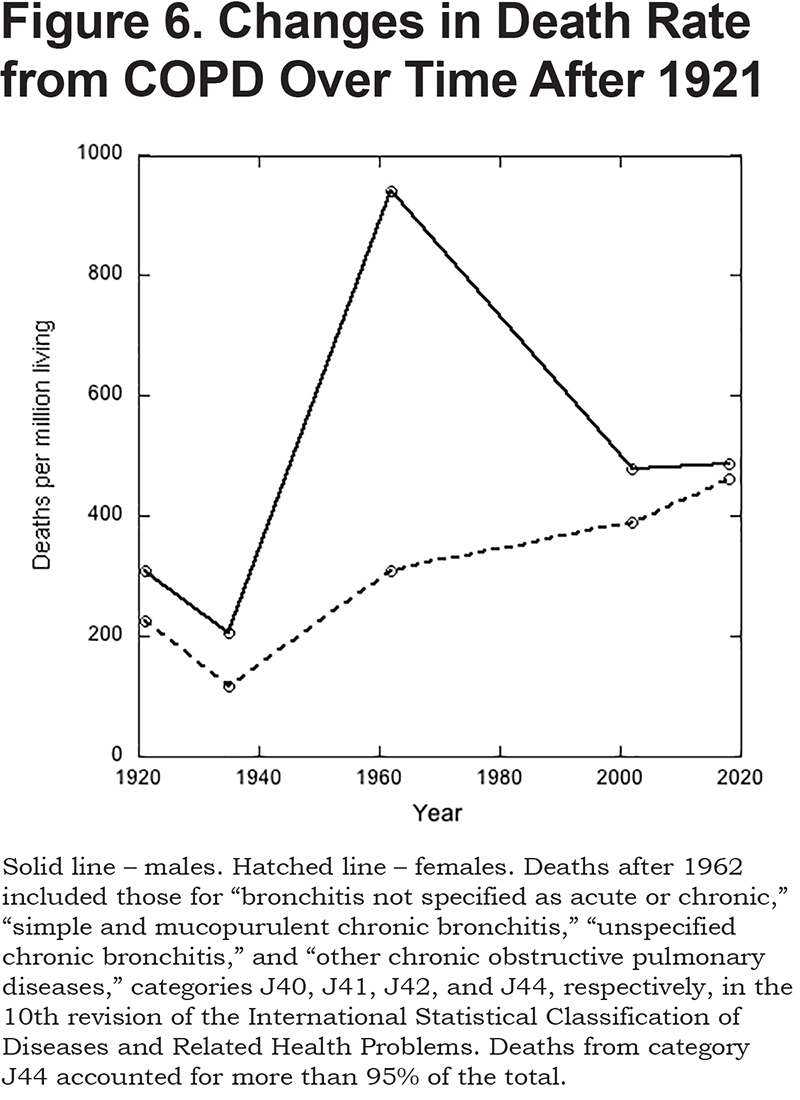
From 1961, cigarette smoking progressively declined. Whereas 70% of men and 40% of women smoked in 1961, the corresponding numbers today55 are 16% and 13%. The decline in smoking was paralleled by a decline in the male death rate from COPD to a value that is little different from that of women (Figure 6). Over the same period, the death rate in women increased slightly, a change that is entirely attributable to progressive aging of the population; after childhood, the death rate from COPD increases exponentially with age (see below).
A link between cigarette smoking and lung cancer was conclusively established56,57 in 1950. Shortly thereafter it was shown that the incidence of chronic bronchitis was higher in smokers than non-smokers, and further, that the incidence correlated positively with the number of cigarettes smoked.24,25,54 It is now known that age and cigarette smoking combined account for about 80%-90% of the risk of developing COPD.58 And, though, depending on the study, from 4% to 22% of those who never smoked develop COPD, more than 40% of smokers will.59 One recent study involving a cohort of 49,286 patients with COPD concluded that 3.3% of the population of the United Kingdom, in 2013, had the disease. Incidence was strongly dependent on age being 0.2% of those aged 40-44, 1.0% for 45-54, 3.0% for 55-64, 6.0% for 65-74, and 7.6% for those 75 and older. Approximately equal numbers of men and women had the disease. Seventy-eight percent were smokers or ex-smokers, and 9% had never smoked (the smoking status of 13% was unknown).60
In 2018, COPD (as defined in the legend to Figure 6) accounted for 5.1% of all deaths in the United Kingdom, and acute bronchitis61 accounted for 0.9%. However, as a cause of death, acute bronchitis now overwhelmingly targeted the very old. Thus, less than 100 of those aged 54 or younger died from it, while more than 70% of deaths (4725 in total) occurred in those over 85 years of age. By contrast, the median age for mortality from chronic bronchitis was 74 years of age.61
Treatment
The trick to curing bronchitis, according to Sydenham, writing in 1696, was “to take away the Blood which occasions the Suffocation and Inflammation of the Lungs.”3 Accordingly, the patient was blooded. But excess bleeding led to weakness, so bleeding had to be alternated on a daily basis with purging. This pair of treatments was then repeated until the patient was well (or too discouraged to continue).
By 1880, attitudes had changed62: “Under no circumstances does it appear necessary or desirable to remove blood.” Instead, priority was given to “removal from the immediate cause of the affection.” In short, avoid polluted air. To do so, a long list of suitable escape locations was provided beginning with Torquay and ending in Southern California. However, for those unable to flee the city or their toxic workplace, a large number of inhalations, tonics or “local treatments” were suggested. Some seem downright odd: “I have known inhalation of the fumes of tobacco to have a very soothing and relieving affect.”62 For excess secretions, a list of more than 10 expectorants was provided, some of which, like potassium iodide, are still in use. Should the mucus membrane be in an extremely irritable state, opium in a variety of forms was “of essential value.”62 For chronic bronchitis when accompanied with spasms, tincture of cannabis Indica was one of several possibilities. “Local treatments” included dry-cupping of the chest, counter pressure provided in the form of plasters and bandages, and various ointments and liniments. Though greater in number, these therapies were little different from those practiced by the Ancients.63 Practically all, however, were either useless or downright harmful. In any case, the poor could not afford to follow doctors’ advice and, as for all ailments, would have relied primarily on opium in the form of laudanum.
Today, the primary pharmacological therapy for COPD is inhaled bronchodilators. Other commonly used drugs include anti-inflammatories, mucolytics, expectorants, and stimulators of ciliary activity.64,65 Most recently, drugs are being developed that target excess mucus production by reducing the expression of mucin genes, inhibiting mucin synthesis, or preventing mucus release.66
Quitting smoking would seem the most logical treatment for chronic bronchitis, and it was first noted, in 1981, that on giving up smoking the epithelium did, to some degree, recover its normal morphology.67 However, it takes several years to do so. In one recent study, 14% of the bronchial epithelium of smokers with COPD was positive for mucus as indicated by staining with periodic acid-Schiff/Alcian blue, and 46% of patients had bronchial epithelium that showed areas of squamous metaplasia. In those who had quit smoking for between 1 and 3.5 years, there were no significant changes in these parameters. In those that had quit for more than 3.5 years, the extents of mucus and squamous metaplasia had both declined by about half.68 Unfortunately, no data were provided on those who had never smoked, but other studies suggest that recovery was incomplete. Thus, it has been reported that only 1 in 15 healthy nonsmokers have squamous metaplasia of the bronchial epithelium16 as opposed to 1 in 5 in long-term ex-smokers. Further, though the volume of surface epithelium occupied by mucus in long-term non-smokers is 60% that of bronchitics,68 it is 40% in healthy never-smokers.69
Declaration of Interest
The author has nothing to declare.