Running Head: A Risk Prediction Model for Mortality Among Smokers
Funding Support: The COPDGene® study is funded by National Heart, Lung, and Blood Institute grants U01 HL089897 and U01 HL089856. The COPDGene® study (NCT00608764) is also supported by the COPD Foundation through contributions made to an Industry Advisory Committee comprised of AstraZeneca, Boehringer-Ingelheim, Genentech, GlaxoSmithKline, Novartis, Pfizer, Siemens, and Sunovion.
Date of Acceptance: May 15, 2020
Abbreviations: COPD Genetic Epidemiology, COPDGene®; SubPopulations and InteRmediate Outcome Measures In COPD Study, SPIROMICS; chronic obstructive pulmonary disease, COPD; Global initiative for chronic Obstructive Lung Disease, GOLD; body mass index, BMI; Body mass index-Obstruction-Dyspnea-Exercise capacity index, BODE; computed tomography, CT; forced expiratory volume in 1 second, FEV1; forced vital capacity, FVC; preserved ratio-impaired spirometry, PRISm; 6-minute walk distance, 6MWD; Framingham Risk Score, FRS; longitudinal follow-up program, LFU; modified Medical Resource Council dyspnea scale, mMRC; cardiovascular disease, CVD; segmental airway wall thickening, sAWT; Social Security Death Index, SSDI; area-under-the-curve, AUC; confidence interval, CI; standard deviation, SD
Citation: Strand M, Austin E, Moll M, et al. A risk prediction model for mortality among smokers in the COPCGene® study. Chronic Obstr Pulm Dis. 2020; 7(4): 346-361. doi: http://doi.org/10.15326/jcopdf.7.4.2020.0146
Online Supplemental Material: Read Online Supplemental Material (519KB)
Introduction
Chronic obstructive pulmonary disease (COPD) is characterized by persistent airflow limitation and is one of the leading causes of mortality worldwide.1 COPD is a heterogeneous disease, and identifying individuals at high risk for death may be important for disease prevention and early intervention. Several risk prediction models have been developed to predict all-cause mortality in COPD. The best known is the body mass index (BMI)-airflow Obstruction-Dyspnea-Exercise capacity (BODE) index, developed to predict mortality in COPD patients over a 4-year period.2 Since then, other models that predict mortality for similar durations of follow-up have been developed.3-7 However, the generalizability of these models has been inconsistent, and identifying models with performance superior to that of BODE has been challenging.8 While these models provide useful information about predictors of mortality in COPD, they were developed using participants in the Global initiative for obstructive Lung Disease (GOLD) spirometry grades 1-4, and have been largely constructed without quantitative computed tomography (CT) imaging variables until recently.9
GOLD defines COPD based on a post-bronchodilator forced expiratory volume in 1 second (FEV1) to forced vital capacity (FVC) ratio of < 0.7 and grades severity based on the post-bronchodilator FEV1 percent predicted.10 However, smokers with an FEV1/FVC 0.7 can exhibit dyspnea, impaired quality of life, and exacerbations.11-14 Furthermore, smokers with preserved ratio-impaired spirometry (PRISm; FEV1/FVC 0.7 and FEV1 < 80% predicted) can progress to GOLD 1-4 spirometry grades and can have a high risk of mortality.15 Previous work also found that certain individuals with normal spirometry may have significant respiratory symptoms, low 6-minute walk distance (6MWD) and impaired quality of life.13,16 Therefore, including smokers that are not classified as GOLD 1-4 in risk prediction models may allow for earlier intervention, and possibly, development of novel therapies. Quantitative CT imaging variables can capture lung structural changes that precede changes in spirometry,16 and have been associated with COPD morbidity and mortality17-20; such variables are expected to improve mortality risk prediction. However, it is not clear to what extent various clinical, physiologic and imaging variables contribute to mortality risk when taken in a unified context. Furthermore, there may be subpopulations of patients in whom the relative importance of risk factors varies (e.g., male versus female).
In cardiovascular disease, risk prediction models for cardiovascular outcomes, including coronary death, are currently used in clinical practice. The Framingham Risk Score (FRS) predicts multiple cardiovascular disease outcomes over a 10-year period.21 This risk score has been used to identify patients with intermediate- or high-cardiovascular risk and initiate aggressive lifestyle modifications and pharmacologic therapy.22
Similar to the FRS study, we modeled all-cause mortality in the COPD Genetic Epidemiology (COPDGene®) study, using data collected over 10 years. We fit a parametric survival model that included PRISm and GOLD 0-4 individuals, using the Weibull distribution. We selected features for the 10-year risk score based on clinician input, prior studies of mortality risk in COPD, and model goodness-of-fit statistics that combined clinical, spirometric, and quantitative CT imaging data. We developed a point scoring system for the fitted models intended to aid clinicians in identifying contributions of modifiable and non-modifiable risk factors for predicted mortality. We then externally validated the risk score model using data from the SubPopulations and InteRmediate Outcome Measures In COPD Study (SPIROMICS).23
Methods
Main Study Cohort - COPDGene
The COPDGene Study (http://www.copdgene.org; ClinicalTrials.gov Identifier NCT00608764) is a multicenter observational study designed to identify genetic and epidemiologic factors associated with the development of COPD and to characterize the disease process using pulmonary function tests and volumetric CT scans.24 The COPDGene Study recruited 10,198 non-Hispanic whites and African Americans aged 45-80 years at 21 clinical centers across the United States. All were current or former cigarette smokers with at least 10 pack years of smoking history. (A nonsmoking cohort has also been established but is not considered here.) The COPDGene study was approved by the institutional review board at each center, and all participants provided written informed consent. Individuals underwent detailed baseline characterization, including demographics, anthropometrics, medical and smoking history, pre- and post-bronchodilator spirometry as well as 6-minute walk distance (6MWD) testing according to American Thoracic Society standards,25-26 and inspiratory and expiratory CT scans using a standardized protocol.27 Post bronchodilator spirometry measures were used in these analyses. Enrollment in Phase One (P1, i.e., baseline) of the COPDGene Study took place between 2008 and 2011; thereafter participants were prospectively followed every 6 months by telephone and web-based inquiry as part of the longitudinal follow-up program (LFU) to determine mortality, comorbid disease events, exacerbation events and current smoking status.28 In addition, many participants have returned for additional visits (Phases 2 and 3). In this analysis, only predictors measured at baseline (i.e., P1) were used in survival modeling.
COPD was grouped as spirometric grades 1-4 based on the GOLD guidelines.29 Participants without spirometric evidence of airflow obstruction (FEV1/FVC ≥ 0.70) and FEV1 ≥ 80% predicted were labeled as GOLD 0. Participants with FEV1/FVC ≥ 0.70 and FEV1< 80% predicted were labeled as preserved ratio-impaired spirometry (PRISm).12 Dyspnea was graded from 0 to 4 using the modified Medical Research Council (mMRC) dyspnea score.30 Current smoking status and pack years of smoking were determined by questionnaire. Diabetes classification was based on patient reports of physician diagnosis reported on the medical history questionnaire. Cardiovascular disease (CVD) was defined as answering “Yes” to any of the following conditions: heart attack, coronary artery bypass graft, angioplasty, congestive heart failure, coronary artery disease, peripheral vascular disease, stroke or transient ischemic attack. The cancer indicator at baseline included history of lung, breast, prostate, colon or bladder cancers. An array of CT variables were considered in our analysis (see Appendix A: “Candidate predictors and model selection” in the online data supplement). Those used in the final model included a visual emphysema score31 and a quantitative mean segmental airway wall thickening (sAWT) variable,32 not to be confused with another variable - the Pi10 airway wall thickness measure.33 More details about the final model are described in the section ahead entitled “Statistical Analysis and Model Selection.”
Death from any cause was ascertained in the cohort using a combination of participant tracking and longitudinal follow-up contacts. Failure to contact a participant was followed by secondary contact procedures to determine vital status. After a death was identified, further confirmation was sought from next of kin interviews, medical records and death certificates. The basic participant tracking mechanisms were supplemented by periodic searches of the Social Security Death Index (SSDI). Potential deaths identified by SSDI search were confirmed by matching name and birthdates. The number of days from the baseline visit (P1) to last date of information on participants (either last date of contact or date of death; “days followed”) was used in the survival modeling. Participants without verifiable follow-up after the baseline date were not included in analyses; there were 249 such participants.
Validation Cohort - SPIROMICS
A second independent cohort from the SPIROMICS study (ClinicalTrials.gov Identifier: NCT01969344) was used for validation of the risk score model. Study design and enrollment of participants were similar to COPDGene23 and began in 2010. One major difference was that the smoking intensity requirement for enrollment was at least 20 pack years. As with COPDGene, a subset of never-smokers also exists for SPIROMICS but is not considered here.
CVD was defined by self-report of physician diagnosis of 1 of the following: high blood pressure, coronary artery disease, angina (chest pain), a heart attack, congestive heart failure, blood clots, poor circulation (claudication), or reporting having a vascular surgery such as a coronary artery bypass graft, stent, carotid artery plaque removal, etc. Participant reports of stroke or a transient ischemic attack were classified as a stroke. Cancer was defined as reporting any type of cancer. The primary differences in data for SPIROMICS compared with COPDGene were that the sAWT variable was calculated using Apollo software (VIDA Diagnostics, Coralville, Iowa) rather than Thirona software (Thirona, the Netherlands, http://www.thirona.eu) and visual emphysema was binary rather than ordinal (6 levels in COPDGene).
Statistical Analysis and Model Selection
Survival data were modeled using parametric survival methods. Specifically, an accelerated lifetime model (or accelerated failure time model)34 was used. We tested several distributions (exponential, gamma, normal, lognormal, logistic, log-logistic, Weibull), and used goodness-of-fit statistics and diagnostics plots (probability plots, log-log plots) to choose the best distribution, which turned out to be the Weibull. The parametric survival model was used instead of the more standard proportional hazards model mainly for ease of translating the linear predictor into a point system. However, proportional hazards models were also fit, and demonstrated very similar fits in terms of area-under-the-curve (AUC) statistics and predicted risk estimates. Kaplan-Meier analyses were also conducted to obtain nonparametric survival functions. Models were fit separately for men and women using the same predictors.
Many preliminary analyses were conducted to determine an optimal set of predictors (including interaction terms) for all-cause mortality. This process is described more in Appendix A in the online data supplement. The baseline predictors used in modeling included a range of variables from demographic, behavioral, symptom, exercise, lung function and CT categories.
The final model included age, BMI, FEV1, current smoking status and pack years, mMRC dyspnea score, visual emphysema, sAWT, 6MWD, and comorbidity indicators for diabetes, CVD and cancer. Once final predictors were determined, continuous variables were tested for inclusion of polynomial terms. Linear and quadratic terms were included for age, BMI and FEV1, while linear terms alone appeared adequate for pack years, 6MWD, airway wall thickening and dyspnea. Visual emphysema31 was categorized into 3 levels: none (0), trace, mild or moderate (levels 1-3 of original variable) and confluent or advanced destructive (levels 4-5 of original variable) also based on initial modeling. Indicators (Yes/No) were used separately for diabetes, cardiovascular disease and cancer comorbidities, as well as current smoking status. Although mMRC dyspnea score is actually ordinal in nature, the linear scaling was found to be adequate. Since sAWT measurements were based on different software for COPDGene and SPIROMICS, these variables were converted to z-scores separately for each data set. This approach assumes that actual sAWT levels are comparable between studies, since mean and variance are set to 0 and 1, respectively, for both data sets. This assumption seemed reasonable since for a smaller subset of participants in COPDGene that did have VIDA measurements available, the means and variances were comparable between data sets. Although the main model in COPDGene used a 3-level emphysema variable, it was converted to a binary variable for another fit to allow validation with SPIROMICS data.
Sensitivity analyses were conducted to determine whether including subsets of data would yield different fits. In particular, we used approximately 75% of all participants with lower GOLD stage (or no) COPD to fit models and found predicted values from these fits to be quite similar to fits using all available participants. Similar analyses were performed considering heavier smokers at least 55 years of age. Validation was carried out by determining AUC statistics for the SPIROMICS cohort, for the model fitted with COPDGene data. Both time-dependent and time-integrated AUC statistics were calculated, using the recursive method.35
The Weibull Model and Risk Estimates
The Weibull AFT model (Liu et al, 2018, Preprint)36 for survival time Ti for participant i is defined as
ln(Ti) = 𝒙′𝑖 β + σ𝜀i
where 𝒙′𝑖 β = β0 + β1xi1 + β2xi2 + ... + βkxik is the linear predictor (x variables are predictors and β’s are coefficients to be estimated), σ is the scale parameter (also to be estimated), 𝜀1, ..., 𝜀n are independent and identically distributed according to the Gumbel distribution [G(0,1)], ‘ln’ expresses the natural log, survival time Ti is measured in time from the baseline visit and is possibly right censored; k denotes the number of predictors in the model with unique coefficients (not including the intercept) and n is the number of participants. The risk of mortality within t years for participant i (and t ≤ 10) is then
pit=P(ln(Ti)≤t)=1-e-e((ln(t)-x'i β)/σ)
Equation (1)
(Values for t >10 could also be determined but this is not recommended since it is beyond the range of data studied.) The linear predictor 𝒙′𝑖 β can be converted to a point scale (plus adjustment) or computed directly, as described next. Parameters in the model are estimated using maximum likelihood estimation, and consequently the estimated risk, p̂it , can then be determined, corresponding to the exact or approximated linear predictor for a specific subject and time. Note for the model described above, Ti has a Weibull distribution, while ln(Ti) has a log-Weibull [or Gumbel; G(𝒙′𝑖 β, σ) distribution]. See Appendix B in the online data supplement for illustrations.
Creating the Point System for Risk Estimates
The linear predictor was converted to a point system using basic methods as described in Sullivan et al (2004).37 Based on a participant’s specific characteristics, points can be determined for each predictor and then summed for a total score, which can then be translated to a risk of death estimate for any fixed time within 10 years. Given the use of whole numbers and categorical approximations of continuous variables in this process, associated risk estimates have some inherent error, and thus using the (exact) linear predictor will yield the most accurate risk estimates. However, the point system can be used to obtain approximate risk estimates quickly by hand; the point system is also helpful to better understand relative importance of predictors, and how changes in these predictors can affect mortality risk. The association between the actual linear predictor and the point score approximation for participant i is
𝒙′𝑖 β ≈ adjusted intercept + (point totali) ⸱S
Equation (2)
where the adjusted intercept is the intercept from the model (i.e., β0), plus adjustments for continuous or class variables that were shifted to have point scales start at 0 (when applicable), and where S is a scalar chosen for the desired range of values for the point system. Any value of S can be chosen since it essentially scales the points and is compensated for in the approximation. An ideal value keeps the points as small as possible, but such that points across levels of predictors are unique. The value used in our models was 0.05. Parameter (beta) estimates from the Weibull model are naturally defined such that higher values increase survival likelihood. In order to make higher points reflect higher risk of mortality, a few adjustments were required in determining the point scores, which is described in more detail in Appendix B in the online data supplement; 2 examples are also provided to illustrate calculations for both exact and point approaches. Using the estimated linear predictor (either by direct calculation or by the point system), corresponding risk estimates can then be computed as described by Soriano et al.1
Results
Characteristics of the Study Group
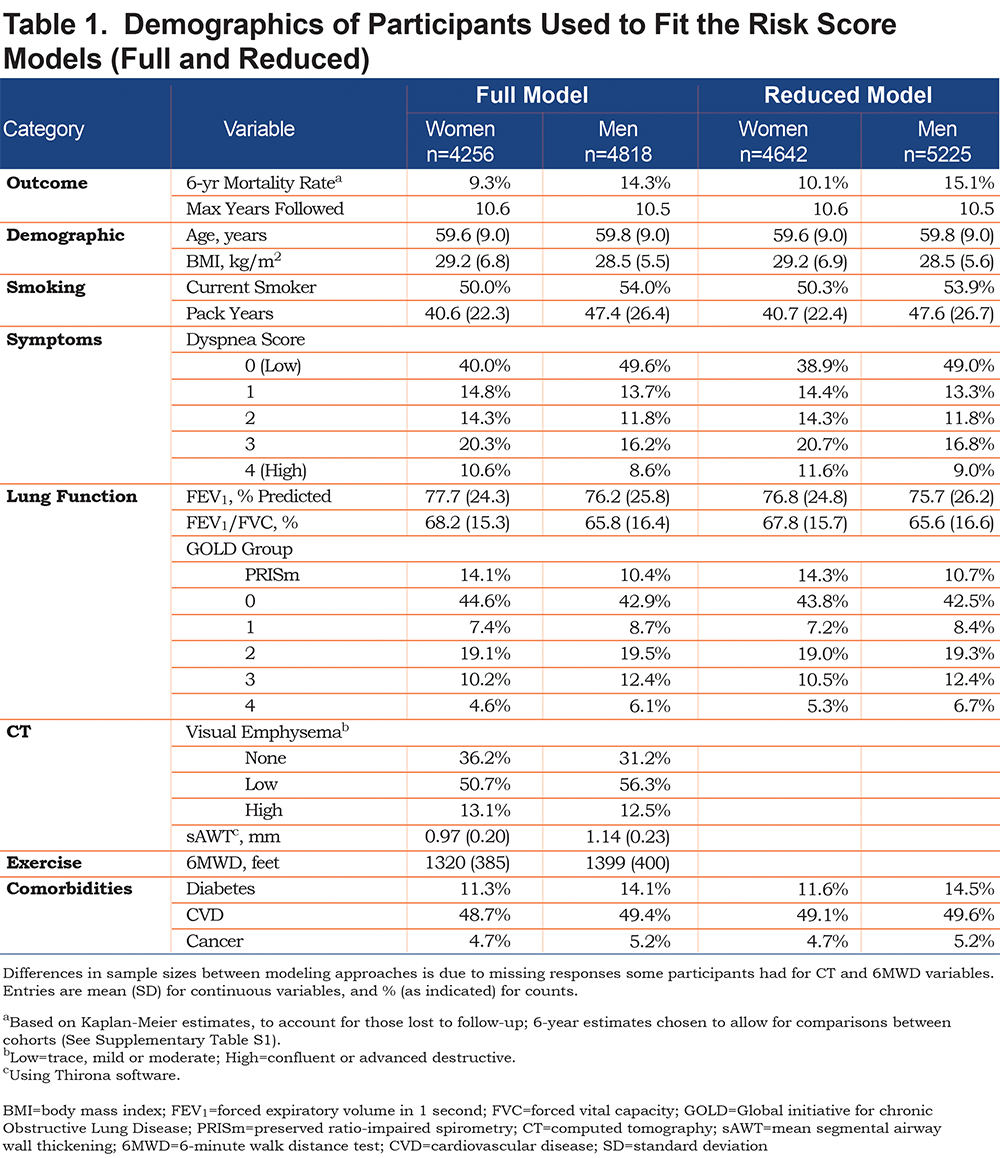
In COPDGene, there were 4256 women and 4818 men available for full model fits; the average age for these participants was just under 60 for both men and women. A total of 587 (13.8%) and 928 (19.3%) deaths occurred for women and men, respectively, within the 10-year study period. In fitting the reduced models, more data were available for both women (n=4642; 683 deaths, 14.7%) and men (n=5225; 1049 deaths, 20.1%) due to removal of the less complete CT and 6MWD variables. Based on Kaplan-Meier survival curves with available data, estimated survival rates were approximately 82% for women and 75% for men at 10 years from baseline visit (for participants with full data), which coincided with predicted 10-year survival estimates from the Weibull model, presented in later sections. Table 1 shows demographic characteristics for study participants by sex at baseline. Over half of the participants were categorized as GOLD 0 or PRISm, about two-thirds had emphysema based on visual assessment of CT scans, and roughly half reported some type of cardiovascular disease.
Tables S1 and S2 (in the online data supplement) show characteristics at enrollment for COPDGene versus SPIROMICS cohorts with respect to those participants with data available for full or reduced models; Table S1 shows statistics for both cohorts, and Table S2 shows statistics for the SPIROMICS cohort, by sex. SPIROMICS participants were, on average, 5 years older, had a greater emphysema rate, lower FEV1 and FEV1/FVC, greater pack years of smoking, but substantially lower current smoking and slightly lower mortality rates. The longest follow-up time in COPDGene was 10.6 years and was 7.3 years in SPIROMICS. SPIROMICS had a smaller proportion of PRISm and GOLD 0 participants than COPDGene, as they were not actively recruited.
Fitting the Model and Illustrations
Parameter estimates and test statistics associated with predictors in the final survival model are shown in Table S3, (in the online data supplement) separately for men and women. The strongest predictors (based on test statistic size) were 6MWD and FEV1. Scale parameter (σ) estimates for the Weibull distribution for men and women were similar (0.67 for women, 0.68 for men).
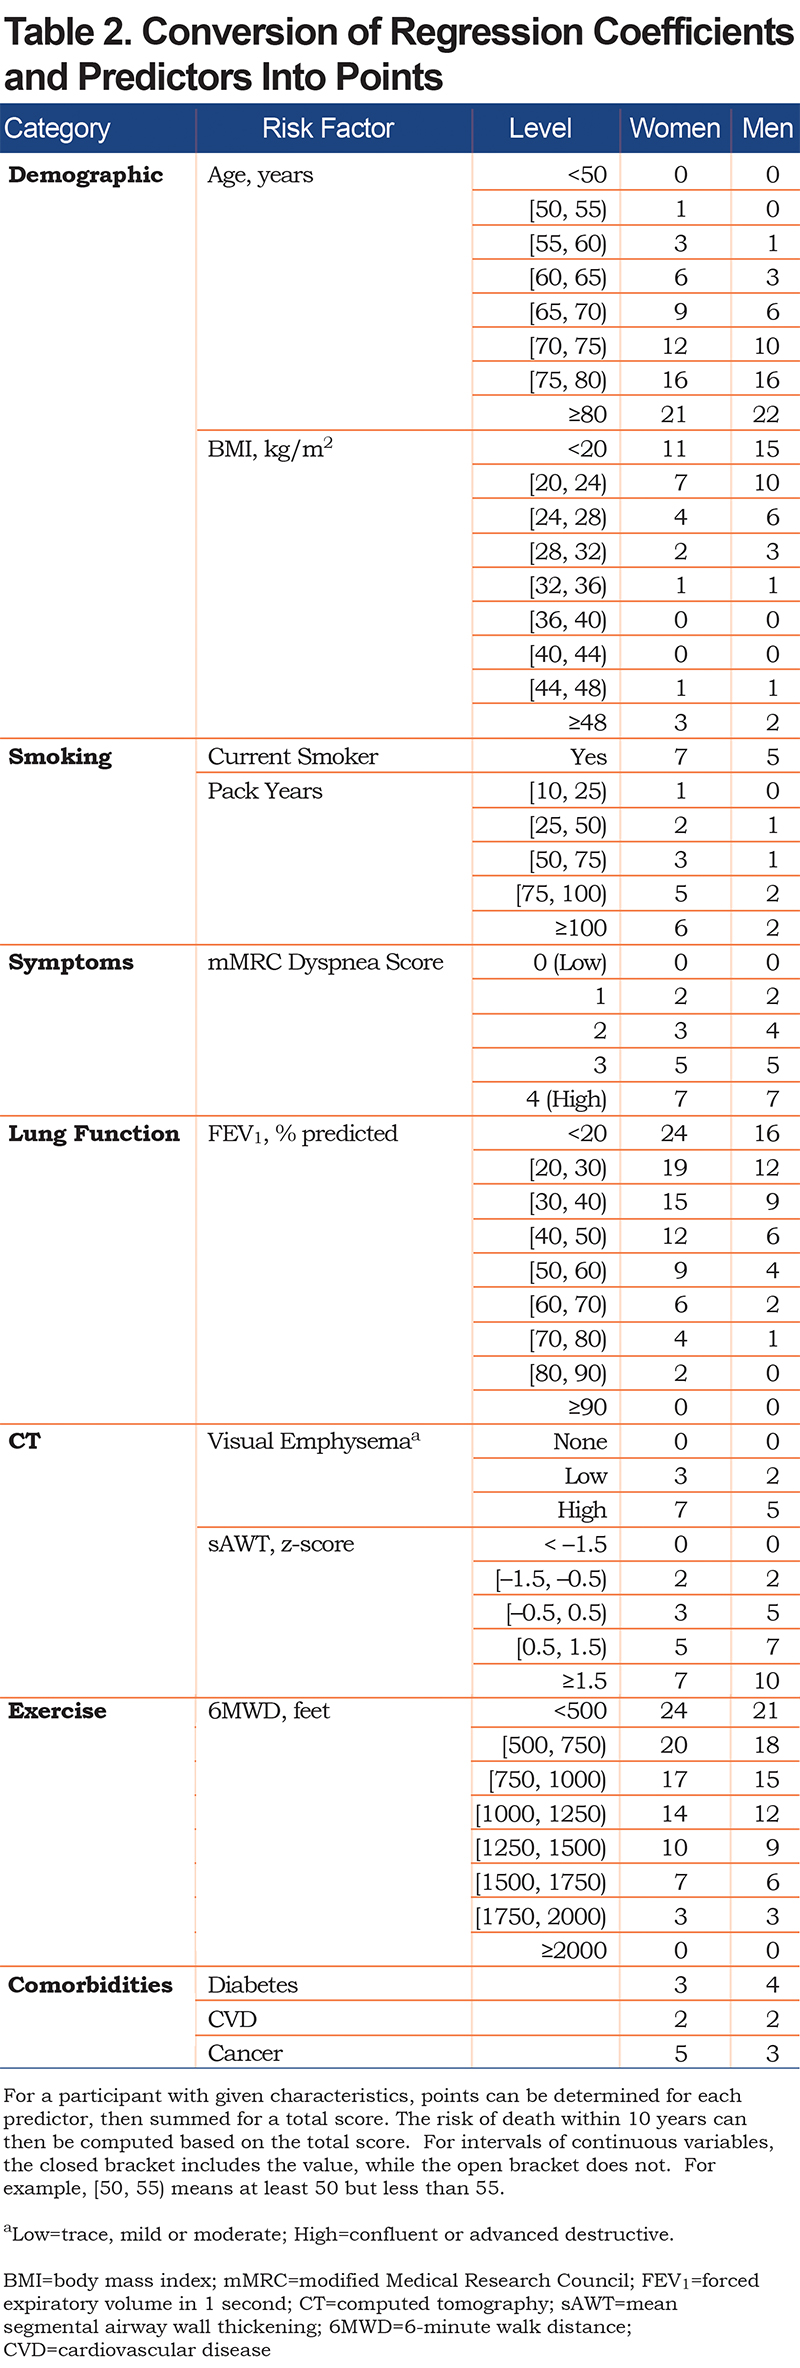
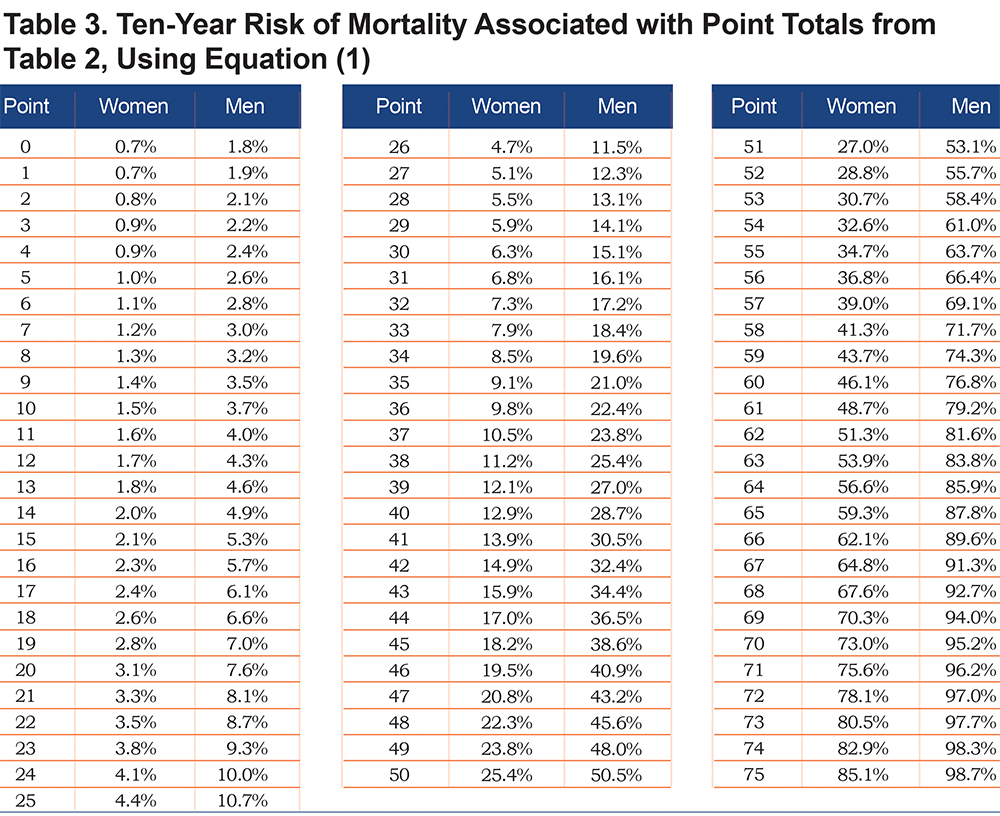
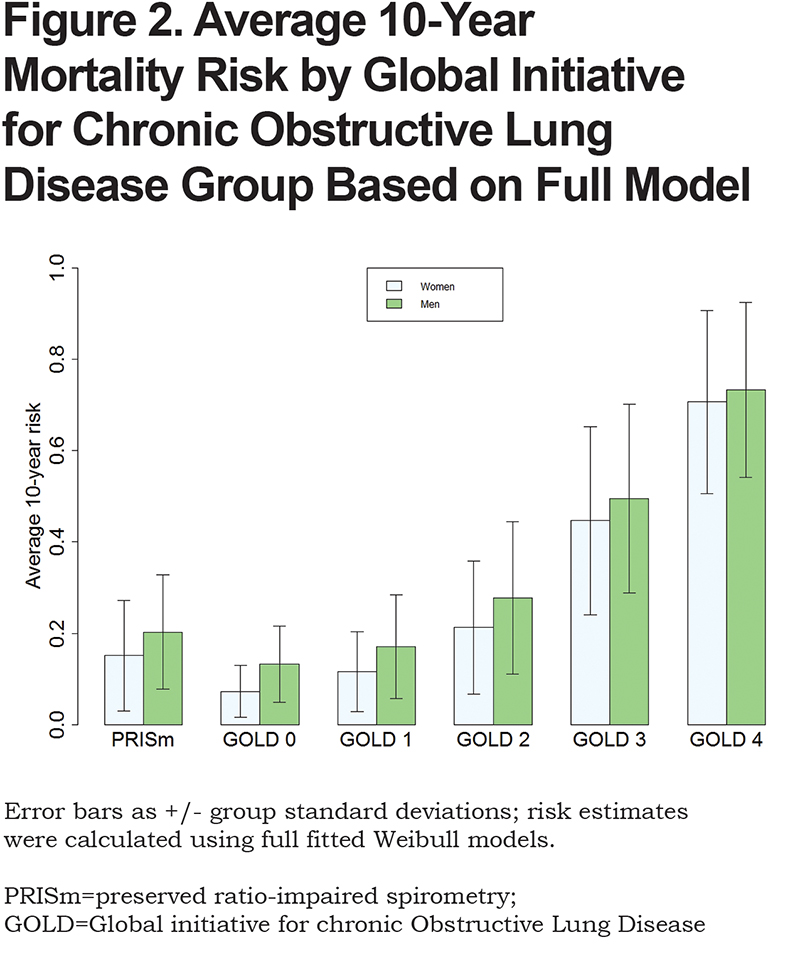
Using the parameter estimates from Table S3, the linear predictor (combination of slopes and predictors) was converted to points as shown in Table 2; this table also shows relative impact of predictors for men versus women. For both sexes, age, FEV1 and 6MWD had the greatest impacts when considering the range of point values. Point values can be converted to risk estimates using Table 3; examples to illustrate are given in Appendix B (in the online data supplement) that show calculations using the exact linear predictor as well as using the point scoring system. Figure 1 illustrates mortality risk estimates by sex and smoking status (former, current), for years followed between 0 and 10 years. Current smokers at baseline had about a 4% higher risk of mortality by 10 years, as compared to former smokers for both men and women, controlling for other predictors in the model. Estimates were plotted for participants aged 60 with BMI of 28 kg/m2, no comorbidities, 40 pack years, low emphysema, an mMRC dyspnea score of 1 and average values of FEV1=75% predicted, sAWT=0 (z-score) and 6MWD=1350 feet.

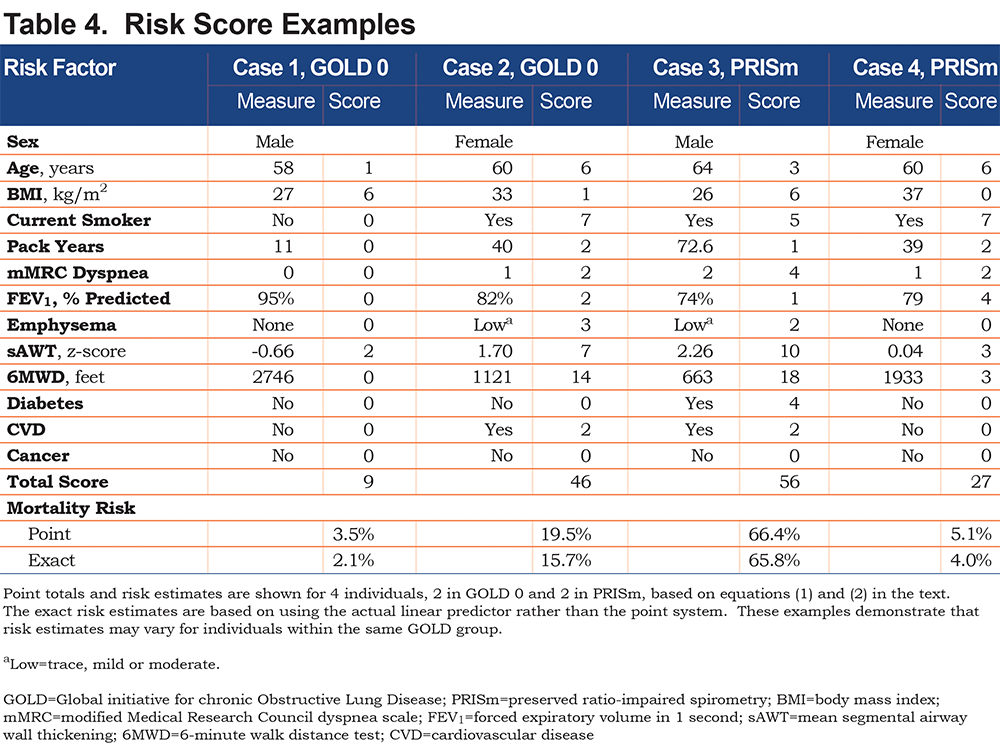
Using the fitted models, it is clear that risk estimates may vary for participants within the same GOLD class. To illustrate, consider 2 different GOLD 0 participants as shown in Table 4. The first participant is a 58-year-old former smoking male in relatively good health, with a predicted risk of mortality within 10 years of 2%. The second GOLD 0 participant is a 60-year-old female who has a substantially higher risk that can primarily be attributed to lower 6MWD, current smoking and higher sAWT; her 10-year mortality risk is 16%. Similarly, 2 participants within PRISm are shown to have highly varying risks based on their characteristics. In this case, both participants are current smokers, but the male has a higher risk (66% compared to the female’s 4% risk) due to lower 6MWD, higher sAWT, comorbidities, lower BMI (possibly indicating higher risk of cachexia), and higher symptoms and emphysema. Using the point scoring approach, the risk estimates were generally close to those of the exact approach, although somewhat higher for Case 2, which mainly occurred due to the categorical approximations for age and sAWT for that participant.
The calculated exact 10-year risk estimates for participants were summarized by standard GOLD grade classifications (Figure 2). Results demonstrate increasing mortality with increasing GOLD classification, but also demonstrate that PRISm individuals have higher risk than GOLD 1 individuals. Figures S1 and S2 (Appendix C in the online data supplement) show diagnostic results of model fits. Figure S1 shows probability plots that assess appropriateness of the Weibull distribution for the data. The majority of the points fall within the 95% confidence interval (CI) and the points are relatively straight, indicating the appropriateness of the model. Log-log plots confirmed this finding. In addition, predicted values from Weibull distribution and Cox regression models38 that used the same predictors and specifications were found to be extremely consistent (Figure S2 in the online data supplement).
Model Precision and Validation
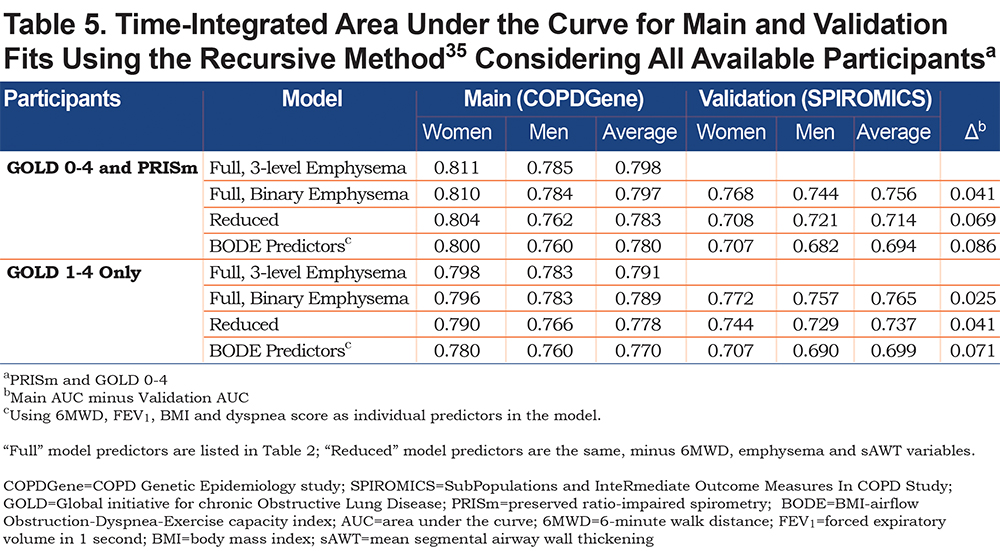
The mortality rate in the SPIROMICS cohort at 6 years was estimated to be 10% to 11%, and about 2% greater in COPDGene (adjusting for censored data); the maximum follow-up time in SPIROMICS was 7.3 years for full and reduced model-restricted data, and over 3 years longer in COPDGene. Table 5 contains time-integrated AUC statistics to help assess predictive ability of the models. For the COPDGene cohort (training data), the AUC for the full model with the 3-level emphysema variable was 0.798 averaged over women and men (0.811 for women, 0.785 for men) and 0.780 using BODE predictors (0.800 for women, 0.760 for men). When using the COPDGene model fit to determine AUC for the SPIROMICS cohort (external validation), there was only a 0.04 unit drop in AUC for the full model (0.756 average, compared with 0.797 for the training model that used the binary visual emphysema variable). When considering only GOLD 1-4 participants, the full training model yielded an AUC of 0.791, while using BODE predictors achieved 0.770. Using the 3-level visual emphysema variable provided small but consistent gains over the binary version (p=0.01 for men and p=0.006 for women using chi-square tests).
Fitting a Model with a Reduced Set of Predictors
Given not all participants had CT or 6MWD data, we refit Weibull models after removing these variables, which elevated the total sample size to 9867. Model fit information is shown in Appendix C, Table S4 and associated point values and risk estimates are given in Tables S5 and S6 (in the online data supplement). The full model point scores are also given in Table S5, for comparison. Table S5 demonstrates that when predictors are removed from the model, other predictors “step up” with higher weighting, including smoking variables, dyspnea and FEV1. For the COPDGene cohort, there was little loss in AUC when restricting the model predictors, with differences within a percentage or 2. However, validation time-integrated AUC was lower in reduced models compared to the full model (0.756 for full model; 0.714 for reduced, averaging over men and women), suggesting that the model with the full set of predictors may be more generalizable (Table 5). The full models had significantly improved fits compared with the reduced models (p<0.001; chi-square test using the difference in -2 log likelihoods, for both men and women).
Missing Data and Participants Lost to Follow-up
A total of 10,198 participants in the COPDGene cohort were available for analysis. Of these, 9867 participants had complete information at baseline for reduced model fits, and 9074 had complete information for the full model fits (the difference being that 793 were missing either the CT variables or 6MWD, or both). A total of 249 participants were lost to contact after baseline, and 875 participants had follow-up, but did not have complete information on all variables at baseline in the full model. Additional analyses were conducted to determine the characteristics of the 249 lost to follow-up versus the 9074 available for full model fits. Relative to those available for model fits, those lost to follow-up had higher smoking rates (85% versus 52%) but fewer pack years (geometric mean of 31 versus 38), lower rates of CVD (37% versus 49%,) and cancer (1% versus 5%), were younger (mean age of 53 versus 60), had lower mean BMI (27.7 versus 28.8 kg/m2), higher FEV1 (83% versus 77% predicted) and lower 6MWD (1278 versus 1362 feet). For these comparisons, p<0.01 for chi-square or t-tests, as appropriate. For dyspnea score, emphysema presence and sAWT, differences were not significant (p>0.05).
Discussion
Using multiple risk factors and survival follow-up in current and former smokers with COPD, we have developed a risk prediction model for all-cause mortality up to 10 years, with a point scoring system that can be easily implemented in clinical settings. This risk model was created using a parametric survival modeling approach, with the Weibull distribution. Although less common than Cox regression models that estimate hazard ratios, parametric survival models have a clear linear predictor for which it is arguably easier to develop a point system, particularly in consideration of any hypothetical settings of covariates and for any length of time of interest (within 10 years of observation for our models). In fact, we found fits using both methods yielded similar results in terms of predicted risk values, further supporting the adequacy of the parametric survival modeling. It should be emphasized that exclusion of predictors from final models does not mean that they are unrelated to mortality, but indicates that the excluded predictors did not account for enough information about mortality to improve prediction beyond what was already provided in the current models.
Risk prediction models have been developed and used widely for other diseases or processes, but relatively few have been developed for COPD (e.g., BODE score models). Here, we present risk models for COPD that utilized data from a large cohort of current and former smokers and an array of risk factors. These models will allow physicians and patients to better understand factors affecting risk of an adverse event, some of which may be modifiable. This can enable discussions about the benefits of altering modifiable risk factors to reduce risk of an adverse event or allow clinicians to make recommendations for further treatment. More generally, the risk estimates can be used to target groups of individuals for future clinical trials, including those not currently classified as having COPD based on GOLD criteria.
Risk estimates are determined using a finite set of predictors, and inclusion of other information could change these risk estimates for individuals. Thus, 2 individuals with the same initial risk estimates could be found to have different risk estimates if new predictors were added to the model. Further, the risk model does not directly predict whether a given individual will or will not die in a certain time frame. Rather, it can be interpreted as the expected proportion of individuals with the same characteristics as the one under consideration that will die within that time frame.
In our model, some risk factors such as smoking, 6MWD and BMI are clearly modifiable, while others are not (e.g., age); and some may be modifiable, but more indirectly, (e.g., FEV1). Our model cannot directly determine the impact of modifying predictors on risk, as within-individual changes were not considered in this analysis. In addition, risk factors in the model do not necessarily have causal interpretations, particularly when considered individually. For example, BMI was observed to have an inverse relationship with mortality rate until the BMI reached fairly high levels. (Based on the derivative of the quadratic function for BMI, the lowest estimated mortality rate occurred at BMI levels of about 40 kg/m2 in the full models, while it was about 35 kg/m2 in the reduced models, for both men and women.) What is likely occurring is that in the full model, 6MWD accounts for some of the negative health impacts of a high BMI, and the remaining effect of the BMI predictor in that model then mainly accounts for the negative impact of a lower BMI associated with cachexia.
There are many approaches that can be taken for selection of predictors in regression or survival models. Some of the current approaches involve machine learning9 or lasso regression techniques.39-41 Moll et al9 (2020) used random forests for variable selection, then fit a Cox regression model using these variables with the same cohort, but focused on GOLD 2-4 individuals. Here, we used goodness-of-fit statistics and predictor p-values to quantitatively assess models, but also constrained model selection so that at least 1 predictor was included from each major category, capturing different facets of COPD.
Since the study is observational in nature, current methods do not easily allow us to estimate causal effects of factors such as smoking cessation. This is illustrated by fitting risk models using current smoking status as the sole predictor, for which smoking appears to be protective; clearly this is due to the types of participants who are enrolled and remain in the study, including the fact that no non-smokers were included. Still, benefits of smoking cessation are reflected in the full and reduced multivariable risk models, and it is possible that additional benefits of smoking cessation are captured by other predictors. For example, quitting smoking may allow participants to have higher FEV1 and 6MWD values. The model confirms that lower smoking levels (either lower pack years or quitting altogether) were associated with increased survival rates. The point value for the 10-25 pack-year smoking range (Table 2) was 0 for men and 1 for women, and for 25-50 was 1 and 2 for men and women, respectively. There are a few cautions against interpreting these results to mean that relatively low smoking levels do not (substantially) increase mortality risk. First, our model had 2 smoking-related predictors, current smoking status and pack years, which should be considered jointly. Clearly, the current smoking status predictor demonstrated that smoking cessation had a strong and significant reduction in mortality risk, and this predictor was more significant in the model (much larger test statistic value) than pack years. Second, since the reduced model showed stronger effects for the pack-years variable, it is possible that the additional predictors (emphysema, sAWT and 6MWD) partially accounted for effects of smoking in the full model. Also, we observed a higher dropout rate for current smokers in our study, which could reduce the magnitude of smoking impact in our results. Finally, the ability to test effects of smoking versus not smoking here is limited given that the cohort included relatively heavy smokers and not non-smokers. We tried to include an additional smoking-related variable, years since quit, but it did not provide additional predictive power beyond the 2 already in the model, and only has relevant values for former smokers.
There are some improvements that the current risk model provides relative to the BODE index,2 which is the current clinical standard. The BODE index was created as a simple point scoring system to predict risk of all-cause mortality within 4 years, and is based on FEV1, 6MWD, dyspnea and BMI, a subset of predictors we considered in our model. This index was created based on individuals in several countries and was validated prospectively (unlike our analysis), but was based on a smaller cohort that did not include GOLD 0 or PRISm individuals; average BMI was approximately 25 kg/m2 for their cohort, while ours was 29 kg/m2. The BODE index is summarized into an integer between 0 and 10, making it easy to use. Using FEV1, 6MWD, dyspnea and BMI as separate predictors in a risk model (i.e., the “BODE predictors” model) performed almost as well as the reduced models, and far better than models with just the summary BODE score as a predictor (not shown). However, greater differences were observed in validation AUCs, with both full and reduced models outperforming the “BODE predictors” model, but especially the full model. Our risk model was developed for a wider range of individual than BODE, which considered only GOLD 1-4 individuals. Including PRISm and GOLD 0 individuals in the analysis will help identify individuals not classically defined as having COPD, who can potentially be included in clinical trials. The validation cohort (SPIROMICS) had much lower proportions of PRISm and GOLD 0 participants compared to COPDGene, and thus the reasonably high validation AUC scores further demonstrate the strength and flexibility of our predictive model.
While the full and reduced risk models performed similarly in COPDGene, predictive ability of the reduced model that excluded CT imaging and 6MWD variables was considerably lower than that of the full model in an external validation set (AUC of 0.714 versus 0.756). This suggests that the full model is more generalizable and flexible; such flexibility is desirable given the heterogeneity of COPD populations. Despite the better performance of the full model, the reduced model includes variables that can be obtained in a single office visit. Thus, the balance between prediction accuracy and ease-of-use must be weighed. But in the current age, electronic medical records and mobile/online applications allow clinicians to prioritize prediction accuracy over simplicity. There are also biological reasons for considering use of the full versus reduced models. The 6MWD likely represents multiple layers of pulmonary and extra-pulmonary manifestations of COPD, and has repeatedly been shown to be one of the strongest predictors of mortality across diverse COPD populations.42-44 Quantitative CT imaging variables detect lung structural changes that can occur prior to changes in spirometry,16 and likely captures an entire subset of patients that are missed by the reduced model. The development and use of CT variables is still ongoing.45 Different algorithms have been used to create measures such as sAWT (e.g., Thirona, Vida, Slicer), making comparisons between cohorts more challenging, and quantitative airway analysis is not readily available even in most academic centers. Nevertheless, we propose that the full model be considered the ideal model and should be used if all data are available. Otherwise, the reduced model can be used for initial risk stratification. In this case, patients with elevated mortality risk based on the reduced model could subsequently obtain a 6MWD and chest CT scan, if possible, to further refine their risk estimate.
Risk points shown in Table 2 and S5 have different meanings for men versus women, since the same point total for men is associated with higher mortality risk than for women (the greater the point total, the greater the risk difference; see Tables 3 and S6). Age, FEV1 and 6MWD were observed to have the largest potential contributions to risk for both men and women, although these variables could account for other factors, and interplay between variables should be considered, as discussed above. Also noteworthy is the fact that the distribution scale parameter estimates were similar, providing an informal validation of model fits.
Some other limitations of our model other than those previously mentioned are that it was developed for a specific cohort of both current and former smokers that was enriched for COPD cases, rather than being derived for a random sample from a population, and it has not been tested in populations with other diseases that affect lung function. Also, some participants were lost to follow-up early in the study (approximately 3%) and were not included in the fit for the full model. Some characteristics did differ significantly for the 249 lost to follow-up relative to those included in the full model fit, although the differences do not make it immediately clear that they would have higher or lower 10-year mortality risk on average. For example, although the current smoking rate was higher for those lost to follow-up, they did have a higher FEV1 and were younger. Another limitation is that our outcome was risk of mortality from any cause, rather than lung-specific deaths. Many deaths from “other causes” may have been impacted by COPD, so untangling lung only deaths is a difficult endeavor. Participants in both cohorts were from North America, and certain ethnicities or races had either weak or no representation, including Hispanics and Asians.
In this article we showed 2 ways of calculating risk estimates, one using the actual linear predictors (the exact approach), and another using the point system (approximate approach). Although the exact approach is recommended, the point system provides estimates that are generally close to the exact approach. It is likely that development of mobile/online/electronic medical record -integrated applications will facilitate the use of the exact calculation, but the point system is effective in identifying relative impact of various predictors of risk in the model. Enabling a “hand-calculation” can be helpful in clinical settings to understand how different predictors contribute to total risk. It is also helpful in understanding how joint changes in predictors may influence risk.
In summary, we developed a risk prediction model for mortality up to 10 years among current and former cigarette smokers that demonstrated greater accuracy compared to BODE in both a full model using clinical, physiologic and imaging data, and in a reduced model that does not require 6MWD or CT imaging. This was validated using an external cohort. The model allows for distinction of individuals by risk within GOLD classes, including GOLD 0 and PRISm, potentially allowing clinicians to better target individuals for further therapeutic intervention. Future research could examine the performance of our tool in other cohorts.
Acknowledgements
The authors wish to thank the thousands of patients who participated in the COPDGene study over the last 10 or more years.
Author Contributions: Study conception was provided by JEH, JDC, MS, EA, KAP, EAR, DAL, KAY, MR, BJM and GLK. Statistical analysis was provided by MS with statistical summary provided by MS and KAP. Writing, revisions and editing were provided by MS, EA, MM, KAP, EAR, LPH, SPB, AMB, RC, EKS, SF, IR, HK, HBR, MO, NAH, HTG, DAL, KMK, KAY, JCS, MR, SML, GLK, MHC, MP, DLD, APC, AAD and JDC. Review was provided by FCS, IB, RPB, REK, SPP, VEO and MTD.
Declaration of Interest
The COPDGene® study is funded by National Heart, Lung, and Blood Institute grants U01 HL089897 and U01 HL089856. The COPDGene® study (NCT00608764) is also supported by the COPD Foundation through contributions made to an Industry Advisory Committee comprised of AstraZeneca, Boehringer-Ingelheim, Genentech, GlaxoSmithKline, Novartis, Pfizer, Siemens, and Sunovion.
While some individual authors of this manuscript were employed by one of the listed funders at the time the work of this study was conducted, these employment relationships did not constitute undue influence by funders. These funders have had no official role in the collection, management, analysis and interpretation of the data or design and conduct of the study. All authors have completed a Conflict of Interest form, disclosing any real or apparent financial relationships including receiving royalties, honoraria or fees for consulting, lectures, speakers’ bureaus, continuing education, medical advisory boards or expert testimony; receipt of grants; travel reimbursement; direct employment compensation. These disclosure forms have been filed with the Chronic Obstructive Pulmonary Diseases: Journal of the COPD Foundation Editorial Office and are available for review, upon request, at jcopdf@copdfoundation.org.