Running Head: FEF25%-75% Linked to Emphysema and Disease Severity
Funding Support: SPIROMICS was supported by contracts from the National Institutes of Health (NIH)/National Heart, Lung, and Blood Institute (NHLBI) (HHSN268200900013C, HHSN268200900014C, HHSN268200900015C, HHSN268200900016C, HHSN268200900017C, HSN268200900018C, HHSN268200900019C, HHSN268200900020C), grants from the NIH/NHLBI (U01 HL137880 and U24 HL141762), and supplemented by contributions made through the Foundation for the NIH and the COPD Foundation from AstraZeneca/MedImmune, Bayer, Bellerophon Therapeutics, Boehringer-Ingelheim Pharmaceuticals, Inc., Chiesi Farmaceutici S.p.A., Forest Research Institute, Inc., GlaxoSmithKline, Grifols Therapeutics, Inc., Ikaria, Inc., Novartis Pharmaceuticals Corporation, Nycomed GmbH, ProterixBio, Regeneron Pharmaceuticals, Inc., Sanofi, Sunovion, Takeda Pharmaceutical Company, and Theravance Biopharma and Mylan.
Date of Acceptance: January 25, 2022 │ Published Online: February, 2, 2022
Abbreviations: forced expiratory volume in 1 second, FEV1; forced expiratory flow rate between 25% and 75%, FEV25%-75%; SubPopulations and InteRmediate Outcome Measure In COPD, SPIROMICS; percent predicted FEF25%-75%, %predFEF25%-75%; computed tomography, CT; total lung capacity, TLC; bronchodilator responsiveness, BDR; forced vital capacity, FVC; National Institutes of Health, NIH; National Heart, Lung, and Blood Institute, NHLBI; residual volume, RV; parametric response mapping functional small airways disease, PRMfSAD; square root of the wall area of a single hypothetical airway with internal diameter of 10mm, Pi10; modified Medical Research Council, mMRC; chronic bronchitis, CB; St George’s Respiratory Questionnaire, SGRQ; COPD Assessment Test, CAT; 6-Minute Walk Distance, 6MWD; pre-bronchodilator, preBD; post-bronchodilator, postBD; body mass index, BMI; BMI-airway Obstruction-Dyspnea-Exercise tolerance, BODE; emphysema, Emph; emphysema as a continuous variable, emph-C; odds ratio, OR; confidence interval, CI; lower limit of normal, LLN
Citation: Ronish BE, Couper DJ, Barjaktarevic IZ, et al. Forced expiratory flow at 25%-75% links COPD physiology to emphysema and disease severity in the SPIROMICS cohort. Chronic Obstr Pulm Dis. 2022; 9(2): 111-121. doi: http://doi.org/10.15326/jcopdf.2021.0241
Online Supplemental Material: Read Online Supplemental Material (195KB)
Introduction
Chronic obstructive pulmonary disease (COPD) affects both large and small airways with most dysfunction occurring in airways <2mm in diameter.1 Spirometry is used to diagnose airflow obstruction and grade severity in COPD, with emphasis on the forced expiratory volume in 1 second (FEV1).2 In the normal lung, FEV1 reflects both passive and active lung and chest wall recoil, reflecting resistance through both large and small airways. However, in the obstructed lung, use of FEV1 alone may underestimate the extent of small airway abnormality.1,3,4 Later parts of the exhalation curve, such as average forced expiratory flow rate between 25% and 75% (FEF25%-75%) of the vital capacity also referred to as maximum mid-expiratory flow rate are less effort-dependent and more representative of air movement through the small airways.5 FEF25%-75% has been previously accepted as a measure of small airways function, and prior studies suggested it may be abnormal in early or mild disease despite normal FEV1, forced vital capacity (FVC) and FEV1/FVC ratio.1,5,6 However, this parameter has been difficult to use clinically in the assessment of early disease at the level of the individual patient due to its high intra- and inter-user variability, and wide range of recommended normal values.7
In COPD, different processes contribute to increased airflow resistance. Small airways disease leads to airway narrowing, while increased intrathoracic pressure during forced exhalation contributes to dynamic collapse of small bronchioles, leading to air trapping. This is exaggerated in emphysema due to loss of the parenchymal elastic recoil and alveolar tethering that normally keep these airways open.1,8-13 Air trapping and hyperinflation contribute to decreased ventilatory efficiency and the sensation of dyspnea.10,11
Beyond the extensive evaluation of early disease, studies of FEF25%-75% and its relationship to clinical or radiographic characteristics of disease severity have been limited. A major goal of this study is to explore the link between structure and function in COPD as we relate FEF25%-75%, a physiological measure, to anatomical evidence of airway and parenchymal abnormality by computed tomography (CT) imaging, and to clinical parameters of disease severity, including symptoms, functional capacity, and bronchodilator responsiveness. We hypothesize that there is an inverse relationship between FEF25-75% and measures of disease severity, and that FEF25%-75% adds additional insight beyond FEV1 into the pathophysiology of COPD.
Methods
Participants
This study was conducted as part of the SubPopulations and InteRmediate Outcome Measures In COPD Study (SPIROMICS). SPIROMICS enrolled a prospective cohort of 2978 nonsmokers and ever-smokers, with and without COPD over a range of severity, to identify new COPD subgroups and intermediate markers of disease progression. Participants in 4 different groups were recruited to SPIROMICS: (1) never-smokers, (2) smokers without airflow obstruction, (3) mild/moderate COPD, and (4) severe/very severe COPD. The design of this study was approved by the institutional review boards of all participating institutions and has been described previously.14 All participants in SPIROMICs gave written consent.
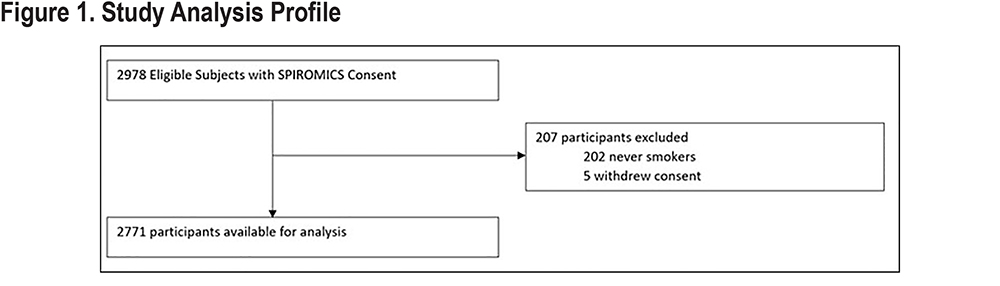
Our study included data from the baseline visit of current or former smokers, with or without COPD, from the SPIROMICS cohort (n=2771). Never smokers and those who had withdrawn consent were excluded from our analysis. See Figure 1 for the analysis profile.
Definitions and Testing Parameters
Pulmonary function testing in SPIROMICS was performed based on 2005 American Thoracic Society/European Respiratory Society (ATS/ERS) guidelines15,16 with reference values for lower limit of normal and percent predicted based on the Third National Health and Nutrition Examination Survey.17 In this analysis, COPD was defined as a post-bronchodilator ratio of FEV1/FVC less than 0.70 with severity based on previously established post-bronchodilator cutoffs for FEV1.15,16 FEF25%-75% is defined as the average forced expiratory flow rate at 25%-75% of the vital capacity5,15-17 and is expressed herein as a percentage of the predicted value (%predFEF25%-75%). Other spirometry-based measurements are also represented as percent predicted values (%predFEV1 and %predFVC). Bronchodilator responsiveness is defined as an increase in FEV1 or FVC of ≥200 mL and ≥12% relative to pre-bronchodilator values, based on the ATS definition.2,16
In SPIROMICS, baseline visit CT imaging was performed at both maximum inspiration (total lung capacity [TLC]) and full exhalation (residual volume [RV]) with co-registration of images allowing for voxel matching using a previously published protocol.14 Emphysema was defined as the percentage of voxels below -950 HU at full inspiration (TLC), with the cutoff for disease presence based on age-predicted norms.18-21 Parametric response mapping functional small airways disease (PRMfSAD), a previously recognized measure of small airways disease on imaging,22,23 was measured as the percentage of total voxels ≤ -856 HU at full expiration (RV) and > -950 HU at full inspiration (TLC), representing nonemphysematous air trapping. RV and TLC were estimated using CT-derived imaging parameters at full exhalation and full inspiration respectively.14 Airway wall thickness was measured using the square-root of the wall area of a single hypothetical airway with an internal diameter of 10 mm (Pi10).9,19-29
Statistical Analysis
We fit logistic regression models to evaluate %predFEF25%-75% as the independent variable relative to the following dichotomous variables at baseline: modified Medical Research Council (mMRC) dyspnea scores (converted to a dichotomous variable by grouping mMRC scores 0–1 to indicate no clinically relevant dyspnea and mMRC scores 2–4 to indicate clinically relevant dyspnea), chronic bronchitis (CB) as determined by the St George’s Respiratory Questionnaire (SGRQ), bronchodilator responsiveness (BDR) and presence of emphysema on CT. BDR represents a change in either FEV1 or FVC based on the above ATS definition.
We fit linear regression models to evaluate %predFEF25%-75% as the independent variable relative to the following dependent continuous variables at baseline: COPD assessment test (CAT) score, 6-minute walk distance (6MWD), extent of emphysema on CT represented by a continuous variable, PRMfSAD, SGRQ scores, and CT-derived parameters including RV, TLC, RV/TLC ratio, and airway thickness (Pi10).
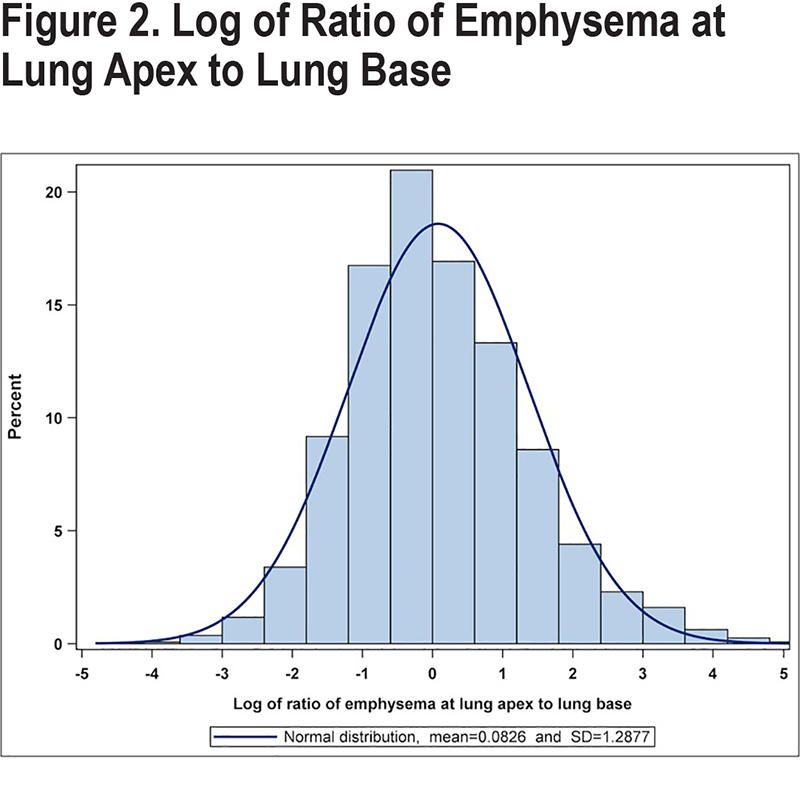
Our preliminary analysis of %predFEF25%-75% and emphysema as a categorical variable suggested that emphysema distribution (homogeneous versus heterogeneous) may influence the association. We, therefore, performed a secondary analysis to evaluate this further. We plotted the distribution of emphysema as the log of the ratio of emphysema at the lung apex to the lung base (Figure 2). Based on this population distribution and to account for the clinical importance of apical versus Basilar emphysema for advanced management of COPD,30 we developed a definition of homogeneous disease as the absolute value of the log of the ratio within 1 standard deviation (1.3) of the mean. Those with the log of the ratio outside this distribution were considered to have heterogeneous disease that was either apical predominant (>1.3) or basilar predominant (<-1.3). We then evaluated the effect of emphysema distribution by adding an indicator of homogeneous versus heterogeneous distribution as a categorical interaction variable to the logistic regression model of %predFEF25%-75% and emphysema as a dichotomous variable.
Both pre-bronchodilator (preBD) and post-bronchodilator (postBD) values were studied. Given the similarity between our findings, we present the postBD analyses. PreBD analyses are presented in e-Table S1 in the online supplement. All analyses were evaluated per 10 percentage point reduction in %predFEF25%-75% and were adjusted for smoking pack-year history. Since predicted values already account for age and sex-related differences, our data also account for these confounders.
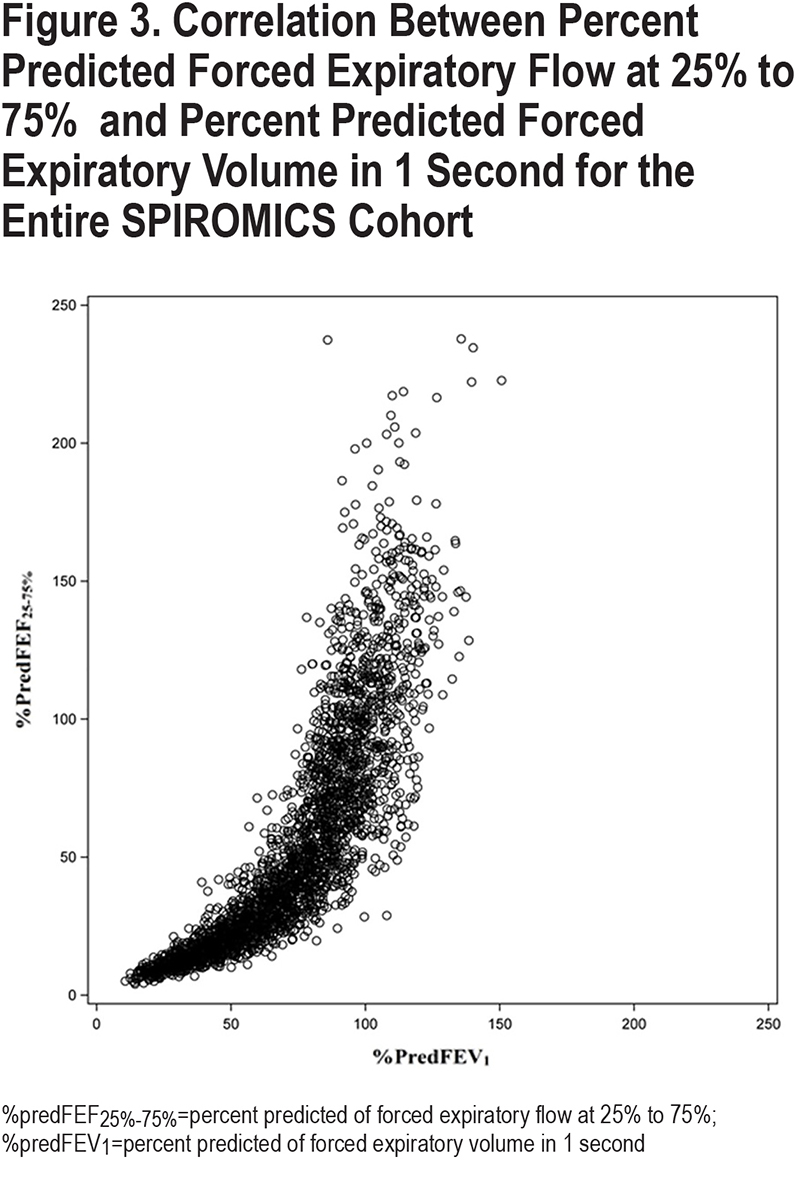
During analysis, we noticed many of our linear models were strongly influenced by the addition of %predFEV1. To determine the collinearity between %predFEF25%-75% and %predFEV1, we plotted the correlation between the values for the entire SPIROMICS cohort at baseline and found a nonlinear relationship (Figure 3). To account for this nonlinear relationship, and to ensure our findings were not due to disease severity reflected by FEV1, all analyses were adjusted for %predFEV1 and the square of %predFEV1. The results of our original post-bronchodilator linear model are included in the e-Table S2 in the online supplement.
As a measure of mid-expiratory flow rate, %predFEF25%-75% may be highly affected by FVC. To confirm our findings were not attributable to the FVC, we separately adjusted select associations (emphysema, BDR, PRMfSAD, and TLC) for %predFVC and its square instead of %predFEV1 (online supplement, e-Table S3).
Analyses were conducted using SAS v 9.4 (SAS Inc., Cary, North Carolina). Two-sided p-values < 0.05 were considered statistically significant.
Results
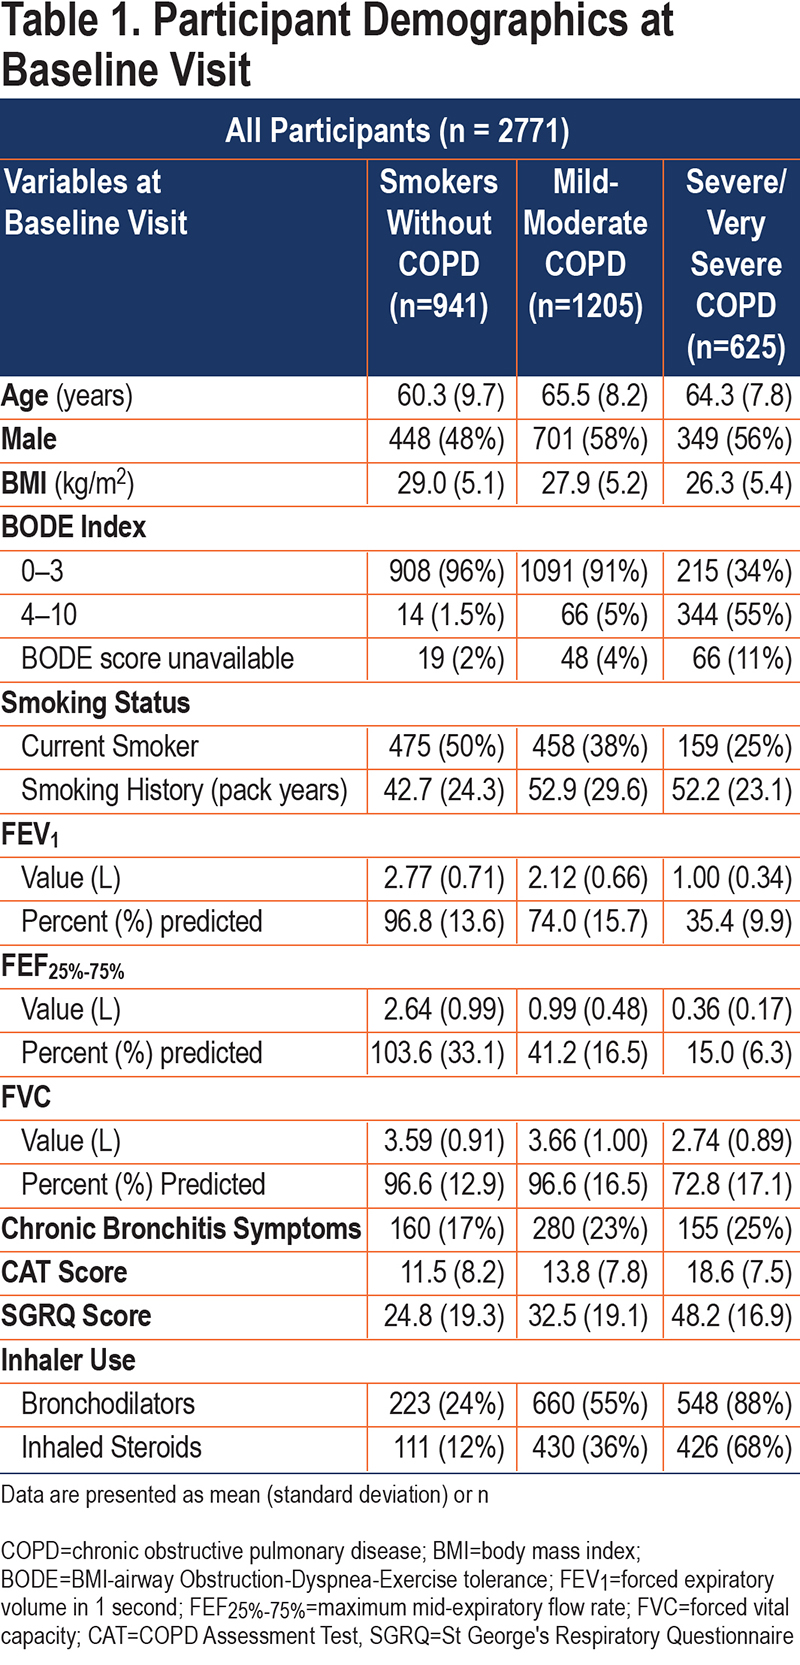
The baseline characteristics of our study cohort are presented in Table 1. Those with obstruction tended to be older, more symptomatic, and included a lower percentage of women than those without overt obstruction.
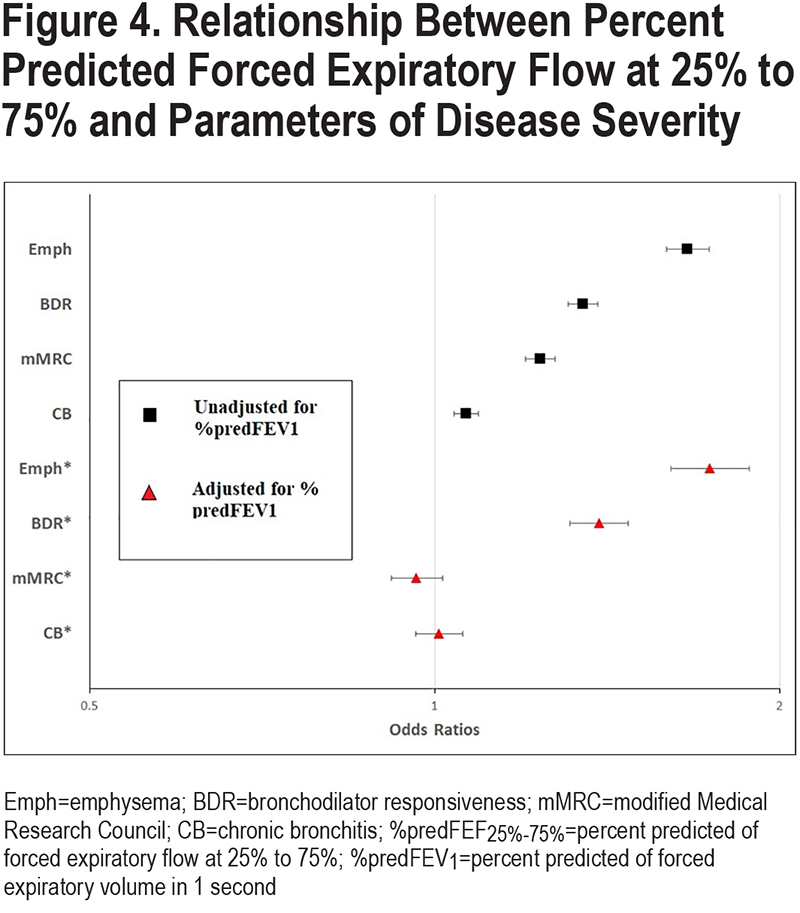
The relationships between %predFEF25%-75% and parameters of disease severity are presented in Table 2, with select relationships (based on categorical variables) shown in Figure 4. Odds ratios and beta estimates are all expressed per 10 percentage point change in %predFEF25%-75%. Due to similarities in findings using pre- and post-bronchodilator values, only post-BD analyses are represented here unless otherwise stated. Pre-BD analyses are available in e-Table S1 in the online supplement.

Imaging Parameters of Smoking-Related Lung Disease
A lower %predFEF25%-75% was associated with increased odds of having emphysema on CT scan (odds ratio [OR] 1.663, 95% confidence interval [CI] [1.593, 1.736], p<0.0001), as well as increased extent of emphysema (analyzed as a continuous variable) (estimate 1.318, 95% CI [1.237, 1.398], p<0.0001). To understand the contribution of distribution of disease to this relationship, we included distribution of emphysema as an interaction variable in the categorical analysis. A lower %predFEF25%-75% was more strongly associated with a homogeneous distribution of emphysema versus a heterogeneous distribution (homogeneous OR 1.755, 95% CI [1.661, 1.853], versus heterogeneous OR 1.483, 95% CI [1.383, 1.591], p=0.0002).
A lower %predFEF25%-75% was also significantly associated with increased functional small airways disease (PRMfSAD) on CT imaging (estimate 2.273, 95% CI [2.154, 2.392], p<0.0001).
Regarding CT-measured lung volumes, a lower %predFEF25%-75% was significantly associated with a higher TLC (estimate 75.054, 95% CI [63.184, 86.924], p<0.0001) and RV (estimate 146.206, 95% CI [137.365, 155.048], p<0.0001) resulting in a very small, but significant, inverse relationship with the RV/TLC (estimate 0.020, 95% CI [0.019, 0.021], p<0.0001).
A lower %predFEF25%-75% was also weakly, but significantly, associated with increased airway thickness as measured by Pi10 (estimate 0.002, 95% CI [0.001, 0.002], p<0.0001).
Symptoms, Functional Capacity, and Bronchodilator Response
%PredFEF25%-75% was significantly and inversely associated with symptoms and directly associated with functional capacity. In analyses unadjusted for %predFEV1, lower %predFEF25%-75% was significantly associated with the increased presence of dyspnea as indicated by higher mMRC dyspnea scores (OR 1.237, 95% CI [1.201, 1.275] p<0.0001), increased presence of chronic bronchitis symptoms (OR 1.065, 95% CI [1.040, 1.092] , p<0.0001), higher CAT scores (estimate 0.647, 95% CI [0.574, 0.720] , p<0.0001), higher SGRQ scores (estimate 2.086, 95% CI [1.910, 2.263], p<0.0001) and a decreased 6MWD (estimate -6.724, 95% CI [-7.810, -5.639], p<0.0001) at the baseline visit. A lower %predFEF25%-75% was also associated with significantly higher odds of having a BDR at the baseline visit (OR 1.347, 95% CI [1.308, 1.387], p<0.0001).
Influence of %PredFEV1
We next explored the relationship between %predicted FEF25%-75% and %predFEV1 to determine whether the above relationships between %predFEF25%-75% and disease characteristics were simply a reflection of overall lung function decline as measured by FEV1. Figure 3 shows the correlation between %predFEF25%-75% and %predFEV1 for the whole SPIROMICS cohort. As expected, we found a strong correlation between %predFEF25%-75% and %predFEV1, especially when disease is more severe. There was greater spread between values for %predFEF25%-75% and %predFEV1 when disease was less severe, especially when values of %predFEV1 were in the normal range. We then adjusted all associations for %predFEV1 Table 2; categorical variables represented in Figure 4). Select associations (categorical emphysema, bronchodilator response, PRMfSAD, and TLC) were adjusted separately for %predFVC.
The association between %predFEF25%-75% and emphysema as a categorical variable remained significant after adjustment for either %predFEV1 (adjusted OR 1.740, 95% CI [1.607, 1.883], p<0.0001; Table 2 and Figure 4) or %predFVC (adjusted OR 1.761, 95% CI [1.674, 1.853], p<0.0001; e-Table S3 in the online supplement). In the analysis of emphysema as a continuous variable, this effect was tempered by the adjustment for %predFEV1, but remained significant (estimate 0.580, 95% CI [0.449, 0.711], p<0.0001). The relationship between %predFEF25%-75% and emphysema distribution (homogeneous versus heterogeneous) remained following adjustment for %predFEV1, with homogeneous distribution remaining more strongly associated than heterogeneous disease (adjusted homogeneous OR 1.809, 95% CI [1.660, 1.971] versus adjusted heterogeneous OR 1.590, 95% CI [1.447, 1.748], p=0.0026).
The relationship between %predFEF25%-75% and PRMfSAD persisted when adjusted for %predFEV1 (adjusted estimate 1.533, 95% CI [1.323, 1.743], p<0.0001), as did the relationship with TLC (adjusted estimate 124.611, 95% CI [102.344, 146.879], p<0.0001) and with RV (adjusted estimate 81.965, 95% CI [67, 32.095], p<0.0001). When adjusted for %predFVC, both PRMfSAD and TLC remained significant (adjusted PRMfSAD estimate 2.151, 95% CI [2.022, 2.279], p<0.0001;adjusted TLC estimate 95.612, 95% CI [82.905, 108.319], p<0.0001) ( e-Table S3 in the online supplement).
The relationship between %predFEF25%-75% and BDR was retained after adjustment for %predFEV1 (adjusted OR 1.392, 95% CI [1.312, 1.477], p<0.0001; Table 2 and Figure 4) as well as %predFVC (adjusted OR 1.397, 95% CI [1.351, 1.444], p<0.0001); (e-Table S3 in the online supplement).
Conversely, the relationships between %predFEF25%-75% and respiratory symptoms, including functional capacity, were no longer significant following adjustment for %predFEV1, suggesting %predFEF25%-75% contributes similar, but not additional, information beyond %predFEV1 in predicting symptoms of COPD. The addition of %predFEV1 to the model for Pi10 negated the relationship. Further inquiry revealed this was a result of the strength of the effect of %predFEV1. No further conclusions could be made from this association in this setting.
Discussion
COPD is a heterogeneous condition, with great variation in anatomical derangement, clinical symptoms and long-term outcomes. While most studies focus on FEV1 as a marker of disease severity, this parameter is clearly limited in its ability to represent the variety seen in COPD patients. FEF25%-75% remains an understudied and undervalued spirometric tool that can help bridge this gap. Past studies of FEF25%-75% have focused extensively on its use as a predictor of early small airways disease.1,5,7,9 The present study offers the clinician new insight into the interaction between distal pathologic changes, as captured by CT scan, and physiologic changes in spirometry, beyond those represented by the FEV1.
Our analysis supports a strong relationship between a lower %predFEF25%-75%, homogeneous emphysema, and hyperinflation by TLC, independent of the %predFEV1. These relationships likely reflect loss of elastic recoil and alveolar tethering attributable to emphysema, resulting in airflow limitation at the level of the small airway. Individuals with homogeneous emphysema are known to have more severe dynamic hyperinflation, decreased exercise tolerance, and more severe clinical outcomes compared to those with heterogeneous disease.8,13 The %predFEF25%-75% is, therefore, a powerful resource for improving our knowledge and understanding of the underlying mechanisms that produce clinical disease and provides information beyond that provided by %predFEV1.
While the %predFEF25%-75% is also associated with significantly worse symptoms in our cohort, it does not provide additional information beyond that captured by the %predFEV1.
Clinical outcomes and symptoms in COPD are influenced by multiple factors, including bronchodilator response. Although COPD is defined as airflow obstruction that is not fully reversible with a bronchodilator, individuals with COPD can respond symptomatically to inhalers in the absence of spirometric change.10,11,31 Prior studies suggest that small airways disease and bronchodilator response may be associated, and that participants who are older, female, and have more severe disease show less bronchodilator response.12,32 The pathophysiology behind this association is not well understood. Bronchodilators are thought to improve symptoms by decreasing lung hyperinflation.10,11,31 Our findings of an inverse association between %predFEF25%-75% and BDR support the idea that bronchodilators may decrease air trapping in peripheral airways, mitigating the effect of loss of elastic recoil from emphysema.
Our study has several strengths. SPIROMICS is a large cohort of well-characterized participants across a wide range of disease severity. Rigorous protocols are implemented to confirm the quality, validity, and reproducibility of spirometry, and imaging is performed and analyzed using state-of-the-art technology and image processing techniques. These protocols may not be available to all clinical practices and represent both a strength and a limitation for extrapolation to general clinical practice. A particular strength in our analysis lies in our assessment of the effect of multiple confounding parameters, allowing for a more detailed analysis of FEF25%-75% in COPD.
Limitations of this study include the broad limitations of SPIROMICS data and specific limitations inherent to our analysis. The definition of COPD remains controversial.33 This analysis uses the cutoff of post-bronchodilator FEV1/FVC <0.70, cited by the Global Initiative for Chronic Obstructive Lung Disease34 and often used in large databases, but which may underestimate COPD in the younger population while overestimating prevalence in the elderly.35 In clinical practice, physicians are encouraged to use the lower limit of normal (LLN), which represents the 5th percentile of a normal distribution,2 although a cutoff of 0.70 may be more indicative of clinically relevant disease.36 While LLN data are available in SPIROMICS, a cutoff of 0.70 for the FEV1/FVC was used to improve comparability with past studies. Measurement of %predFEF25%-75% has inherent limitations as well. Although the repeatability for a single participant was high in the SPIROMICS cohort,37 our assessment of the correlation between %predFEF25%-75% and %predFEV1 in the full cohort shows a distinct, nonlinear relationship with high variability. There is especially marked variability of %predFEF25%-75% values when FEV1 values are ≥80% predicted. With several FEF25%-75% values well above 100% predicted, this finding suggests the utility of the current predictive equations for %predFEF25%-75% may be limited.
Our analysis of %predFEF25%-75% provides new insight into the relationship between structure and function in COPD. A lower %predFEF25%-75% is strongly associated with more severe COPD in multiple domains, providing new understanding of the contributing pathophysiologic and anatomic abnormalities that lead to clinical outcomes in COPD.
Acknowledgments
Author Contributions: BR, DC, LAB, and RP were involved in the design of the analysis.
DC, LAB had full access to the data and assures the accuracy of the results.
BR, RP contributed to the drafting of the manuscript. BR, DC, IB, CBC, REK, CSP, VK, JMW, MKH, PW, VEG, SPP, EAH, RGBu, BAD, DPT, TGL, LAB, JDS, FM, RGB, NNH, APC, SIR, MA, and RP were involved in the editing of the manuscript. All authors approved this version of the manuscript for submission.
Data Availability: Information about how to access SPIROMICS data is available at www.spiromics.org.
The authors thank Miguel Quibrera, Lisa Gravens-Mueller, and David Couper in the Department of Biostatistics at the University of North Carolina at Chapel Hill in Chapel Hill, North Carolina for their help with the statistical analysis of this study. They would also like to thank the SPIROMICS participants and participating physicians, investigators, and staff for making this research possible. We would like to acknowledge the following current and former investigators of the SPIROMICS sites and reading centers: Neil E. Alexis, MD; Wayne H. Anderson, PhD; Mehrdad Arjomandi, MD; Igor Barjaktarevic, MD, PhD; R. Graham Barr, MD, PhD; Lori A. Bateman, MSc; Surya P. Bhatt, MD; Eugene R. Bleecker, MD; Richard C. Boucher, MD; Russell P. Bowler, MD, PhD; Stephanie A. Christenson, MD; Alejandro P. Comellas, MD; Christopher B. Cooper, MD, PhD; David J. Couper, PhD; Gerard J. Criner, MD; Ronald G. Crystal, MD; Jeffrey L. Curtis, MD; Claire M. Doerschuk, MD; Mark T. Dransfield, MD; Brad Drummond, MD; Christine M. Freeman, PhD; Craig Galban, PhD; MeiLan K. Han, MD, MS; Nadia N. Hansel, MD, MPH; Annette T. Hastie, PhD; Eric A. Hoffman, PhD; Yvonne Huang, MD; Robert J. Kaner, MD; Richard E. Kanner, MD; Eric C, Kleerup, MD; Jerry A, Krishnan, MD, PhD; Lisa M. LaVange, PhD; Stephen C. Lazarus, MD; Fernando J. Martinez, MD, MS; Deborah A. Meyers, PhD; Wendy C. Moore, MD; John D. Newell Jr, MD; Robert Paine, III, MD; Laura Paulin, MD, MHS; Stephen P. Peters, MD, PhD; Cheryl Pirozzi, MD; Nirupama Putcha, MD, MHS; Elizabeth C. Oelsner, MD, MPH; Wanda K. O’Neal, PhD; Victor E. Ortega, MD, PhD; Sanjeev Raman, MBBS, MD; Stephen I. Rennard, MD; Donald P. Tashkin, MD; J. Michael Wells, MD; Robert A. Wise, MD; and Prescott G. Woodruff, MD, MPH. The project officers from the Lung Division of the National Heart, Lung, and Blood Institute were Lisa Postow, PhD, and Lisa Viviano, BSN.
Declaration of Interest
RGB was supported by NIH/National Center for Advanced Translatonal Sciences grant TL1TR001883-01 and KL2TR001882 and reports personal consulting fees from GlaxoSmithKline and Mylan/Theravance Biopharma, unrelated to the submitted work. APC is a consultant for GlaxoSmithKline and a nonmonetary consultant for VIDA Diagnostics. TGL was supported by NIH/NHLBI HL125520, the CF Foundation (grants LIOU13A0, LIOU14P0, LIOU14Y4, LIOU15Y4), the Ben B. and Iris M. Margolis Family Foundation of Utah and the Claudia Ruth Goodrich Stevens Endowment Fund at the University of Utah, Salt Lake City, Utah. During the course of the study, TGL received other support for performing clinical trials from Abbvie, Inc., CFF Therapeutics, Inc., Corbus Pharmaceuticals Holdings, Inc., Genentech, Inc., Gilead Sciences, Inc., Laurent Pharmaceuticals, Inc., Nivalis Therapeutics, Inc., Novartis Pharmaceuticals, Proteostasis Therapeutics, Inc., Savara, Inc., and Vertex Pharmaceuticals, Inc. MA was supported by a research grant from the Flight Attendant Medical Research Institute. RP reports receiving grant support from the Department of Veterans Affairs (Merit Grant) and consulting fees from Partner Therapeutics for work unrelated to the current manuscript. The remaining authors have nothing to declare.