Running Head: Recommendations for Interpreting E-RS:COPD Scores
Funding Support: Evidera | PPD, who employ Nancy K. Leidy and Donald Bushnell, received funding from Novartis to conduct this review. Trial registration: MPEX: NCT00739648; AZ1: NCT00949975; AZ 2:NCT01023516
Date of Acceptance: September 19, 2022 | Published Online Date: September 21, 2022
Abbreviations: patient-reported outcome, PRO; minimal clinically important difference, MCID; minimal important difference, MID; Evaluating Respiratory Symptoms™ in COPD, E-RS:COPD; forced expiratory volume in 1 second , FEV1; EXAcerbations of COPD Tool, EXACT®; European Medicines Agency, EMA; Food and Drug Administration, FDA; patient global impression of change, PGIC; standard deviation, SD; standard error of measurement, SEM; cumulative distribution function, CDF; probability density function, PDF; effect size, EF; St George’s Respiratory Questionnaire, SGRQ; patient global impression of severity, PGIS; clinical global impression of severity, CGIS; clinical global impression of change, CGIC; randomized control trials, RCTs; forced vital capacity, FVC; 6-minute walk test, 6MWT; incremental shuttle walk test, ISWT; Breathlessness, Cough and Sputum Scale, BCSS©; patient global impression, PGI
Citation: Leidy NK, Bushnell DM, Thach C, Hache C, Gutzwiller FS. Interpreting Evaluating Respiratory Symptoms™ in COPD diary scores in clinical trials: terminology, methods, and recommendations. Chronic Obstr Pulm Dis. 2022; 9(4): 576-590. doi: http://doi.org/10.15326/jcopdf.2022.0307
Online Supplemental Material: Read Online Supplemental Material (2463KB)
Introduction
Chronic obstructive pulmonary disease (COPD) is a progressive disease characterized by airflow limitation and lung tissue destruction which are manifested in the cardinal respiratory symptoms of breathlessness, cough, and sputum production. Spirometry is a standard respiratory function test used to diagnose and monitor COPD. While spirometry is useful for evaluating the efficacy of treatments designed to reduce airflow limitation, it does not capture the severity of respiratory symptoms. In fact, studies have found weak correlations between forced expiratory volume in 1 second (FEV1) and patient reports of respiratory symptoms.1,2 These symptoms are disabling for people with COPD, impeding their ability to perform daily activities and interfering with quality of life. Clinicians include symptom severity as a key factor in patient assessment and treatment modification, and recent advances in drug development seek to address symptomatic improvement in COPD patients with novel therapeutics.3 Clearly, respiratory symptoms should be a key endpoint in trials testing products that may offer symptomatic relief to patients with COPD.
The Evaluating Respiratory Symptoms™ (E-RS) in COPD (E-RS:COPD) diary was developed to address the need for a precise measure to test the effect of treatment on the severity of respiratory symptoms in stable COPD in drug development programs. The 11 respiratory symptom items comprising the E-RS:COPD are part of the 14-item EXAcerbations of COPD Tool (EXACT®).4 The EXACT quantifies symptom severity of exacerbations, i.e., events characterized by an acute, sustained worsening in COPD beyond normal day-to-day variability. It can be used to quantify symptom severity and duration in trials enrolling patients who are acutely ill (e.g., anti-infective trials) or to capture unreported symptom-defined events or the symptomatic severity of events associated with health care utilization in longer trials, often 6 to 12 months long.5-7 The EXACT includes 3 non-respiratory symptoms that are features of exacerbations: fatigue, sleep disturbance, and worry or concern. The E-RS uses the 11 respiratory symptom items from the EXACT to yield a score representing severity of the cardinal respiratory symptoms of COPD: breathlessness, cough and sputum, and chest symptoms. This instrument was designed for use in clinical trials enrolling stable patients with COPD and evaluating the effects of treatment on respiratory symptom severity over the study period, generally 12 weeks.8,9 Both the EXACT and E-RS underwent qualification review by the European Medicines Agency (EMA) and the Food and Drug Administration (FDA) and each was approved for use as exploratory endpoints, with additional information on score interpretation in clinical trials requested by both agencies.10-12 Use of these measures as key trial endpoints would be based on specific drug development programs (contexts of use) and empirically supported recommendations for score interpretation.
Like other clinical trial endpoints, patient-reported outcome (PRO) effects are tested using statistical techniques that yield probability estimates, interpreted in terms of chance. Statistical significance does not necessarily equate to a meaningful treatment effect, however. During the evaluation of new drugs, regulatory reviewers, payers, clinicians, and patients each ask: “Does the empirically observed treatment effect provide a meaningful benefit to patients?” In pharmaceutical trials, the interpretation of clinical efficacy endpoints is often based on experiential and historical data, such as the improvement of FEV1 in COPD.13 Scores of PRO endpoints are often less intuitive. Empirically-based recommendations for PRO score interpretation address this issue. Since the E-RS:COPD was developed, terminology and regulator preferences for specific methods have evolved, which may have led to some confusion or misunderstanding regarding the proposed interpretation recommendations for this measure.
The purpose of this paper is to address confusion related to the interpretation of PROs in clinical research by clarifying the history, terminology, and methods associated with the development of score interpretation recommendations (Part 1) and applying this information to the E-RS:COPD (Part 2). For those interested in how terminology and methods have evolved over time, the paper provides this information, using the E-RS:COPD as a case example. For those interested in the interpretation of E-RS:COPD scores in clinical trials, the paper offers a summary of the methods used to derive recommendations in the context of this history, with new analyses related to the proposed thresholds.
Part 1: Terminology and Methods for Developing Patient-Reported Outcome Score Interpretation Recommendations – Historical Context
Minimal Important Difference Terminology and Food and Drug Administration Guidelines
Terminology and methods for interpreting PRO scores date back to the 1980s when the term “minimal clinically important difference” (MCID) was first proposed to refer to the “smallest difference (change) in the domain score of interest which patients perceive as beneficial and which would mandate, in the absence of troublesome side effects and excessive cost, a change in the patient’s management.”14 Using a 15-point Likert-type patient global impression of change (PGIC) (-7 “worse” to +7 “better), changes were defined as small, medium, or large, with the small change considered the MCID. In the 1990s, questions were raised about the extent to which a patient rating could be labeled a clinical variable; reference to clinical was dropped, resulting in the phrase “minimal important difference” (MID) to refer to meaningful within-patient change, and later to within-group and between-group differences.15-17 Over the years, MID (within-group change and between-group difference) values were estimated using various anchor-based approaches, including mapping changes in the PRO score of interest to other PRO or non-PRO scores, or to single-item global impressions (ratings) of change. Distribution-based methods (e.g., ½ standard deviation [SD] and standard error of measurement [SEM] of baseline scores) or empirical rules (e.g., 8% of the theoretical range) were also used.
In 2006, the FDA published a draft guidance on the use of PROs in drug development.18 This guidance described the need to interpret group-level change and between-group differences (i.e., MIDs) in clinical trials. Various anchor-based methods for deriving MIDs were discussed, including mapping changes to existing measures and the single-item global impression of change. Distribution-based methods were characterized as supportive and not appropriate as the sole source for guideline interpretation. Meaningful change in an individual’s response to treatment was also considered, with the suggestion that patients be categorized as responders to treatment, based on “pre-specified criteria backed by empirical evidence supporting the responder definition as a measure of benefit.”18 The FDA indicated they may request an a priori MID or an a priori responder definition to serve as a benchmark for interpreting PRO trial results.18
The final FDA PRO Guidance was released in 2009 without reference to the MID.19 The guidance discusses the use of responder definitions to understand and communicate treatment benefit, recommending anchor-based methods to derive these values, with distribution-based methods as supportive. Anchors should be “easier to interpret than the PRO measure itself,”19 with patient ratings of change mentioned as one approach. The final guidance also suggested visually presenting the entire distribution of change scores by anchor categories in cumulative distribution function (CDF) and probability density function (PDF) figures to further understand score interpretation. Responder thresholds may be shown along the curve to assist with interpretation.19 While not explicitly stated, approaches for estimating responder definitions are the same as methods used to estimate MIDs.20
To summarize, MID, or the occasional reference to the MCID, refers to group-level data (within-group change and between-group differences) that can be interpreted as meaningful based on empirical evidence consistent with the context of use. MID values are expressed as numeric summaries (e.g., mean) and are often used to inform power estimates for statistical analyses of between-group differences during trial design. In contrast, a responder definition refers to patient-level data, and is the threshold of within-patient change in the PRO score that can be interpreted as meaningful, again based on empirical evidence consistent with the context of use. Responder analyses are expressed as the number and percentage of responders/non-responders in each treatment group or the odds ratio of clinical benefit. For hypothesis testing to uncover and understand treatment effects, a 2-step process is often used, with group-level comparisons powered using the pre-specified MID estimate and tested statistically, followed by descriptive responder analyses to assist with interpretation when group-level effects are statistically significant.20,21
MID and responder threshold estimates for specific PRO measures can solidify or evolve over time as evidence across studies, samples, and methods converge. Because thresholds may vary across different target populations or trial designs (including placebo-controlled or active comparator studies and differing levels of background therapies), it is important to understand an instrument’s context of use and confirm or revise estimates as new contexts arise.
Methods for Estimating Minimal Important Difference and Responder Thresholds
Historically, distribution- and anchor-based methods have formed the quantitative foundation for the development of both MID and responder threshold estimates. Distribution-based methods for characterizing the magnitude of group-level change include effect size (ES), a standardized metric with generally accepted standards for small (0.2), medium (0.5), and large (0.8) effects,22 and an early empirically-based suggestion that ½ SD of baseline scores often corresponds to a medium ES of change.23 As noted previously, distribution-based methods are not used alone, but rather as part of a triangulation of evidence, i.e., an integration of results based on alternative benchmarks to arrive at the best estimate of meaningful change at the group and individual level that are not method bound.24
Anchor-based methods use clinically-based criterion variables (e.g., PRO instruments, clinical measures) or global ratings as standards against which score changes in the PRO measure of interest are evaluated. Briefly, change scores on the PRO measure of interest are computed for pre-specified levels of the anchor variable to yield group-level and patient-level threshold estimates. For an anchor to be considered useful, it must be interpretable in and of itself and correlate with the variable/score of interest (a correlation coefficient of least 0.30 is recommended).25
Two types of anchor variables are commonly used, with both considered standards in the field. The first type includes validated measures of the same or related construct with known interpretation values, including other, related PRO measures or clinical anchors. For COPD, the St George’s Respiratory Questionnaire (SGRQ), a health-status measure, is often used for this purpose, applying the widely used and accepted 4-point threshold for both MID and responder thresholds.
A second type of anchor is a single-item global assessment of severity or change, reported by the patient (patient global impression of severity [PGIS] or change [PGIC]) and/or clinician (clinical global impression of severity [CGIS] or clinical global impression of change [CGIC]). Because PROs quantify patient perception, PGIS/PGIC ratings are generally preferred. Over time, regulator preferences have evolved from construct-related anchors (related PRO or clinical measures) to simpler, single item global ratings, due in part to ease of interpretation. The preferred form of these global ratings has evolved from retrospective recall (asking patients to rate the degree of change they experienced over the course of the trial) to cross-sectional impressions, with change computation (asking patients to rate the construct [e.g., severity] at baseline and end-of-study and deriving the difference between these ratings). The preferred response scale has also changed over time, from 15-point to 7-point to 5-point and most recently to 4-point scales. The 4-point PGIS scale asks patients to rate the severity of their symptom(s) by selecting 1 of 4 response options, generally labeled None, Mild, Moderate, and Severe.26 PGIS assessments are completed at baseline and at pre-specified intervals during the trial and/or end of treatment. The difference between the 2 responses serves as the anchor for threshold estimation. Changes of 1 or 2 points (improvement or worsening) are generally considered minimal.
Over time, CDF and PDF plots have been requested by regulatory authorities and journal reviewers to provide visual representation of data to further understand and contextualize the proposed estimates.
Part 2: Development of Interpretation Recommendations for the Evaluating Respiratory Symptoms in COPD
Evaluating-Respiratory Symptom Structure
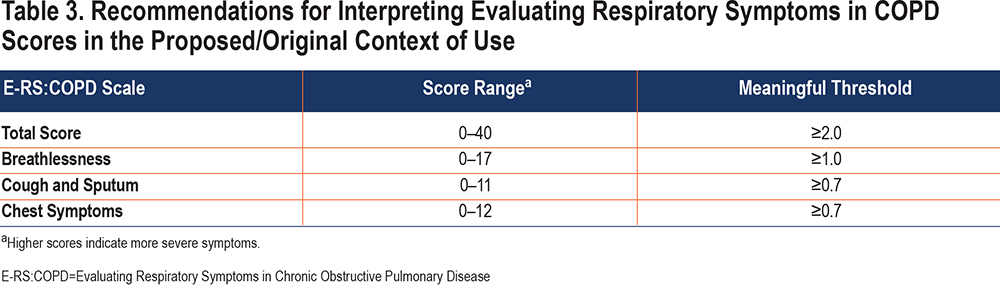
The 11-item E-RS:COPD is part of the 14 item EXACT daily diary. Study participants complete the diary each evening before bedtime, selecting answers that best describe the severity of each symptom on that day using Likert-type scales. The E-RS:COPD Total score is computed by summing responses to each question; scores range from 0–40 with higher scores indicating more severe symptoms. The 3 subscales embedded in the measure capture breathlessness (5 items; score range 0–17), cough and sputum (3 items; score range 0–11), and chest symptoms (3 items; score range 0–12).
Evaluating Respiratory Symptoms: COPD Context of Use
Recommendations for interpreting scores for a given outcome measure are directly linked to the context of use. The E-RS:COPD was designed to quantify the severity of patient-reported respiratory symptoms and test treatment efficacy in clinical trials of COPD. As noted in the regulatory qualification submissions, publications, and user manual,4,8,9 the E-RS:COPD is intended for use in trials of patients with a clinical diagnosis of COPD, 40 years of age or older, current or former smokers, with stable COPD (defined as exacerbation-free within 60 days prior to enrollment).
The E-RS:COPD was validated in samples from 4 studies (1 observational validation dataset and 3 randomized control trials [RCTs]) with the following inclusion criteria:
- Clinical diagnosis of COPD
- FEV1/forced vital capacity (FVC) ratio ≤0.70 post-bronchodilator
- FEV1 % predicted ≤80%
- ≥40 years of age
- Current or former smoker
- Smoking history ≥10 pack years
- Symptomatic: breathlessness, cough, sputum, and/or chest congestion
- ≥1 exacerbation in the previous 6 to 12 months, seen in a clinic or emergency department and treated with steroids or antibiotics or requiring a hospital admission
- No exacerbation requiring treatment within 4 to 6 weeks of enrollment
The E-RS:COPD was designed to serve as a primary or secondary efficacy endpoint in phase 2-4 RCTs evaluating the effect of treatments intended to reduce the severity of respiratory symptoms of COPD. These trials are generally 12 weeks in duration; however, the study length, number and nature of treatment arms, and specific outcome assessments and assessment intervals are determined by the sponsor, based on the target product profile, target claims, and related data requirements. Trials simultaneously examining exacerbation outcomes may last 6 to 12 months.
Content validity of the E-RS:COPD was based on qualitative research with patients in the target population and input from clinical experts.9 Quantitative measurement properties were tested in multiple datasets.8,9 These analyses provided evidence of score reliability (test-retest, internal consistency) and construct validity. Responsiveness was shown in participants experiencing meaningful improvements in health status (SGRQ for COPD) and exercise capacity (6-minute walk test [6MWT] and incremental shuttle walk test [ISWT]) over time.8
Methods for Deriving Interpretation Recommendations
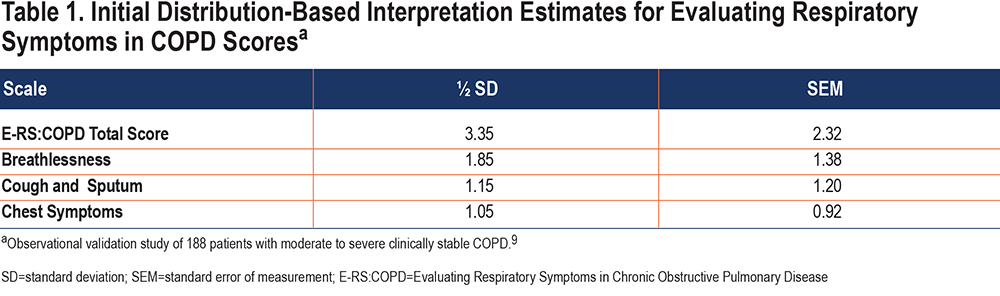
With this context of use in mind, the first evidence to guide interpretation of the E-RS:COPD score was based on data from an observational validation study of 188 participants with clinically stable COPD who completed the E-RS:COPD diary over 7 days, as part of the EXACT development study.9 This dataset was also used for the initial tests of score reliability and validity. Because of the limited 1-week observation period, analyses of change were not possible and so analyses were limited to distribution-based methods.9 The ½ SD estimates and previously unreported SEM values (SD x square root [1-α]) in this sample are shown in Table 1.
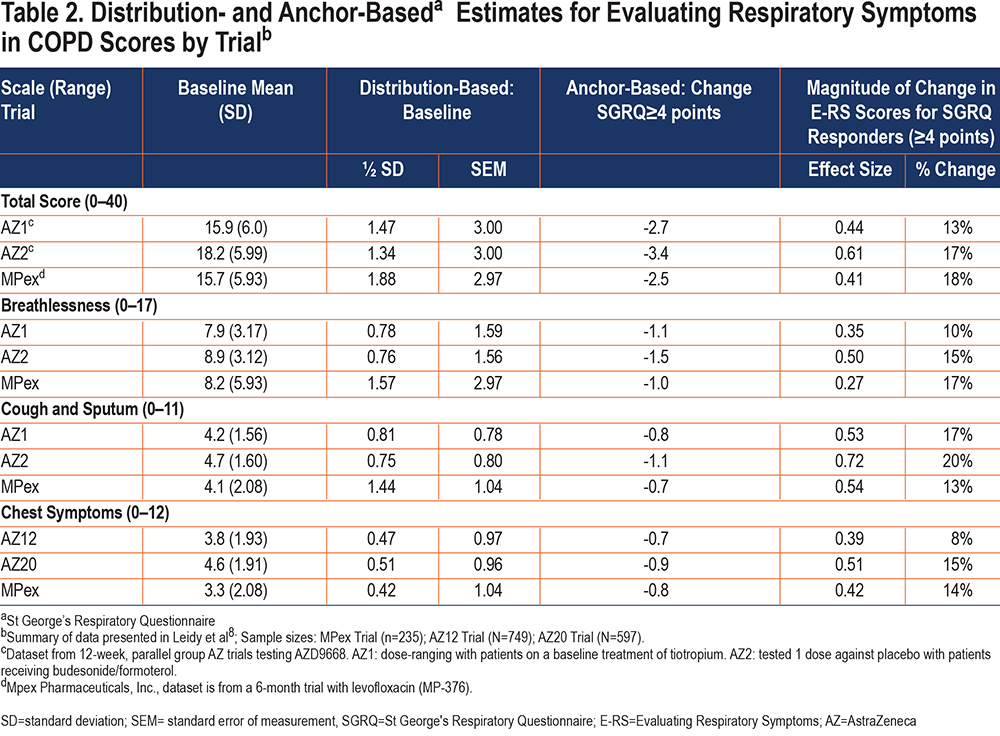
Data from 3 separate RCTs in patients with COPD from the target population were used to test the performance of E-RS:COPD and develop empirically-based recommendations for score interpretation.8 Distribution-based methods included ½ SD and SEM at baseline. Anchor-based methods included 3 criterion constructs with published thresholds for meaningful change: 2 PRO anchors (health status [SGRQ ≥4 points] and symptoms [Breathlessness, Cough, and Sputum Scale (BCSS©) ≥1 point]) and 2 clinical anchors (exercise capacity: 6MWT ≥26 meters or ISWT ≥47.5 meters). Change was examined over a period of 12 weeks. Statistical indicators of magnitude of change (ES and mean percentage change) were also computed. Given the conceptual relationship between symptom severity and health status and observed correlations greater than 0.40 between E-RS:COPD Total and E-RS subscale scores and SGRQ scores across the 3 trials (exceeding the recommended 0.30 threshold), the SGRQ was considered the best anchor for developing interpretation recommendations in the absence of patient global impression data in these trials.
A summary of the distribution- and SGRQ anchor-based estimates for E-RS:COPD scores in the 3 trials8 is shown in Table 2. It is important to note that, consistent with the triangulation approach, results from the other anchor variables (BCSS, 6MWT, and ISWT) were also considered during the development of the E-RS:COPD interpretation recommendations. Results of those analyses are reported elsewhere.8
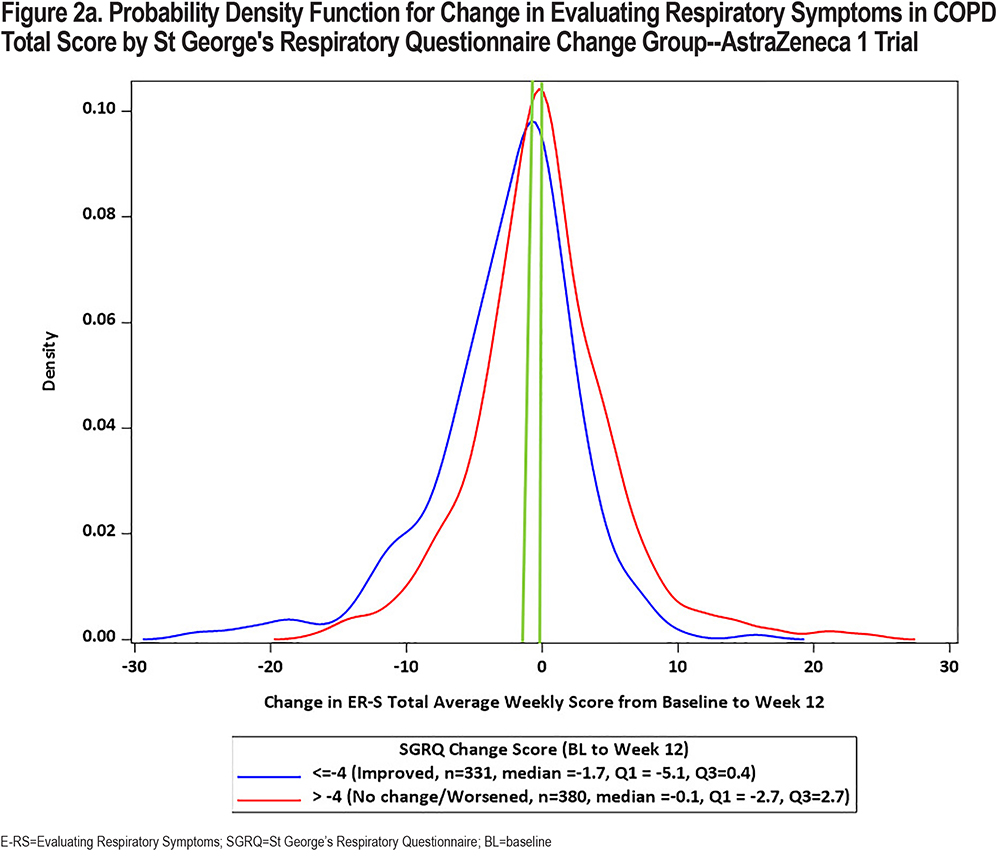
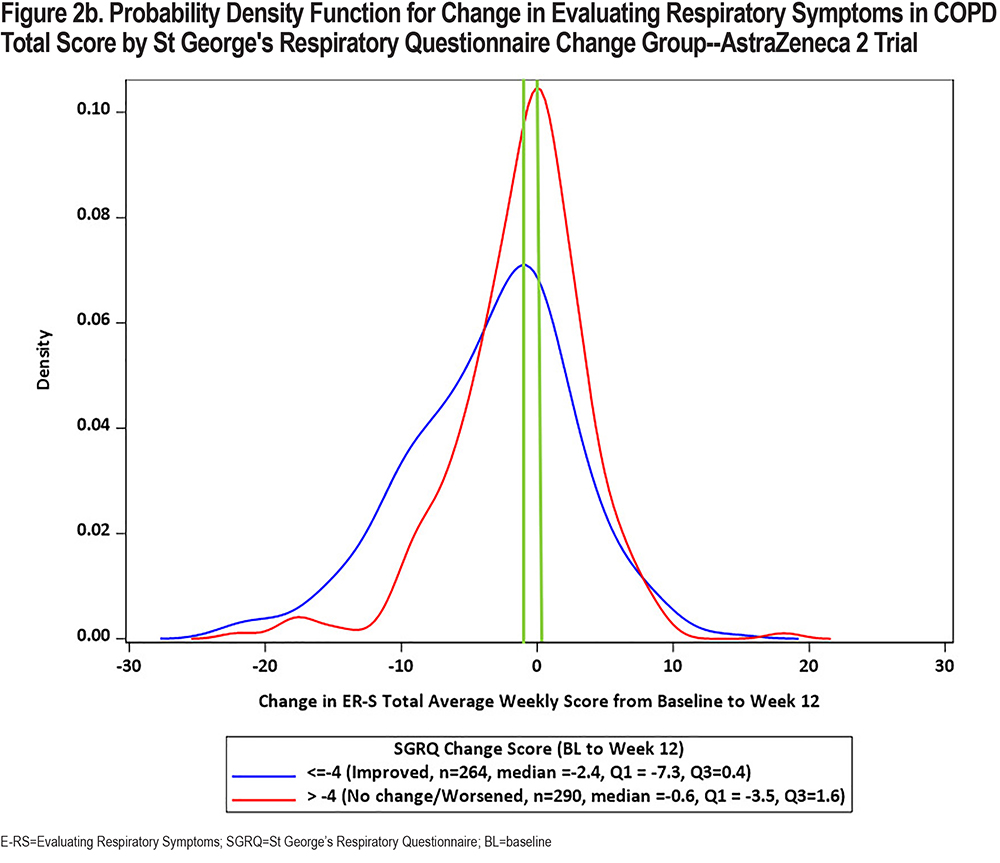
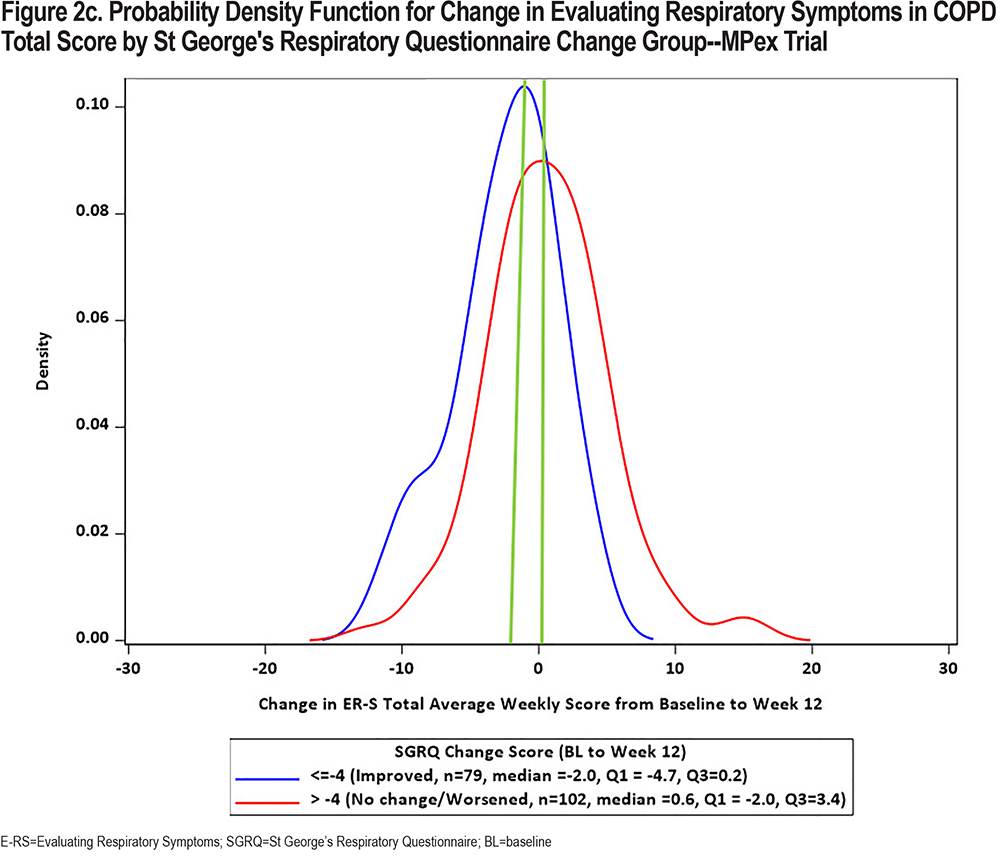
In keeping with the evolving preferences from health authorities for a visual representation of change in PRO scores, CDF and PDF plots were recently developed using the SGRQ as the anchor variable in each of the 3 clinical trial datasets. Results are shown in Figures 1 and 2 (E-RS:COPD Total Score) and in the online supplement (E-RS:COPD subscale scores). Note that group is defined by the well-established SGRQ total score change threshold of 4 points, indicating a meaningful improvement in health status.27 This is comparable to 2 treatment groups with differential health status improvements, with ≥4 points indicating meaningful improvement and <4 points demonstrating no meaningful improvement/treatment effect.
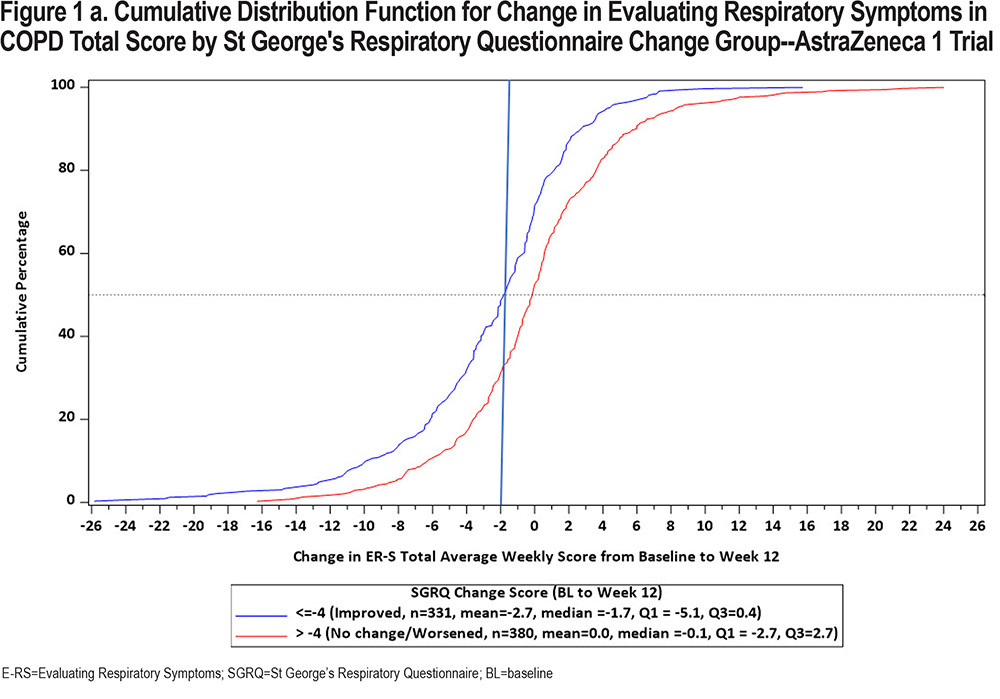
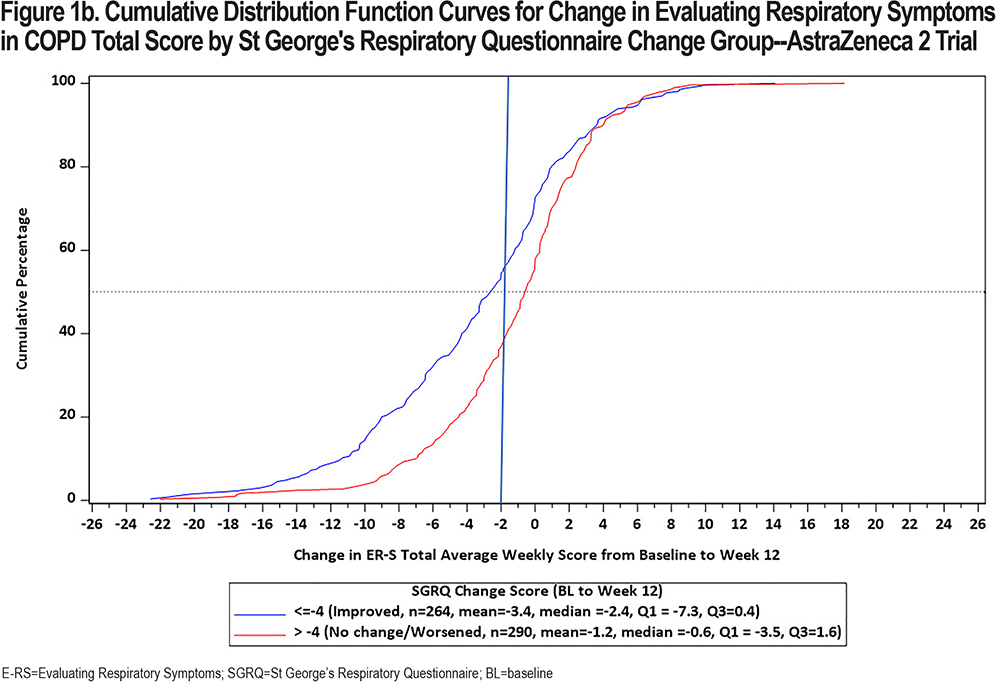
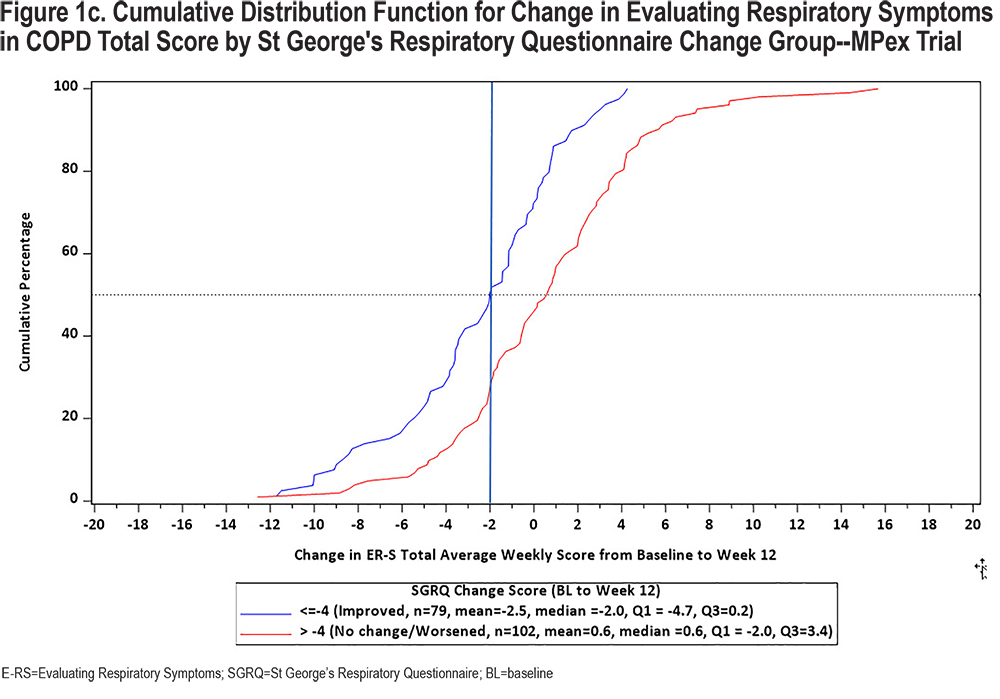
The CDF plots show a clear distinction in symptomatic change between these 2 groups along the center of the continuum of symptomatic change (i.e., between 20 and 80 of cumulative percentage), with a substantial difference noted at 2-points, the proposed meaningful change value for the E-RS:COPD Total score. Differentiation is less clear at the extreme ends of the continuum, due in part to fewer patients at these values and the likelihood of health status optimization or deterioration at the highest and lowest ends of symptomatic change, respectively. These results are replicated across the 3 trials.
CDFs show the proportions of responders and non-responders for every chosen responder threshold. PDFs show the density of participants achieving each change (per anchor category) and provide further insights into the distribution of the change scores. Although essentially the same information, regulatory bodies frequently ask to see both plots. PDFs for E-RS:COPD Total scores by SGRQ group are shown in Figure 2. CDF and PDF figures for the subscales are provided in the supplement (online supplement Figures 2a1 through 4b3). Median E-RS:COPD change in total scores for the responder and non-responder groups (meaningful change; no meaningful change) are highlighted by the green line, with between-group differences of 2.6, 1.8, and 1.6 for the 3 trials, respectively. These values are lower than the distribution- and anchor-based results shown above and in Table 1, suggesting the proposed E-RS:COPD recommendations may be conservative estimates, i.e., may underestimate treatment benefit in the proposed context of use.
Interpretation Recommendations for the Evaluating Respiratory Symptoms in COPD
Based on the totality of results from the original work and new analyses presented, the E-RS:COPD interpretation recommendations provided in Table 3 are appropriate for the intended target population and trial design, i.e., the original/proposed context of use. These values can be used as the MID for sample size estimation and testing and interpreting group-level treatment effects. These values can also be used to categorize study participants as responders or non-responders for understanding and communicating treatment benefit.
Discussion
PRO measures are often used to test the extent to which a new treatment has a statistically significant and meaningful effect on how patients feel or function. The outcomes must be meaningful to patients, and the measures must be fit for purpose, precise, and interpretable within the context of use. Methods for developing recommendations for interpreting PRO scores in clinical trials have been driven by standards in the psychometric field and, in the drug development arena, influenced by regulatory information needs and preferences.
In COPD trials, the SGRQ, COPD Assessment Test 28,29 and COPD Questionnaire30 are useful PRO measures for understanding the effects of treatment on patient perceptions of their health status or health-related quality of life. The developers of each of these instruments have provided information to inform trial design and score interpretation. However, these measures were not designed to precisely quantify and test the effects of treatment on respiratory symptoms of COPD in drug development programs.
The E-RS:COPD has been recognized by the FDA and EMA as a valid and reliable measure of respiratory symptom severity for use in clinical trials of COPD.10,11 To date, it has been translated into 57 languages and has been used as an endpoint in at least 20 double blind RCTs in the COPD patient population, serving as an exploratory, secondary, and primary endpoint.31 It has also been used as an exploratory endpoint in Duaklir® trials for marketing authorization.32,33
As with all measures, the E-RS:COPD is not without limitations. It is a daily diary, asking patients to rate the severity of their respiratory symptoms at the close of each day, which may seem burdensome to some. Although the E-RS:COPD was designed to be simple and easy for patients to complete electronically, care should be taken to administer the instrument in a manner that will optimize recording accuracy, including easy to use devices, staff and patient training, and periodic monitoring with encouragement. It is also important to note that the E-RS:COPD was designed for use in clinical trials of COPD, with the specific context of use outlined above. The content of the instrument, and its measurement of breathlessness, cough and sputum, and chest symptoms, intuitively transcend the COPD respiratory symptom experience. It is possible that the instrument could be used in studies of populations other than COPD. This would represent a substantial change in the context of use, however, requiring evaluation of content validity, quantitative properties, and interpretation recommendations for this new context.19 To date, the instrument has been evaluated for use in asthma-COPD overlap,34 asthma,35 and idiopathic pulmonary fibrosis,36 with results suggesting the instrument may be useful in these populations, although further research is needed.
The E-RS:COPD interpretation recommendations are based on construct-related anchor variables supported by distribution-based methods applied to 3 separate RCTs in the target population. The trials pre-dated regulatory preferences for patient global impression (PGI) anchors, and thus did not include these variables. It is wise for sponsors and investigators to include PGI measures in their studies and re-test the proposed values as part of their research program. Thresholds may need to be adjusted for target populations that differ substantively from the original context of use and/or for specific interventions. For example, values may be different for patients with milder disease or trials testing non-pharmaceutical interventions, such as pulmonary rehabilitation. In addition, designing trials and interpreting treatment effects in placebo-controlled and active comparator studies and with different background therapies can be quite different.
The group-level MID can be useful for estimating sample sizes for placebo-controlled trials and active comparator studies. Results of threshold (responder) analyses, with the derived, pre-specified interpretation recommendations, help readers and reviewers weigh the proportion of patients in each treatment group experiencing meaningful treatment benefit on the outcome of interest, in this case, symptomatic improvement, relative to other trial endpoints and side effects. Interpreting results of individual trials and trial programs are based on a totality of all results to arrive at the best decision for approval, reimbursement, or clinical practice. For drug development programs, threshold values should be tested in phase 2 trials to confirm or adjust them for the specific context of use. Results and proposed thresholds should be discussed with regulatory authorities prior to use in phase 3 trials.
Conclusion
Although terminology and regulatory preferences for methods to derive interpretation recommendations for PRO measures have evolved, the methods themselves have largely remained unchanged. The goal is to identify a value that can be used to power trials to test the MID and categorize study participants as responders or non-responders to assist with interpretation of results. Anchor-based methods are used to derive these values, including clinical variables and PGI scales, with insight from distribution-based metrics. Recommendations for the E-RS:COPD were based on results of clinical anchor- and distribution-based methods, applied to data from 3 RCTs consistent with the instrument’s proposed context of use; the new CDF and PDF figures offer further support for the proposed estimates. Results suggest the recommendations for interpreting scores on the E-RS:COPD in the context of use described here are sound and can be used as a starting point for those who design and interpret trials testing the effects of treatment on respiratory symptoms of COPD.
Acknowledgments
Author Contributions: All authors contributed to the conception and design of the review and participated in the development and critical review of the manuscript. All authors provided final approval for publication submission and are accountable for the accuracy and integrity of this work.
We also extend our appreciation to Camille Cheng of Novartis and Karin Coyne of Evidera for their comments and work on an earlier version of this paper. Finally, we thank Namita Kaushik and Harneet Kaur for assisting with the submission of this manuscript.
Declaration of Interest
NKL and DMB are employed by Evidera | PPD who received funding from Novartis to conduct the review. FSG, CH, and CT are employed by Novartis. The development of figures in this paper was supported by Novartis, as part of a contract with Evidera for a related body of work.