Running Head: Provider Connectedness, Continuity of Care, Readmissions
Funding support: No external funding was received for the conduction of this study.
Date of Acceptance: December 6, 2022 | Published Online Date: December 14, 2022
Abbreviations: AOK=Allgemeine Ortskrankenkasse health insurance; BOBYQA= Bound Optimization BY Quadratic Appropriation; CCI=Charlson Comorbidity Index; CI=confidence interval; CoC=continuity of care; COPD=chronic obstructive pulmonary disease; DMP=disease management program; EI=external-internal; FEV1=forced expiratory pressure in 1 second; GP=general practitioner; HZV=Hausarztzentrierte Versorgung (primary care program); ICD-10-GM=International Statistical Classification of Diseases and Related Health Problems, 10th Revision, German Modification; ICC=intraclass correlation coefficient; MLM=multilevel model; OR=odds ratio; SD=standard deviation; SECON=sequential continuity; SNA=social network analysis
Citation: Forstner J, Koetsenruijter J, Arnold C, Laux G, Wensing M. The influence of provider connectedness on continuity of care and hospital readmissions in patients with COPD: a claims data-based social network study. Chronic Obstr Pulm Dis. 2023; 10(1): 77-88. doi: http://doi.org/10.15326/jcopdf.2022.0359
Online Supplemental Material: Read Online Supplemental Material (233KB)
Background
Chronic obstructive pulmonary disease (COPD) is among the most prevalent diseases that pose a burden on patients, health systems, and society.1 In 2017 in Germany, 2.6 million individuals of statutory health insurance were affected, with a prevalence of 6.7%. Due to the burden of comorbidities and frequent exacerbations, readmission rates are very high in patients with COPD, with up to 82% of patients being readmitted within 30 days after discharge and up to 47% of patients being readmitted within 1 year after hospital discharge.2 COPD is considered an ambulatory care sensitive diagnosis; in Germany approximately 76% of all COPD-related hospital admissions and readmissions are considered avoidable.3 Thus, health care in patients with COPD requires optimal coordination. Generally, patients with COPD are taken care of by their general practitioner (GP) who is also the one responsible for coordination of care. This includes referral to pneumologists and other specialists or, for persistent symptoms or acute exacerbations, hospitalization.4
In health care systems that are characterized by a high degree of specialization and fragmentation, as well as an increasing number of patients with (multiple) chronic conditions, such as patients with COPD, continuity of patient care and coordination of care are crucial.5,6 Continuity of care (CoC) is a multidimensional concept, consisting of relational, informational, and management continuity.7 It is a core element of strong primary care8 and has particular relevance for patients with chronic diseases. A long and trusting relationship, availability of all relevant information about the patient, and all health professionals following a common plan has a positive impact on patient health care.9-13 The literature shows a high relevance of CoC in patients with COPD: high relational CoC has a positive impact on all-cause mortality.14 Furthermore, high CoC is associated with a lower likelihood of avoidable hospital admission,15,16 and high CoC after hospital discharge in Germany is associated with a reduced risk of 1-year hospital readmission.17 Continuity of care and hospital readmissions are, thus, often used as indicators to depict quality of ambulatory health care.
There are several factors that impact CoC, one of which is personal relationships between health professionals. An interview study found that knowing each other and having personal relationships are important for effective information flow, communication, and collaboration between health professionals and, thus, for achieving patient CoC (informational and management CoC).18 Possible underlying mechanisms could be that through recurrent interactions, a common understanding about information flow and coordination about patients is negotiated and care is, thus, improved. The impact of those relational attributes, which can be summarized under the term provider connectedness, can be measured and analyzed by applying social network analysis (SNA). Providers who share patients know each other and exchange information and communicate with each other, even though not necessarily for each individual patient.19,20 The application of SNA in health services research has increased in recent years.21-23 For instance, network structures were found to impact patient readmissions in the context of inter-hospital patient referral networks,24 hospital admission, and inpatient health care costs,20 and CoC for patients with severe mental illness.25
Focusing on patients with COPD, this study aimed to identify shared patient networks of ambulatory care physicians and to examine the effects of provider connectedness on CoC and hospital readmissions.
Methods
Study Design
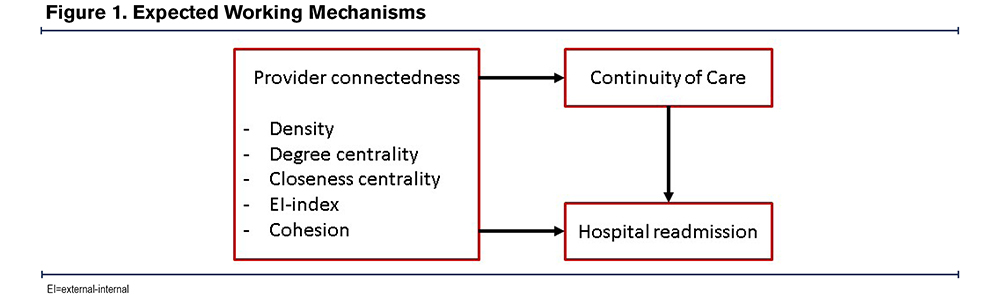
A retrospective observational study was conducted from the Allgemeine Ortskrankenkasse (AOK) Baden-Wurttemberg health insurance claims data for the years 2016 to 2018 in which patients are linked to physicians. We identified the single usual provider,26 who was defined as the GP that was most seen by the patient in the year after discharge from the hospital. The expected working mechanisms of network characteristics depicting provider connectedness on CoC and hospital readmissions are shown in Figure 1.
Data Source
Pseudonymized claims data were provided by AOK Baden-Wuerttemberg, a health insurer in Southern Germany. The data base comprises approximately 4.1 million persons insured with the AOK (2017). We used the data set that is used for the evaluation of a strong primary care program27; its use for our analyses was granted by the data owner. According to the Social Code Book X § 75, claims data can be used for research purposes. The dataset has been used for the results in several other manuscripts. Ethical approval was obtained by the Ethics Committee of the Medical Faculty Heidelberg for the ExKoCare-Study (S-726/2018), in which this study was embedded. The Standardized Reporting of Secondary Data Analyses reporting standard was used for reporting of this study.28
Study Sample
This study involved 3 populations: (1) patients with COPD, (2) GPs treating those COPD patients, and (3) other ambulatory physicians involved in health care for COPD patients and their shared patients to build patient-sharing networks.
The patient study population comprised all COPD patients insured with the health insurer AOK Baden-Wurttemberg who were 40 years or older29 in 2017 and who had at least one overnight inpatient hospital stay in acute care due to COPD in 2017. COPD diagnoses were defined as the 3-digit code J44 according to the International Statistical Classification of Diseases and Related Health Problems, 10th Revision, German Modification (ICD-10-GM) as the documented main discharge diagnosis, which was considered to be valid. Patients for whom any of the following aspects applied were excluded from the analysis: death before discharge, transfer to other hospitals or to hospices, identification of a usual provider was not possible, network characteristics of GPs could not be computed, no information on urbanity/rurality of the GPs’ practice was available, and patients for whom the sequential continuity index (SECON index) could not be calculated.
The study considered ambulatory GPs practicing in Baden-Wuerttemberg who treated at least 30 AOK patients in 2017.
GPs, pneumologists, and cardiologists were considered for the construction of patient-sharing networks. They needed to practice in Baden-Wuerttemberg and treat at least 30 AOK patients in 2017. All insured persons with an outpatient visit in the year 2017 treated by the included ambulatory physicians were considered for the construction of connections between physicians. Naturally occurring networks between ambulatory physicians were identified on the basis of at least 5 shared patients.19 Based on these connections, an undirected, unweighted whole network was built, containing 7888 physicians with 121,756 connections. This network was decomposed, and disconnected graphs consisting of only one connection between 2 physicians (n=6) were removed, and only the biggest connected graph containing 7876 physicians was used for further analyses.
Measures
Outcomes: The outcomes of interest were CoC and readmission to the hospital.2 Both were determined for individual patients in relation to the first COPD-related hospital stay in acute care in 2017, which was identified as the index stay. CoC was operationalized by using the SECON index.30 The SECON index expresses whether consecutive consultations are with the same (assigned value 1) or another physician (assigned value 0) as the previous consultation. This way, it considers the fact that patients visit different physicians.30 In the calculation of the index, visits to GPs, pneumologists,4 and cardiologists31 in the year after discharge17 were considered.
For the analysis of readmissions, only the first readmission to acute care due to the same indication (main discharge diagnosis J44) was considered. Readmission to the hospital within 30 days, 90 days, 6 months, and 12 months was determined. A readmission could only be assigned to one of the time frames (e.g., a readmission after 23 days matches the 30-day time frame and is not considered in any of the other time frames).
Network Characteristics: Several characteristics of provider connectedness were determined. Density is measured as the proportion of existing ties between providers compared to the maximum possible number of ties, here applied to physicians’ individual networks. The measure takes on values between 0 and 1, with a density of 1 indicating that all possible ties do exist. In dense networks, as density approaches one, information can be transmitted easily, while in networks with low density, information might need to travel longer in order to reach its recipient.
Degree centrality measures the number of links a physician holds with other providers and, thus, the number of their direct connections to others, which is an indicator of connectedness. The value takes positive integers, with a minimum of 1 (otherwise a physician would have no connections to others and would not be part of the network) and a maximum of 7875 (size of the full network minus 1).
Closeness centrality relies on the geodesic distance (the shortest path between 2 individuals, counts the number of edges on this path) and refers to a physician’s sum of shortest paths to other providers in the total network. The measure is calculated from the full network and is based on the inverse of the average shortest path; thus, higher closeness centrality indicates that a physician is in the “middle” of the network. The measure takes on values between 0 and 1. Due to the large size of the overall network, closeness centrality measures took very low values and, thus, were multiplied with 10,000 for the analyses. Generally, nodes with a high closeness centrality have a high influence on the whole network.
The external-internal (EI) index is an indicator of openness/closedness of a network as it relates to internal and external connections in a network. Internal connections are those between 2 individuals who both belong to the physician’s individual network, and external connections are connections between a physician directly linked to the physician and a physician not directly linked to the individual physician. The value of the EI-index ranges between -1 and 1, with a positive score indicating more external relations, and negative scores indicating enclosed subgroups that allow for no influence from outside of the group.
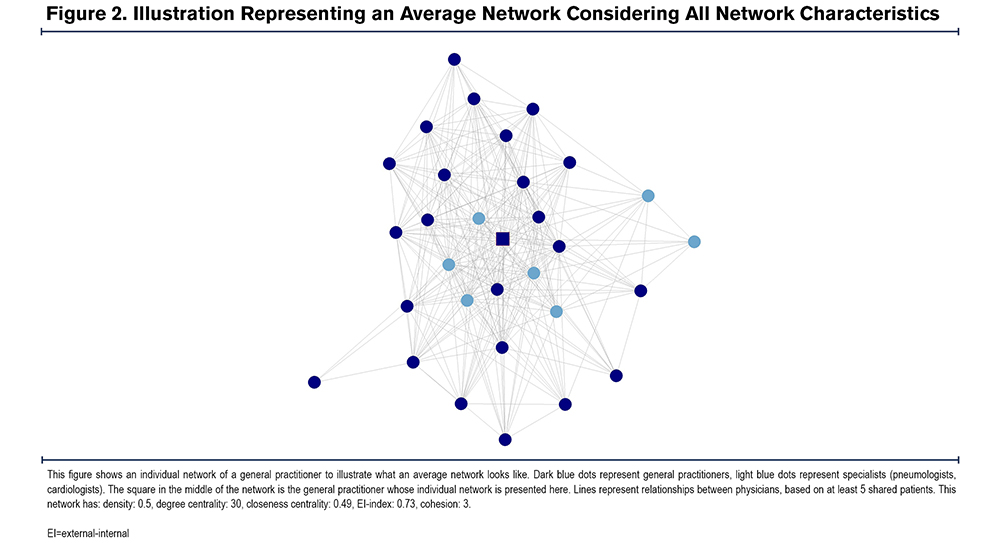
Cohesion is a measure of the togetherness of a network of health care providers. It was measured as the minimum number of nodes needed to be removed in order to remove all directed paths within the individual physicians’ network. The value takes positive integers, with a minimum of 1 and higher values indicating a more stable network. There is no maximum value, as it depends on the size of the individual networks. Networks with high levels of cohesion usually show improved information flow and effective coordination.32 Figure 2 shows an average network considering all network characteristics.
Other Physician Characteristics: Furthermore, the following GP characteristics were included as potential confounders:
- Practice size (average number of patients treated per quarter year) as well as the years worked in the current practice;
- Whether a GP practices in an urban or a rural area;
- Age;
- Participation in the disease management program (DMP) for COPD and the strong primary care program (Hausarztzentrierte Versorgung [HZV]); and
- The share of contacts within the individual network that constitutes medical specialists.
Patient Characteristics: The following patient characteristics were included:
- Sex (male/female) and age 27;
- The Charlson Comorbidity Index (CCI)2 in the year 2017;
- Asthma-COPD-overlapwhen patients had a valid asthma diagnosis (as indicated by ICD J45 and needed to be documented in at least 2 quarter years) in 2017 (yes/1 or no/0) 2;
- The number of contacts with the usual provider in the observational period 10;
- The share of consultations with ambulatory physicians that were with specialists;
- The number of all-cause hospitalizations in the year preceding the index stay as an equivalent for the number of exacerbations (hospital stays are more valid than exacerbations in claims data) 2,4;
- The length of the index stay33;
- Whether a patient lives in a nursing home or is discharged to a nursing home from the index stay (yes/1 or no/0),2 based on claims data information for the month of discharge;
- The severity of the COPD (mild, moderate, severe, very severe, or severity unspecified) using the ICD code of the index stay, based on pulmonary function (as measured by the forced expiratory pressure in 1 second [FEV1];
- Continuity of care after discharge using the SECON.17,27
Statistical Analysis
Descriptive Analysis: For the descriptive analysis of continuous measures, means and standard deviations were computed. For categorical measures, absolute and relative frequencies were computed.
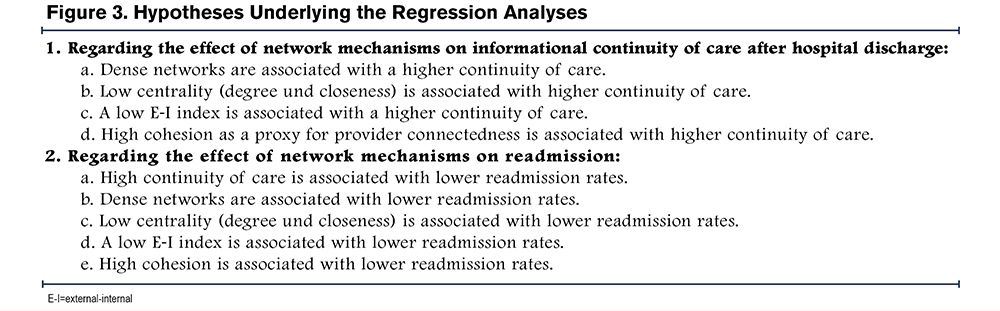
Analysis of Continuity of Care and Readmissions: Regression analyses were conducted to examine the impact of network characteristics (density, degree centrality, closeness centrality, EI-index, cohesion) on the SECON index and of the network characteristics and SECON index on hospital readmissions, guided by the hypotheses in Figure 3. Other physician and patient characteristics were included as confounders to control for factors known to impact on CoC and hospital readmissions. Multilevel models (MLM) with random intercepts were used, given the hierarchical structure of the data where COPD patients are clustered in GPs. First, a linear MLM was computed for the outcome CoC. Then, binary logistic MLMs were built for each of the readmission timeframes, containing the SECON as an additional predictor. The at-risk population for the analysis of readmissions includes those who have not been readmitted in the preceding time frame (as only the first readmission after the index stay is considered) or died in the preceding time frame.
For the analyses, continuous measures (outcome, predictors, and confounders) were standardized around the mean to facilitate comparison of effects. First, a null model containing the intercept only was built to compute the intraclass correlation coefficient (ICC) to analyze how much of the variance in the outcome is attributable to being treated by a certain GP. However, even when the ICC was equal to or close to 0, MLMs were built to consider the natural clustering of the data. Then, the following models were built before reaching the final model: models with measures on a patient level only, models with measures on a GP level only, models with confounders only, and a final model containing all confounders and predictors. Analyses of variance were computed to compare the model containing confounders only and the final model to examine whether including network characteristics improved the model. Measures were excluded from the analysis when they were strongly correlated (Pearson’s r, eta, or Cramer’s V > 0.6) or multicollinearity was high (variance inflation factor > 10). Due to high correlation, the age of the GP and the share of specialists within an ego network were excluded from the analyses. Linear MLMs were fitted by means of the restricted maximum likelihood approach, binary logistic MLMs were estimated using the Bound Optimization BY Quadratic Approximation (BOBYQA) algorithm.34
The level of significance was set to α=0.05 for all models. Results are reported with standardized regression coefficients (β) for linear models, and odds ratios (OR) for logistic models, respectively, and their 95% confidence interval (CI).
All data preparation was done in dbForge Studio for MySQL and the SECON index was computed using Java SDK (x64, V.18.02). Network construction, data manipulation, data analysis, and export of tables was done using the statistics software R Version 4.1.2 in R Studio Version 2022.02.3.
Results
Description of the Study Population
A total of 7294 patients and 3673 GPs were available for analysis. About two-thirds of the study population of GPs were male (67.7 %), their mean age was 56.42 (standard deviation [SD] 8.64). The average closeness centrality of GPs was 0.48 (SD 0.04) and their average degree centrality was 30.5 (SD 19). The networks of GPs had an average density of 0.65 (SD 0.15), an EI-index of 0.70 (SD 0.14), and a cohesion of 5.56 (SD 3.28) (Table 1).

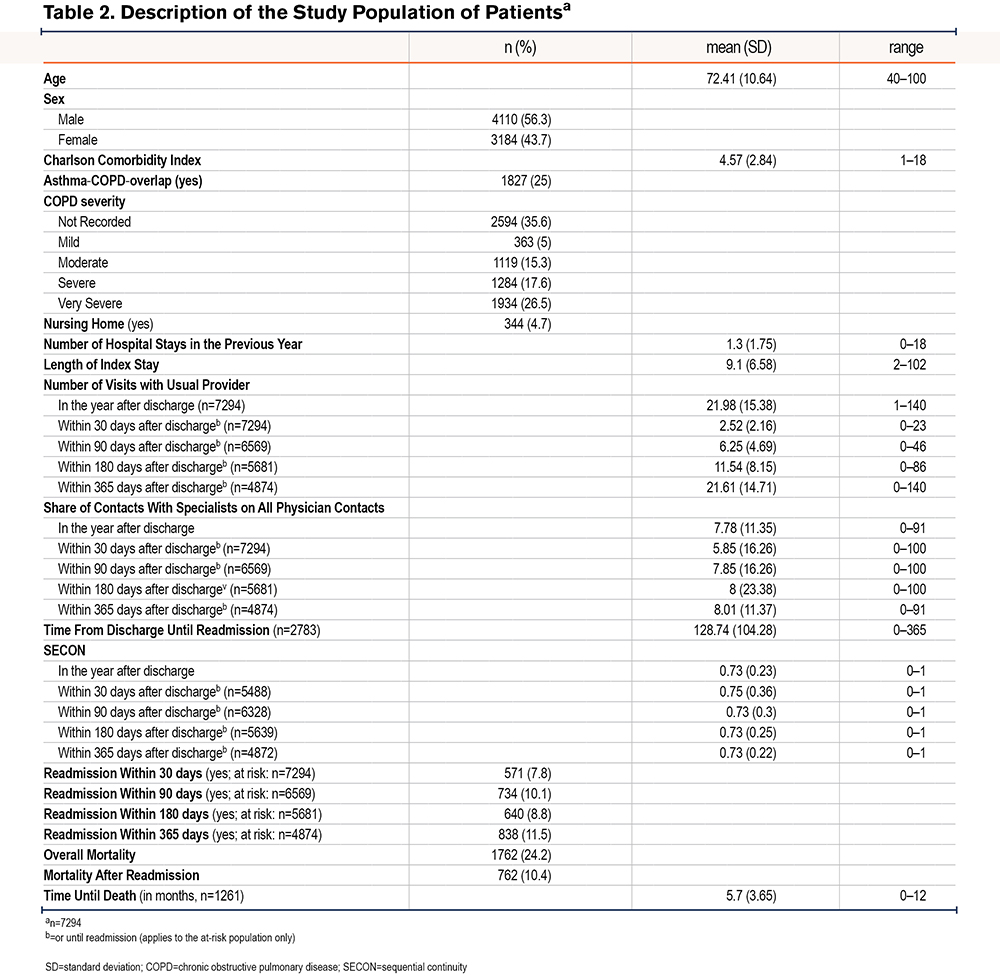
Patients were 72.41 years old on average (SD 10.64) and had a mean CCI of 4.57 (SD 2.84), with 25 % of patients being affected by an asthma-COPD-overlap. More than half of the study population was male (56.3 %). Overall, about a quarter of the study population died within the year after discharge (n=1762), on average approximately 5.7 months after discharge. Almost half of those died after previously having been readmitted (n=762). Continuity of care, as measured by the SECON index, was on average 0.73 (SD 0.23) within the year after discharge. With n=2783 patients, over a third of the study population was readmitted within a year after discharge. Table 2 provides an overview of patient characteristics.
Continuity of Care and Readmissions
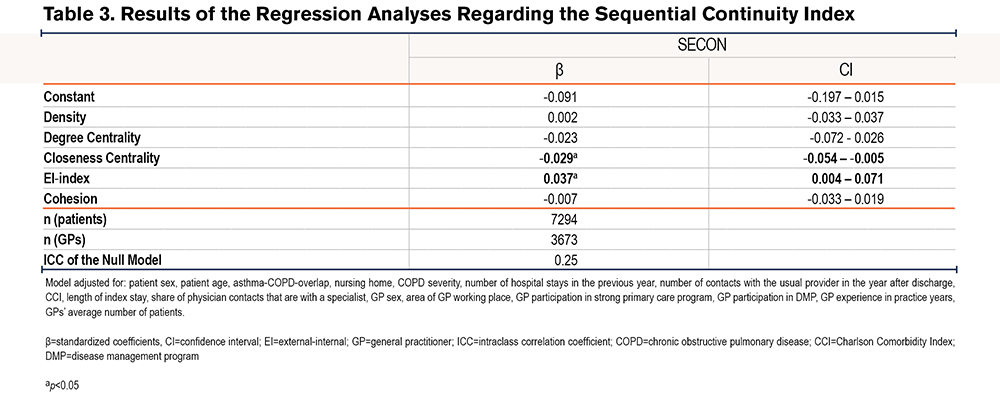
Continuity of Care: The null model showed an ICC of 0.24, indicating that 24% of the variance in the outcome was attributable to being cared for by a certain GP. The final model was statistically better than the model containing confounders only (Chi2=24.26, p < 0.001). The analysis (see Table 3) showed that an increase in closeness centrality by 1 SD (0.04) led to a decrease in the continuity measure by 0.029 SDs (SECON SD=0.23; 95 % CI=-0.054 – -0.005, p < 0.05). An increase in the EI-index by 1 SD (0.14) led to an increase in the SECON index by 0.037 SDs (β=0.037, 95 % CI=0.004 – 0.071, p < 0.05). Density, degree centrality, and cohesion did not have a significant impact on the SECON index after hospital discharge.
Hospital Readmissions: The null model for readmission within 30 days after discharge showed an ICC of 0.35, indicating that 35% of the variance in the outcome was attributable to being cared for by a certain GP. The final model was not statistically different from a model containing confounders only. An increase in the EI-index by 1 SD led to patients having a 1.25 higher chance of being readmitted within 30 days (OR=1.25, 95 % CI=1.055–1.481, p < 0.01), and higher degree of centrality increased the likelihood of a 30-day readmission (OR=1.257, 95 % CI = 1.001–1.579, p < 0.05) (Table 4).
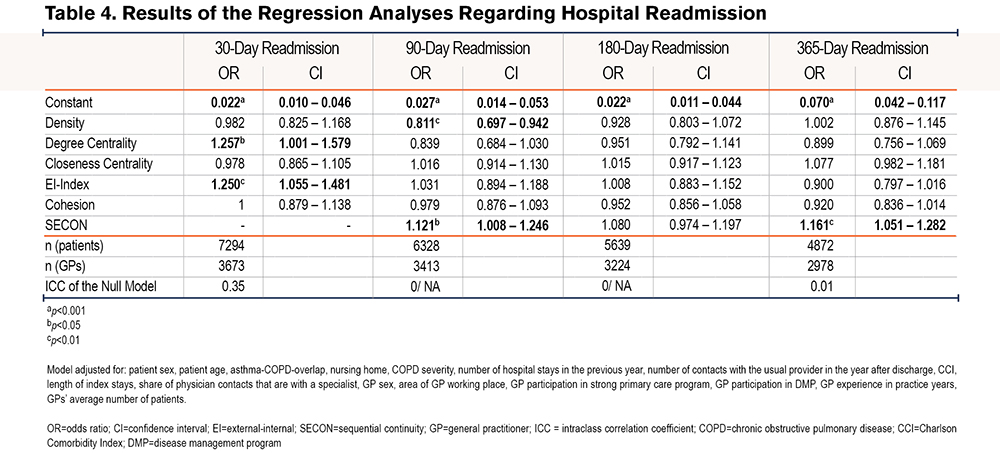
The null model for readmission within 90 days after discharge showed an ICC of 0/ could not be computed due to singularity, indicating that the variance in 90-day readmission did not depend on being treated by a certain GP. The final model was statistically better than the model containing confounders only (Chi2=14.57, p=0.006). It included 6328 patients and 3413 GPs and showed that higher ego network density led to lower likelihood of 90-day readmission (OR=0.811, 95 % CI = 0.697–0.942, p < 0.01) and a higher SECON index (OR=1.121, 95 % CI=1.008–1.246, p<0.05) led to higher likelihood of 90-day readmission. Closeness centrality, the EI-index, and cohesion did not have a significant impact on the outcome. (Table 4 and Table S2 in the online supplement).
The null model for readmission within 180 days after discharge showed an ICC of 0/ could not be computed due to singularity. The final model was not statistically different from the model containing confounders only. Based on the final model, which included 5639 patients and 3224 GPs, the analysis showed that neither the network characteristics nor the SECON have a significant impact on the outcome. (Table 4).
The null model for readmission within 365 days after discharge showed an ICC of 0.01. The final model was not statistically different from the model containing confounders only. The final model included 4872 patients and 2978 GPs and showed that none of the network characteristics had a statistically significant impact on the outcome. Regarding continuity of care, patients who have a SECON increased by 1 SD have a 1.161 higher chance of being readmitted within 1 year after hospital discharge (see Table S2 in the online supplement ).
Overall, the analysis did not support hypotheses 1a, 1c, and 1d, but provided support for hypothesis 1b regarding closeness centrality. Furthermore, the results do not support hypotheses 2a, 2c, 2d, and 2e, but do partially support hypotheses 2b (regarding readmission within 90 days), and 2d (regarding readmission within 30 days). (Figure 3)
Discussion
Overall, this social network study found that provider connectedness between GPs and ambulatory specialists in shared-patient networks had overall little predictive power but showed some effects on short- and mid-term hospital readmissions, and on CoC after hospital discharge in patients with COPD.
Care coordination is seen as a “holy grail” to address the challenges resulting from the fragmentation of health care systems and is expected to impact quality of care and cost. In patients with COPD, for example, participation in DMPs is recommended in care guidelines as it can lead to reduced rates of hospital admission, readmission, or length of stay as well as improved quality of life.4,35,36 Yet the mechanisms of integrated care and other structured care models are not well understood. Just recently, Burns and colleagues37 demanded to further examine the components of integration and, among others, use SNA as a new approach to explore how interaction and communication between care providers contribute to integration of care.
This study was an attempt to identify possible characteristics of social networks with regard to CoC and readmissions as indicators for the quality of ambulatory care, and more specifically, primary care. The assumption underlying our hypotheses is that provider connectedness between GPs and ambulatory specialists has a positive impact on information flow, communication, and collaboration concerning individual patients. We hypothesized that this effect is stronger in enclosed groups of practitioners (low EI-index) that are densely and well connected (density and cohesion), as shared views can be built through recurrent social interaction and less influence from outside the network. Yet, we anticipated that not being very central holds advantages, as those who have fewer connections consequently have stronger connections and better knowledge about tasks and responsibilities of others. Altogether, we expected that knowledge about responsibilities of others in the network and strong relationships leads to targeted physician consultations, resulting in higher CoC, and improved information flow and targeted physician consultants, resulting in lower readmission rates.
Being part of an enclosed group of physicians (low EI-index) seemed indeed to be beneficial for patients’ readmission within 30 days after discharge, confirming our hypothesis but showed to be disadvantageous regarding CoC (different than hypothesized). We can only speculate about the reasons for the latter effect. We did not find any other study that investigated the impact of enclosed groups on outcomes. Furthermore, and in accordance with our hypothesis, high network density lowered the likelihood of a 90-day readmission, but the impact of being densely and well connected (density and cohesion) did not show in other timeframes of readmission nor in CoC. Other studies also showed that network density can positively impact patient outcomes such as CoC and hospital length of stay.25,38 Generally, this partly supports the claim of Burns et al37 who suggested that high network density contributes to integration of care. In other studies, however, higher density increased readmission rates,24,39 and the authors argue that high density is an indicator of little specialization and division of labor which results in ineffective and unstructured referral pathways.24 Regarding centrality, we expected that a less central GP within their network was beneficial as stronger ties are built with other care providers, which was confirmed regarding CoC, but showed another direction of effect regarding 30-day readmission. The results of other studies investigating the impact of centrally distributed networks or central care providers within a network are also inconclusive regarding an effect and the direction of the shown effect on outcomes such as readmission, CoC, and others.24,25,38-41 We expected low centrality to aid in building strong ties. However, providers with high centrality may support coordination of care by steering information flow.24,37 Lastly, we expected CoC to reduce the risk of hospital readmission, which was not the case in our population. However, this can potentially also mean that the patient's health condition has worsened and, therefore, various visits to several physicians (together with an increase in the number of visits with the GP, see online supplement ) have already taken place in order to avoid a potential hospital stay, but this was not possible after all. This is supported by the very strong association of disease severity and the likelihood of being readmitted (see online supplement).
With regard to hospital readmission, we analyzed different time periods, as they can potentially reveal conclusions about the responsibilities of different areas of the health care system. Our results show that the impact of provider connectedness on the likelihood of readmission decreases as more time passes after a discharge. Generally, the opinion is that very short-term readmissions (< 7 days) are attributable to hospital care and the discharge process, whereas mid- and long-term readmissions are rather attributable to outpatient care, patient self-management, community resources,42 or care coordination.43 We did not consider very short-term readmissions, however, our results support that outpatient care and care coordination impact mid-term readmissions, whereas long-term readmissions might potentially not be reduced by more GP involvement. The analysis shows that COPD severity has a large impact on long-term readmissions (see online supplement), therefore, they might be more attributable to patient self-management, or not avoidable after all.44
Our results indicate that provider connectedness potentially affects patient health care. However, these effects are small, do not improve the overall predictive power of explanatory models, and are not congruent across outcomes. Thus, we cannot conclusively explain the working mechanism and whether the chosen constellation of characteristics is the most appropriate operationalization of provider connectedness and cannot derive recommendations for the targeted creation of and investment in shared-patient networks of ambulatory physicians.
Strengths and Limitations
This study has some limitations. Claims data are secondary data which were not collected for scientific purposes and, therefore, are only an approximation of the reality of care. This goes hand in hand with limited internal validity and the fact that, among other things, the quality of coding of the severity of COPD in ICD-codes is limited,45 and there are limitations in the documentation of transfers between hospitals. This might result in the hospital stay identified as the index stay not being the first stay but a stay in a series of hospital admissions and discharges, and an underestimation in the length of the index stay if there were undocumented (re-) transfers. Also, through claims data no information about information flow and the quality of communication is known. Lastly, people insured with the AOK Baden-Wuerttemberg traditionally have a worse state of health and higher rates of smokers than other health insurers,46 which might lead to an overestimation of COPD prevalence and severity as well as admission rates. However, as the AOK Baden-Wuerttemberg insures almost half of the population of the federal state, we can assume that the physicians included share more patients than those identified in this analysis. Additionally, the federal state of Baden-Wuerttemberg has the lowest prevalence of COPD in Germany. Thus, absolute numbers of readmissions might be higher in other federal states and the effect, therefore, might be stronger. Furthermore, by relying on claims data, we were not only able to include large numbers of GPs and patients into the analyses but were also able to consider the majority of statutory health insurance-approved ambulatory physicians and, therefore, build a full social network. By relying on 2 different patient populations, we were able to independently measure CoC and network characteristics. Finally, to our knowledge, this is the first study that explored the impact of shared-patient networks of ambulatory physicians on CoC and among very few other studies that chose hospital readmissions.
Conclusion
Current evidence is inconclusive regarding the direction of the impact of network characteristics on patient care as measured by CoC and readmissions, as there are few studies to date and the settings, study populations, and definitions of outcomes are heterogeneous. Our results provide some evidence that provider connectedness has an impact on health care. Interaction within a dense network can help develop shared ideas, and fewer connections to others help build strong connections. Nevertheless, other factors appear to be more important in influencing CoC and hospital readmission in patients with COPD. Further research is needed to provide less heterogeneous evidence and derive clear recommendations for investment in provider networks.
Acknowledgements
Author contributions: JF and JK conceived and designed the study. JF analyzed and interpreted the data and drafted the manuscript. GL calculated the SECON index and supported data analysis. JK supervised data analysis. MW supported design of the study and data analysis. CA, GL, JK, and MW contributed to the interpretation of data and provided input on the manuscript. All authors read and approved the final manuscript.
The authors would like to thank Dr. med. Sandra Stengel for input on the reality of care of patients with COPD in primary care. The authors would also like to thank Markus Qreini for support with data preparation and Dr. sc. Hum. Manuel Feißt from the Institute of Medical Biometry, University Hospital Heidelberg, for support with the statistical analysis of binary multilevel regression models. Furthermore, the data usage grant from the AOK Baden-Wurttemberg for this study is greatly acknowledged.
Declaration of Interest
All authors declare that they have no competing interests. The data owner was not involved in the design, data collection, analysis and interpretation of data of this study, and the writing of the manuscript.