Running Head: A Model Predicting Residual Volume from Spirometry
Funding Support: This work was supported by National Heart, Lung, and Blood Institute P50 HL084948 and R01 HL157879.
Date of Acceptance: December 19, 2022 | Published Online Date: December 23, 2022
Abbreviations: %est=percentage estimated; %pred=percentage predicted; AUC=area under the curve; BLVR=bronchoscopic lung volume reduction; CI=confidence interval; COPD=chronic obstructive pulmonary disease; ECCS=European Community of Coal and Steel; FEV1=forced expiratory volume in 1 second; FVC=forced vital capacity; LR=likelihood ratio; NPV=negative predicted value; PPV=positive predicted value; ROC=receiver operating characteristic; RV=residual volume; SCCOR=Specialized Center for Clinically Oriented Research; TLC=total lung capacity
Citation: Evankovich JW, Nouraie SM, Sciurba FC. A model to predict residual volume from forced spirometry measurements in chronic obstructive pulmonary disease. Chronic Obstr Pulm Dis. 2023; 10(1): 55-63. doi: http://doi.org/10.15326/jcopdf.2022.0354
Introduction
Chronic obstructive pulmonary disease (COPD) is a is a leading cause of disability and death worldwide.1 In patients with advanced emphysema, air trapping associated with incomplete expiration and lung hyperinflation results in respiratory muscle inefficiency and an increased work of breathing.2 Measures reflecting such air trapping, such as residual volume (RV), are closely associated with symptoms, exercise limitation, and poor prognosis.3-6 Further, the magnitude of hyperinflation is an important selection criterion for surgical and bronchoscopic volume reduction interventions, as patients with an elevated RV benefit the most from intervention. Thus, elevated RV may be a preferred metric to forced expiratory volume in 1 second (FEV1), the conventional metric of COPD severity, in driving symptom burden and selecting patients for lung volume reduction procedures.7-11
The most accepted standard for measurement of RV in patients with airflow obstruction uses body plethysmography.12 However, given the higher equipment costs and greater technical expertise required for plethysmographic lung volume measurements compared to spirometry, it is most commonly available in specialty centers.12 Additionally, the variance in measurement of RV, even in a controlled academic setting, is greater than that of spirometric measures, and variation in technique between institutions would be expected to exacerbate this phenomenon.13,14 Given these limitations, lung volume data is rarely available in community settings. Given the central role of RV in the selection of candidates for bronchoscopic lung volume reduction, these factors may be barriers to qualified triage of patients for volume reduction procedures.15-17 Further, integrating measures reflecting lung hyperinflation into epidemiologic databases may facilitate analyses assessing the relationship between hyperinflation and prognosis or comorbidities.18,19
RV is poorly represented by any individual spirometric measure; however, we postulated that a model incorporating spirometric measures reflective of prolonged expiratory time constants, the mechanistic driver of air trapping, and forced vital capacity (FVC), decreased consequent to reductions in expiratory reserve volume associated with air trapping, would more accurately reflect elevations in RV in patients with COPD. Such a model could improve identification and triage of appropriate volume reduction candidates and may provide a meaningful measure that could be analyzed in existing large epidemiologic data sets to provide insights into disease impact and prognosis. Here, we report a simple model derived from spirometric data and demographic data using only FEV1, FVC, age, and biological sex that has excellent test characteristics to predict elevations in RV.
Materials And Methods
Populations
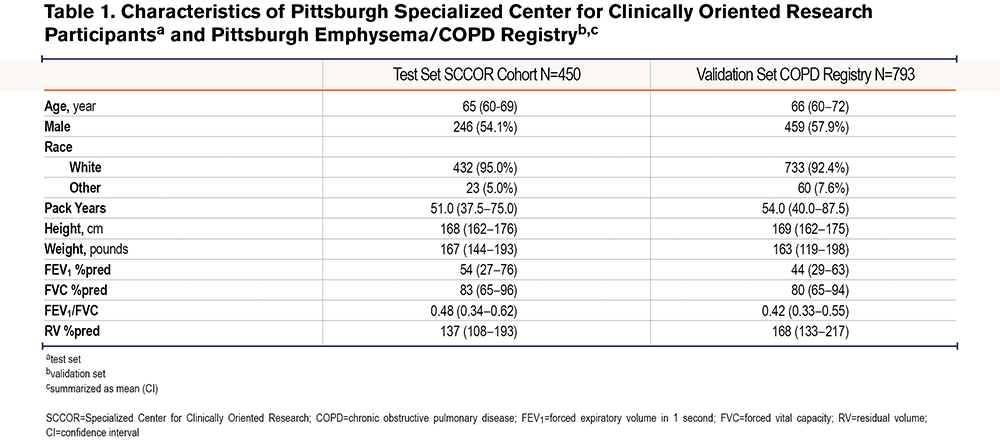
Test set participants (n=450) were from the Specialized Center for Clinically Oriented Research (SCCOR) cohort at the University of Pittsburgh. Inclusion criteria included age >40 years and at least a 10 pack-year history of tobacco use, with spirometry reflecting FEV1/FVC < 0.7. Validation set participants (n=793) were from the University of Pittsburgh Emphysema Research Registry. Data was exclusive of any participants in SCCOR. All procedures were performed under University of Pittsburgh Institutional Review Board approved protocols from February 2001 to April 2017 and written informed consent was obtained for each participant.
Physiologic Testing
Plethysmography measurements were performed over the 17-year collection period in 3 different research and clinical laboratories, all directed and supervised by FCS, using either Viasys VMAX Autobox, Viasys VMAX 62J (Yorba Linda, California) or Jaeger Masterscreen (Hochberg, Germany) in both test and validation cohorts. Specific techniques included: following shutter closure at a stable end expiratory tidal volume baseline, a slow pant frequency of 30 hertz, followed immediately by inspiration to total lung capacity (TLC), a slow vital capacity maneuver and a final inspiration to TLC. Plethysmograph boxes were calibrated prior to each study, monthly, using human biological controls and periodically, with a lung volume copper box standard. Spirometry standards were those of the American Thoracic Society/European Respiratory Society task force20 and reference equations were those of Hankinson, and plethysmography those of European Community of Coal and Steel (ECCS).21,22
Derivation of the Model
Fractional polynomial multivariate regression analysis was used to derive a prediction model for RV percentage predicted (%pred) from spirometry variables, age, and sex in the test set. The equation derived from this model was used to calculate the RV percentage estimated (RV %est). We chose variables FEV1, FVC, FEV1/FVC (decimal), age, and gender and derived a model using fractional polynomial regression based on a priori mechanistic plausibility.
Analysis
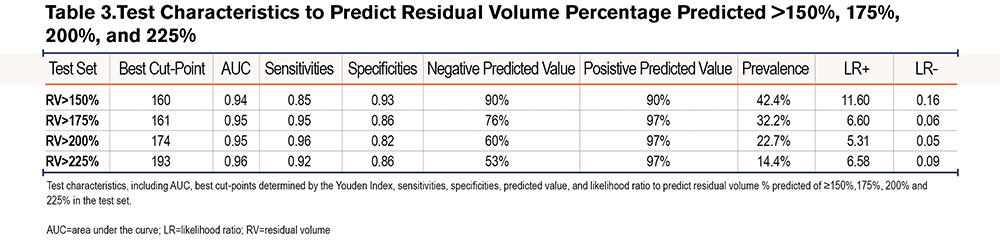
The receiver operating characteristic (ROC) curve was used to measure the discriminatory power in predicting observed RV %pred at thresholds >150%, 175%, 200%, and 225%. The Youden Index23 was used to calculate the optimal cut points of RV %est from the derived equation to predict observed RV %pred at each threshold.
Validation
The test set prediction equation was used to calculate the predicted RV in the validation data set. The test set RV cut points were replicated in the validation set to calculate the sensitivity and specificity to predict RV %pred >150%, 175%, 200%, and 225%.
Statistical Analysis
All analyses were performed in STATA 14.0 (StataCorp., College Station, Texas).
Results
The test set included n=450 and the validation set n=793 measurements, all from unique participants. Baseline characteristics of the participants in both datasets are shown in Table 1. The test and validation set had similar age, gender, tobacco exposure, weight, and racial demographics. All patients had an FEV1/FVC ratio <0.7. In the test set, RV median (range) was 137 (52–358), with an interquartile range (IQR) of 109–193, and in model predictions, RV median (range) was 143 (75–306), with an IQR of 112–194. In the validation set, RV median (range) was 167 (35–429), with an IQR of 129–212, and in model predictions, RV median (range) was 158 (71–290), with an IQR of 129–186. The correlation coefficient between the RV %pred using the ECCS versus Crapo lung volume reference equations24 was 0.98 suggesting that even though our model was generated using ECCS values, it is applicable to other reference equations.
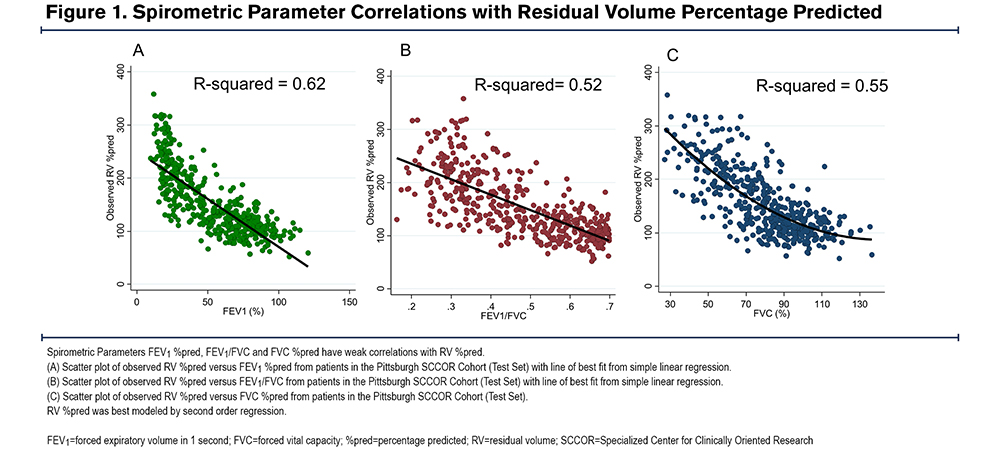
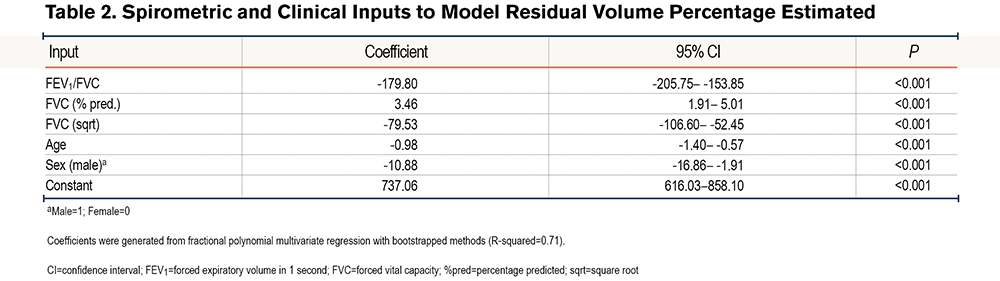
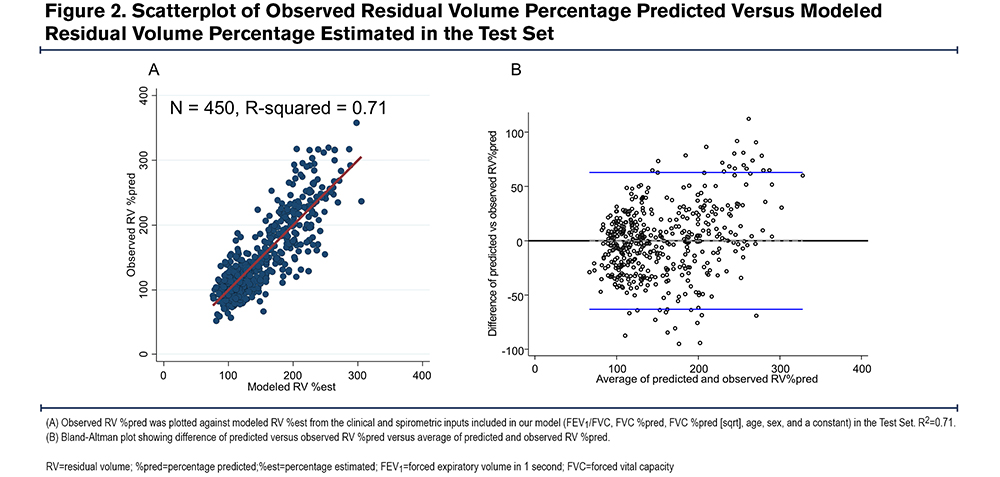
We confirmed that no single spirometric parameter could be used to predict an elevated RV. There was an inverse linear correlation between RV %pred and FEV1 %pred (r=-0.79) (Figure 1A) and FEV1/FVC (r=-0.72) (Figure 1B), and a non-linear correlation between RV %pred and FVC %pred (r=-0.74) (Figure 1C). However, we hypothesized that a model combining simple spirometric measures and demographic data could better predict RV (RV %est) (Table 2). The derived model was RV %est=[FVC %predicted] x 3.46-[FEV1/FVC] x 179.80-[FVC % (sqrt)] x 79.53-[age] x 0.98-[sex] x 10.88+737.06, where male=1 and female=0. There was a high correlation between the model RV %est and observed RV %pred, with R2=0.71 (Figure 2A). The Bland Altman plot in the test cohort revealed an average difference between observed RV% versus predicted RV% of 0% (standard deviation [SD]=32%); the 95% confidence interval (CI) limit of agreement was -63% to 65%. The slope of the line <225%, in the relevant range of our threshold analyses, is flat and supports the primary aims and results (Figure 2B).
We also tested whether separate male and female equations added to the prediction model. The Hausman specification test confirmed that the 2 different gender equations are collapsible and, thus appropriately represented by a single model.
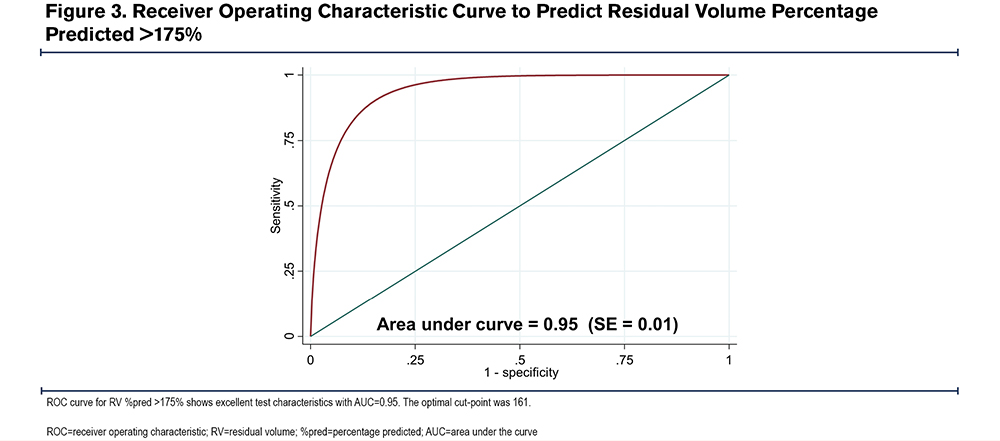
To determine the diagnostic characteristics of our model, we generated ROC curves for various cut-points (Table 3).23 The ROC curve for RV %pred > 175% is shown in Figure 3. An RV %pred >175 is the recommended inclusion criteria for bronchoscopic lung volume reduction (BLVR).25 The ROC area under the curve (AUC) for RV %pred > 175% was 0.95, (95%CI=0.92–0.96), indicating excellent test accuracy. The optimal cut-point from the model was 161. With this cut point, the model had a sensitivity of 0.95 and specificity of 0.86 in predicting an observed RV %pred >175%. Negative predictive value (NPV) was 0.76, positive predictive value (PPV) was 0.97, positive likelihood ratio (LR+) was 6.6, and negative likelihood ratio (LR-) was 0.06. The optimal cut-points, sensitivities, specificities, NPV, PPV, LR+, and LR- for RV %pred > 150%, 200%, 225% are listed in Table 3. The model was less sensitive (0.85 versus 0.95) but more specific (0.93 versus 0.86) in predicting an RV %pred >150% compared to RV %pred >175%. The sensitivities to predict an RV %pred >200% and 225% were 0.96 and 0.92, respectively, and the specificities to predict an RV %pred >200% and 225% were 0.82 and 0.86.
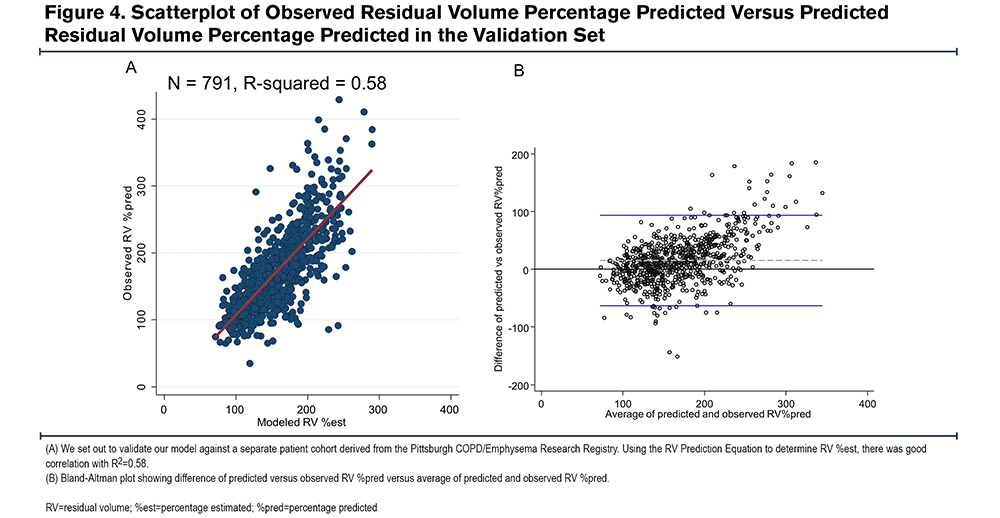
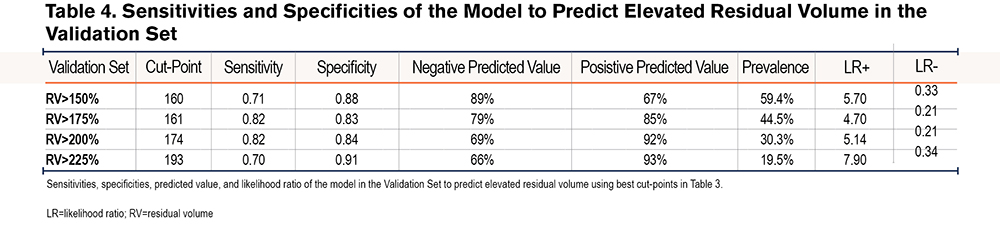
We applied our model to determine RV %est in a validation cohort derived from the University of Pittsburgh Emphysema Registry. There was similar goodness of fit between observed RV %pred and RV %est with R2=0.58 (Figure 4A). The Bland-Altman plot from this cohort revealed an average difference between observed RV% versus predicted RV% was 15% (SD=40%); the 95% CI limit of agreement was -63%- 93%. Again, the slope of the line <225, in the relevant range of our threshold analyses, is flat and supports the primary aims and results (Figure 4B). Using the optimal cut points generated from our initial test set, the model had similarly good test performance in predicting elevated RV %pred. The sensitivities and specificities to predict RV %pred > 150%, 175%, 200%, and 225% are listed in Table 4. To predict an RV %pred > 175%, the model had a sensitivity of 0.82 and specificity of 0.83 in this separate validation dataset.
These data suggest that our generated model using only spirometric and demographic variables performs well in predicting elevated RV in patients with COPD.
Discussion
We have developed and validated a model that provides a simple framework to predict elevated RV from more accessible spirometric and demographic measurements in 2 separate cohorts. The estimate derived from our model (RV %est) represents 58% of the variance of plethysmographically measured RV %pred measurements in a validation cohort of COPD patients, a value significantly greater than with any single spirometric measure. This model offers a hyperinflation metric that could be used to identify potential candidates for lung volume reduction referral. Further, the model can be integrated into existing databases to complement epidemiologic analyses addressing the potential impact of lung hyperinflation on health outcomes.
Our model offers a reliable method to identify individuals with an elevated RV who could benefit from lung volume reduction procedures and could be applied as a selection tool for referral of patients from settings with poor access to lung volume measurements. Despite the proven benefit of increased survival with lung volume reduction surgery (LVRS), and in both symptoms and exercise tolerance through both bronchoscopic LVR and LVRS,8-10 the procedures are underutilized relative to the number of potential patients who could benefit.15-17 A critical metric in selecting patients who could benefit from BLVR is hyperinflation, with an RV %pred of >150% recommended for LVRS, and a value >175% recommended for BLVR.7,8 Our model can be applied to patients with available spirometry measurements, extending the applicability of these measures to referral of patients for BLVR. While our model can enhance the identification of appropriate patients for referral, we would anticipate formal measurement of lung volume at specialty centers prior to proceeding with any LVR intervention. Values generated using our model could be incorporated into the UK National Institute for Health and Clinical Excellence and other international recommendations for referral to a specialist including “consideration for lung volume reduction procedures.”26-28 While there are several targeted areas of investigation to improve care gaps in COPD,26,29 incorporation of our model could be a strategy to improve identification of patients most likely to benefit from LVR techniques. To facilitate access to and impact of our model, the COPD Foundation has expressed an interest in promoting accessibility of our tool to community-based physicians following peer reviewed publication by incorporating the algorithm into the COPD Foundation Pocket Consultant Guide mobile app.30
Compared to spirometric measures, assessment of lung volumes is less rigorously standardized, requires more expensive and space-occupying plethysmography equipment, and is subject to significant methodologic variation. These variables can particularly affect measurements in patients with COPD. The variance in RV measurements in literature reports from academic centers ranges from 9.5% to 12.4%, in contrast to the less than 5% standard with spirometric measurements.13,14 Further, the potential methodologic nuances in the measurement are likely to result in even greater variance between different centers particularly in patients with severe air flow obstruction.8,12,31 These technical challenges may be obstacles preventing reliable lung volume measurements, especially in community settings where most patients with COPD are managed. A strength of this study is that the model to predict elevated RV was derived from spirometry and lung volume measurements using standardized guideline-based protocols, thus minimizing methodologic induced variance in RV measurements.
Given that measures of lung hyperinflation are uncommon in large epidemiologic databases, our model could be complementary to spirometric measures in performing analyses related to important health outcomes. The presence of lung hyperinflation is associated with coronary artery disease32 and mortality risk independent of spirometric measures,5,6,19,33 and the presence of hyperinflation predicts physiologic disease progression.18,34 Thus, deriving hyperinflation metrics from spirometry values could be complementary in future epidemiologic and mechanistic analyses which do not otherwise have access to lung volume measurements.
There are potential limitations to this study. Spirometry and lung volume measurements from both datasets were obtained at a single center, using a specific methodology and a limited range of equipment. While our model had excellent performance in predicting RV %pred at our center, how it performs using different methodology at other centers or with measurements using variations in methodology is unknown. On the other hand, our center used rigorous guideline-based methodology which was implemented in the clinical trials which determined the hyperinflation selection criteria for LVR interventions. Second, our model was generated in cohorts of patients with tobacco-associated airflow obstruction; thus, the utility of our model would need to be validated in cohorts with different disease pathogenesis. However, we expect similar performance in patients with known or highly suspected COPD. Our model does appear to underestimate observed lung volume at values higher than 250% predicted, a factor likely related to the somewhat lower correlation in the validation set which had a greater proportion of patients in this range; however, these represent uncommon extremes of hyperinflation well beyond the thresholds that would guide current clinical practice selection decisions. Finally, our model was developed using the ECCS lung volume reference equations and may be less precise in determining values using difference standards. It is reassuring, however, that the correlation between ECCS RV %pred and Crapo RV %pred was 0.98 in our test sets. Despite these concerns, the values represented by our model likely reflect the variation in hyperinflation, independent of the absolute values that may be obtained using different techniques or reference equations. Lastly, lung volume selection criteria for volume reduction are generally based on post-bronchodilator values, so clinicians applying this model to pre-BD only values must consider that this may affect test characteristics. However, clinical decision thresholds are not likely to be significantly affected using pre-BD values.
In conclusion, we describe a model to predict elevated RV from simple spirometric and demographic measurements. Our model is highly correlated with observed plethysmographic measurements and exhibits excellent test characteristics, with a sensitivity of 0.95 and specificity of 0.86, to predict a RV %pred of >175%. This tool may be useful in identifying patients with severe hyperinflation in a community setting for referral to specialty centers for lung volume reduction procedures. Applied more broadly, this model may serve as a tool to integrate the presence of hyperinflation into epidemiologic databases.
Acknowledgements
Author contributions: JE provided formal analysis, investigation, visualization, writing of the original draft, writing review & editing. SMN provided formal analysis, investigation, methodology, project administration, validation, visualization, writing review, and editing. FC provided conceptualization, data curation, formal analysis, funding acquisition, investigation, methodology, project administration, resources, supervision, and writing review and editing.
The authors thank Chad Karoleski and Robert Wilson for database and computational assistance and Byron Thomashow, MD, for his encouragement in the development of this model to include in the COPD Foundation Pocket Consultant Guide mobile app.
Declaration of Interest
The authors have no conflicts of interest to declare.