Running Head: Air Pollution and Sleep Quality in SPIROMICS
Funding support: SPIROMICS was supported by contracts from the National Heart, Lung, and Blood Institute (NHLBI), (HHSN268200900013C, HHSN268200900014C, HHSN268200900015C, HHSN268200900016C, HHSN268200900017C, HHSN268200900018C, HHSN268200900019C, HHSN268200900020C, U01 HL137880 and U24 HL141762), and grants from the National Institutes of Environmental Health Sciences (NIEHS) (R01ES023500). SPIROMICS was supplemented by contributions made through the Foundation for the National Institutes of Health (NIH) and the COPD Foundation from AstraZeneca/MedImmune; Bayer; Bellerophon Therapeutics; Boehringer-Ingelheim Pharmaceuticals, Inc.; Chiesi Farmaceutici S.p.A.; Forest Research Institute, Inc.; GlaxoSmithKline; Grifols Therapeutics, Inc.; Ikaria, Inc.; Novartis Pharmaceuticals Corporation; Nycomed GmbH; ProterixBio; Regeneron Pharmaceuticals, Inc.; Sanofi; Sunovion; Takeda Pharmaceutical Company; Theravance Biopharma, and Mylan.
Date of Acceptance: December 22, 2022 | Published Online Date: January 3, 2023
Abbreviations: BMI=body mass index; COPD=chronic obstructive pulmonary disease; CI=confidence interval; FEV1=forced expiratory volume in 1 second; FVC=forced vital capacity; HS=high school; IQR=interquartile range; OR=odds ratio: PMSQ=Pittsburgh Sleep Quality Index, PM2.5=fine particulate matter; ppb=parts per billion; SPIROMICS AIR=SubPopulations and InteRmediate Outcome Measures In COPD Study, Air Pollution ancillary study; VIF=variance inflation factor; Yr=year
Citation: Sowho MO, Koch AL, Putcha N, et al. Ambient air pollution exposure and sleep quality in COPD. Chronic Obstr Pulm Dis. 2023; 10(1): 102-111. doi: http://doi.org/10.15326/jcopdf.2022.0350
Introduction
Air pollution exposure is a major public health concern thought to be an important determinant of lung and sleep health.1-3 More than 4 in 10 Americans live in counties across the nation with unhealthy levels of ozone or particulate matter pollution.4 Air pollution exposure may have implications for sleep quality and health outcomes, especially in patients with respiratory disorders.
Chronic obstructive pulmonary disease (COPD) is a highly prevalent respiratory disorder characterized by poor sleep quality.5-7 Sleep disturbance in COPD patients is largely attributed to nocturnal breathing difficulties, hypoxemia, and medications.6-8 It is unclear, however, if ambient air pollution exposure is also a risk factor for poor sleep quality among COPD patients. Several studies conducted in the general population have revealed that those who live in areas with greater ambient air pollution have poorer sleep quality, particularly those with concomitant sleep apnea.9,10 Given the compromise in lung function, COPD patients may be uniquely vulnerable to the effect of air pollution exposure on sleep quality. In addition, factors such as obesity and smoking may modulate the relationship between air pollution exposure and sleep quality in COPD, since they predispose to sleep apnea,11-13 and are known to be associated with inflammation.14-17
Our goal was to examine the association between ambient air pollution exposure and sleep quality in COPD patients. We analyzed ambient air and sleep quality data collected from the Subpopulations and InteRmediate Outcome Measures In COPD Study (SPIROMICS)18 and SPIROMICS Air Pollution (SPIROMICS AIR) ancillary study. We hypothesized that: (1) ambient air pollution exposure would be associated with worse sleep quality in patients with COPD, and that (2) the association of ambient air pollution exposure and sleep quality would be modified by obesity, such that obese patients are more susceptible to the adverse effects of ambient pollution exposure. We also hypothesized that (3) the association of ambient air pollution exposure and sleep quality would be modified by smoking status, such that current smokers are more susceptible to the adverse effects of ambient pollution exposure.
Methods
Study Population
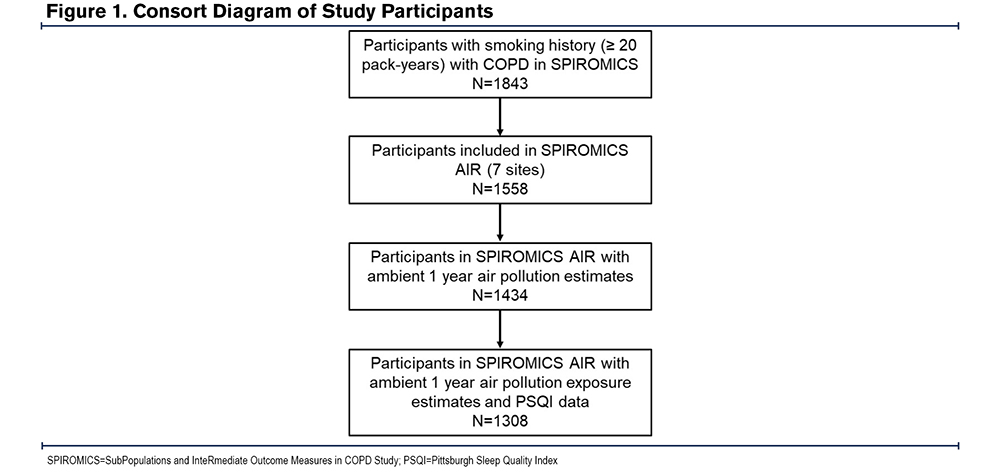
The current cross-sectional analysis was conducted on data collected from current and former smokers (≥20 pack years) with COPD enrolled in the SPIROMICS AIR study.18 Participants were enrolled at 7 (New York City, New York; Baltimore, Maryland; Los Angeles, California; Ann Arbor, Michigan; San Francisco, California; Salt Lake City, Utah; and Winston-Salem, North Carolina) of the 12 SPIROMICS clinical sites.18
SPIROMICS participants who were current or former smokers with COPD (postbronchodilator forced expiratory volume in 1 second [FEV1] to forced vital capacity [FVC] ratio < 70%) and who had available air pollution exposure and sleep quality data were included in our analyses (Figure 1). SPIROMICS was approved by the institutional review board at each of the clinical centers. All study participants provided written informed consent.
Assessment of Ambient Particulate Matter and Ozone
Participant addresses were obtained and geocoded with a geographic information system (ArcGIS 10.3; ESRI). Two-week mean outdoor concentrations of fine particulate matter (PM2.5) and ozone outside each participant’s home were predicted using spatiotemporal modeling methods.19,20 The 2-week air pollution exposures were used to calculate the mean 1-year PM2.5 (1 Yr-PM2.5) and 1-year ozone (1 Yr-ozone) levels,19,20 which we used for our analyses.
Assessment of Sleep Quality
We assessed sleep quality with the Pittsburgh Sleep Quality Index (PSQI). The PSQI is a validated self-rated survey that evaluates sleep quality and disturbances over a 4-week period. It is an 18-item questionnaire comprising 7 sub-sections, each scored 0-3, allowing for total scores ranging from 0-21, with higher scores representing poorer sleep quality.21
Statistical Analyses
Participant characteristics were described using the median with interquartile range (IQR) for continuous variables and n (%) for the categorical variables. We modeled 1 Yr-PM2.5 and 1 Yr-ozone as continuous variables by increments of 10 µg/m3 and 5 parts per billion (ppb) respectively. PSQI was examined as a continuous composite score and also as a dichotomous outcome based on PSQI total scores above and below the threshold for poor sleep quality (> 5 and ≤ 5).21 To address our hypotheses, we examined the association of 1 Yr-PM2.5 and 1 Yr-ozone as the independent variables and PSQI as the dependent variable using linear and logistic regression in unadjusted and adjusted models. In adjusted models, we adjusted for age, sex, race, education, income, current smoking status, smoking pack years, FEV1% predicted, body mass index (BMI) (continuous), and occupational exposure, which refers to self-reported exposure to vapor, gases, dust, and fumes in the longest held job. The adjusted model also included study site and neighborhood poverty rate, which represents the percentage of families below the poverty level in a census tract based on 2010 American Community Survey 5-year estimates.22 We performed sequential covariate adjustments to check against potential over-adjustment and checked for multicollinearity in the fully adjusted model using the variance inflation factor (VIF).23,24 We examined whether BMI category (lean/normal weight, < 25kg/m2; overweight, ≥25kg/m2 and < 30kg/m2; and obese, ≥30 kg/m2) and smoking status modified the association of ambient air pollution exposure and PSQI. Effect modification was tested by introducing an interaction term of categorical BMI and smoking status in the adjusted models.
Since sex-related differences in fat distribution can impact tidal volumes25-27 and potential air pollutant deposition in the lungs, in post-hoc analyses we examined whether sex modified the association of ambient air pollution exposure and PSQI in the 3 BMI categories (lean/normal weight, overweight, and obese).
All analyses were performed using STATA (version 15.1).
Results
Participant Characteristics
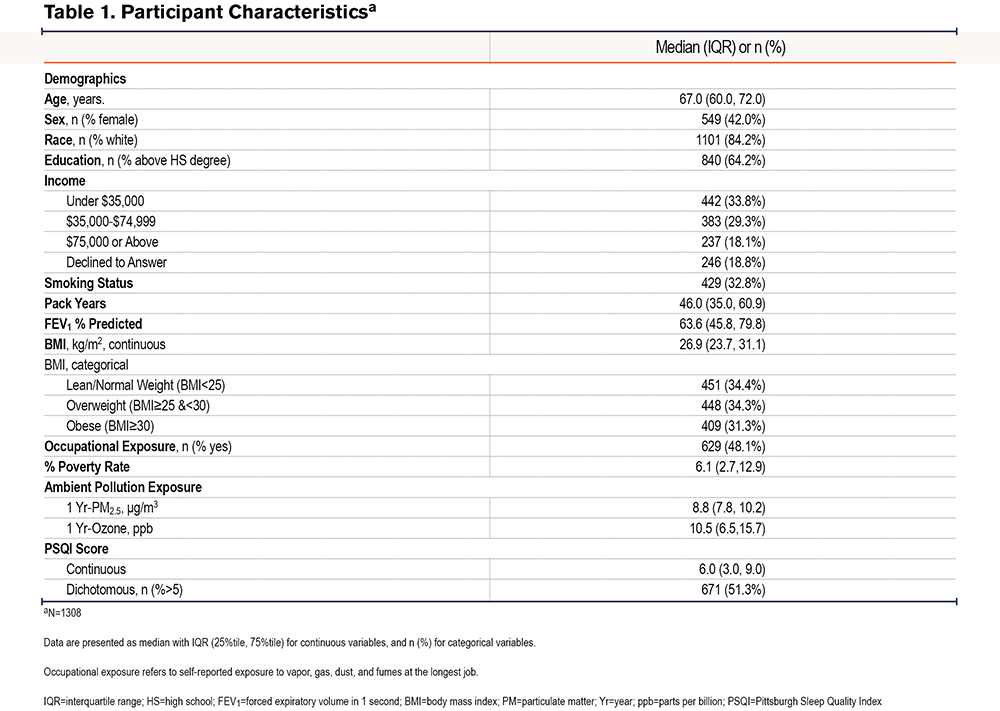
A total of 1308 SPIROMICS AIR participants with COPD had available PSQI scores as well as 1-Yr historical PM2.5 and ozone exposure data. As shown in Table 1, the median age was 67 years and the median BMI was 26.9 kg/m2, with women comprising 42% of the participants. The group had a median 1-Yr PM2.5 exposure of 8.8 μg/m3 and a median 1-Yr ozone exposure of 10.5 ppb. The median PSQI score was 6.0 and approximately half (51.3%) of the participants had PSQI scores greater than 5, which is the validated threshold for poor sleep.21
Association of Ambient Air Pollution Exposure and Pittsburgh Sleep Quality Index
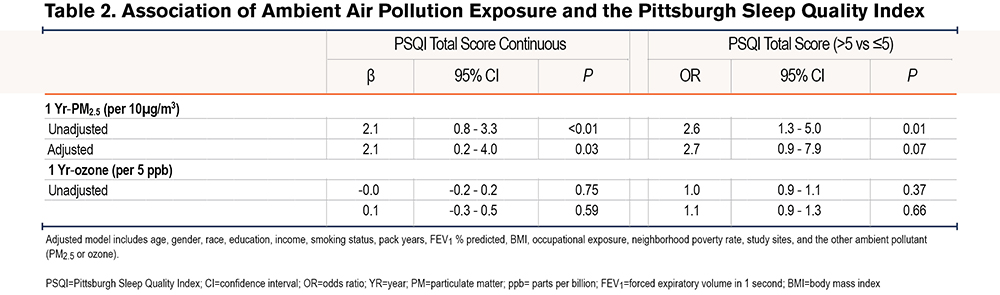
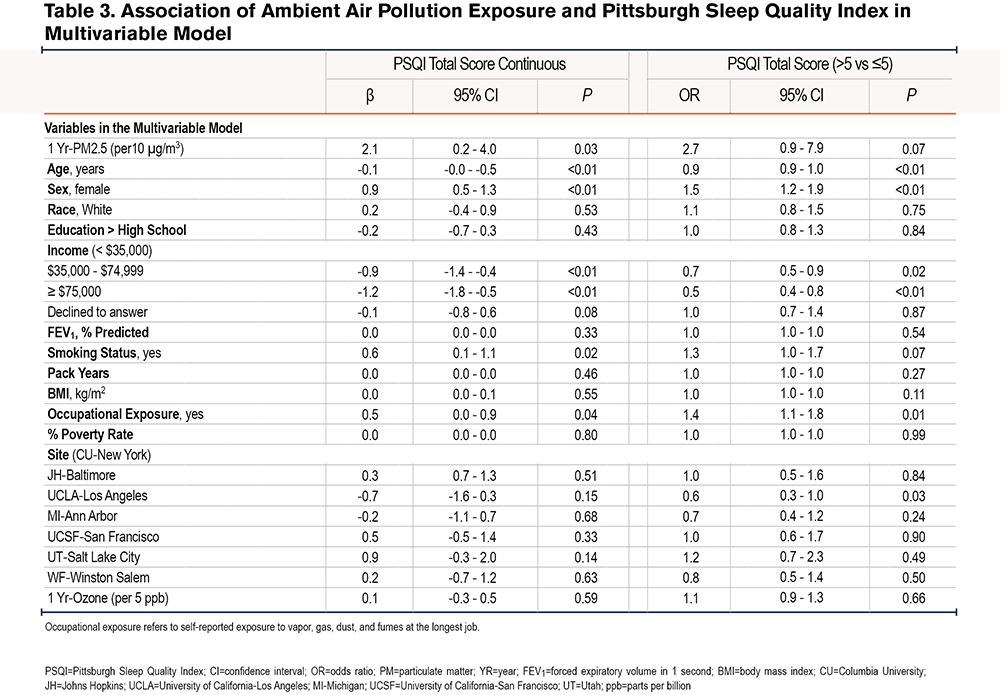
Linear regression analyses revealed a positive association between 1 Yr-PM2.5 and PSQI, such that a 10µg/m3 increase in 1 Yr-PM2.5 was associated with a 2.1 point (95% confidence interval [CI]: 0.8-3.3, P<0.01) increase in PSQI in the unadjusted model, and a 2.1-point increase (95% CI: 0.2-4.0, P=0.03) in the adjusted models. Logistic regression also revealed a positive association between 1 Yr-PM2.5 and the odds of poor sleep quality (PSQI>5) in the unadjusted (OR=2.6, 95% CI: 1.3-5.0, P=0.01), and adjusted (OR=2.7, 95% CI: 0.9-7.9, p=0.07) models. 1 Yr-Ozone was not associated with PSQI either as continuous or categorical (Table 2 and Table 3).
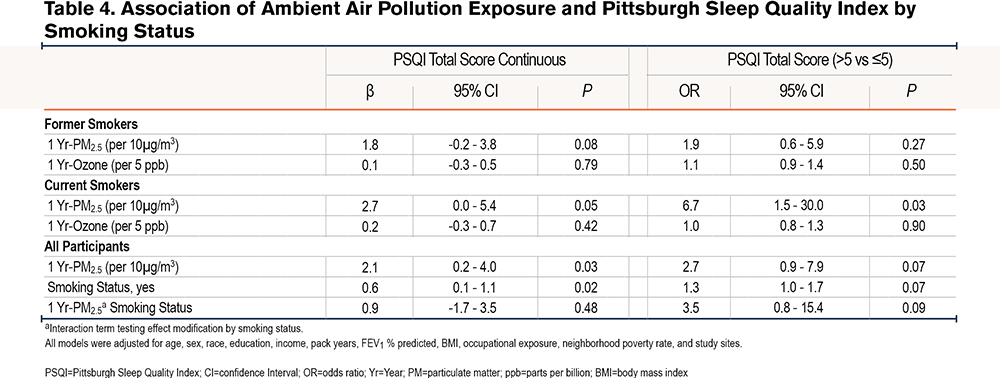
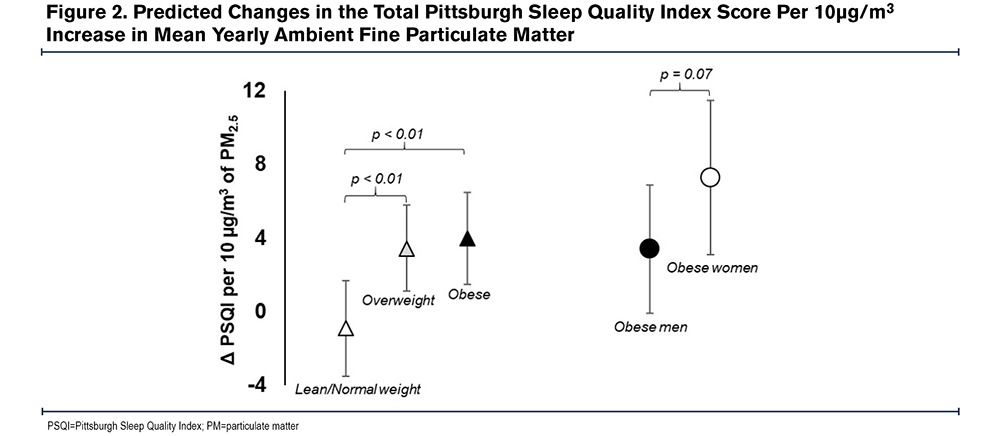
Additionally, in comparison to lean-normal weight, the linear association between 1-Yr PM2.5 and PSQI was amplified among overweight (βinteraction=4.2, 95% CI: 1.5-7.0, P<0.01) and obese participants (βinteraction=4.8, 95% CI: 1.9-7.7, P<0.01). For example, a 10µg/m3 increase in 1 Yr-PM2.5 was associated with a 3.4 point (95% CI: 1.0-5.8, P=0.01) increase among the overweight, a 4.0 point (95% CI: 1.5 - 6.5, P<0.01) increase in PSQI among the obese but was not associated with PSQI among the lean-normal weight (β=-0.8, 95% CI: -3.4-1.7, P=0.52). Similarly, the relationship between 1-Yr PM2.5 and the odds of poor sleep quality was amplified among current smokers compared to former smokers (OR interaction=3.6, 95% CI: 0.8-15.4, P = 0.09), as a 10µg/m3 increase in 1-Yr PM2.5 was associated with a 6 times higher odds of poor sleep quality among current smokers (OR=6.7, 95% CI: 1.5-30.0, P=0.01) but not associated with the odds of poor sleep quality among former smokers (OR=1.9, 95% CI: 0.6-5.9, P=0.27) (Table 4). Within obese participants (n=409), the adverse linear association of 1 Yr-PM2.5 with PSQI tended to be greater among women than among men (βinteraction=3.9, 95% CI: -0.4-8.2, P=0.07), with a 10µg/m3 increase in 1 Yr-PM2.5 associated with a 7.3 point (95% CI: 3.1-11.5, P<0.01) increase in PSQI among women and a 3.4 point (95% CI: -0.1-6.9, P=0.06) increase in PSQI in men. There was no sex difference in the relationship between 1 Yr-PM2.5 and PSQI among overweight (βinteraction=-1.1, 95% CI: -5.1-2.8, P=0.57) or lean-normal participants (βinteraction=1.3, 95% CI: -3.2-5.7, P=0.57). The modifying effect of weight and sex on the relationship between 1 Yr-PM2.5 and PSQI is shown in Figure 2.
The sequential covariate adjustment for checking against potential over-adjustment showed that our results were robust across inclusion of different covariates; and, in our final fully adjusted model, none of our predictors’ VIF exceeded the conventional benchmark23,24 of 4, suggesting no serious multicollinearity issue.
Discussion
In this cross-sectional analysis of ambient air pollution exposure and subjective sleep quality in the SPIROMICS cohort, we found that an increased ambient 1 Yr-PM2.5 but not 1 Yr-ozone was associated with a higher PSQI, indicating worse sleep quality. We also found that the association of 1 Yr-PM2.5 and PSQI was modified by obesity and smoking status, such that overweight-obese participants were more susceptible to the adverse effects of air pollution exposure compared to normal weight adults and current smokers more susceptible compared to former smokers. Furthermore, female obese participants seemed to be more susceptible than male obese participants.
A recent systematic review by Liu et al showed that in a general population cohort, ambient pollution exposure was associated with poor sleep quality.2 Our study confirms this finding in the SPIROMICS cohort, a nationally diverse group of COPD patients. Our results indicate that a 10 µg/m3 increase in 1 Yr-PM2.5 is associated with a 2.1 unit increase in PSQI, a self-reported measure of poor sleep quality, and a 3 times higher odds of having poor sleep quality defined21 by a PSQI score greater than 5. Previous studies have reported a minimum clinically important difference of 3 units for PSQI,28,29 suggesting that an increase of 15 µg/m3 in PM2.5 exposure can result in clinically significant worsening in sleep quality. Although poor sleep quality is prevalent in COPD, our results imply that ambient PM2.5 is a potential contributor.
Associations between ambient PM2.5 and sleep quality in COPD may be driven by several mechanisms. The deposition of particulate matter in the lungs could lead to alveolar inflammation and a worsening of the inefficient gas exchange3 already present in COPD. Inefficient gas exchange will promote hypercapnia and hypoxia increasing respiratory drive and sympathetic activation, which would culminate in micro-arousals and sleep disruption. Air pollutants may also irritate the nasal and pharyngeal mucosa leading to upper airway inflammation, exacerbating sleep apnea, and yielding more breathing difficulties that can disrupt sleep. Alteration of CNS control of sleep, increased depression, and anxiety are other mechanisms by which air pollution exposure may contribute to poor sleep.30,31
Our findings further suggested interactions between weight and ambient PM2.5, sex and ambient PM2.5, and between smoking status and ambient PM2.5. For example, ambient PM2.5 was associated with sleep quality only in overweight-obese participants, suggesting that this COPD subgroup is more vulnerable to the effect of air pollution exposure on sleep. In the overweight-obese patients who may have COPD-obstructive sleep apnea overlap, increased risk for sleep- disordered breathing due to air pollution exposure32 may explain poorer sleep quality. It is also possible that the inflammation provoked by air pollution exposure is synergistic with the chronic inflammatory state of obesity,14-16 thereby promoting sleep-disordered breathing. Overweight-obese persons also have greater minute ventilation given the greater metabolic demand,33,34 possibly increasing the dose of inhaled air pollutants over time.27 Increased minute ventilation may also explain why there was a stronger association of ambient PM2.5 and sleep quality in obese women compared to obese men, since obesity in men is associated with visceral fat deposition unlike subcutaneous adiposity in women,25,26 which is more likely to allow for lung expansion and air pollutant deposition in the lungs.35,36 The lack of an interaction between sex and ambient PM2.5 in the lean/normal weight and overweight BMI categories suggests that differential fat distribution is most likely to impact the relationship of air pollution exposure and sleep quality at BMI levels above 30 kg/m2. On the other hand, increased upper airway inflammation and susceptibility to sleep apnea might explain the stronger association of ambient PM2.5 and sleep quality observed in the current smokers compared to former smokers. Our results also show that current smokers have worse sleep quality compared to former smokers (Table 3 and Table 4), which implies that smoking cessation might improve sleep quality.
Of note, there was no association between ambient ozone and sleep quality, suggesting that the effect of air pollution exposure on sleep may be dependent on the type of air pollutant. The lack of an association could mean that ozone does not irritate the upper airway mucosa, nor does it persist in the alveoli long enough to significantly alter gas exchange nocturnally. It also suggests that ozone does not provoke inflammation as much as PM2.5. In addition, it is possible that ambient ozone levels were not substantial enough to disrupt sleep.
We acknowledge, however, several limitations in interpreting our findings. First, our study lacked objective assessment of sleep and diagnostic validation of sleep-disordered breathing. Recognizing this limitation, it is pertinent that future projects investigating the effect of air pollution on sleep quality, characterize sleep and breathing with gold standard polysomnography. It will also be useful to employ rigorously tested patient-reported sleep assessment tools such as the PROMIS Sleep-Related Impairment and Sleep Disturbance questionnaires that capture unique psychometric domains of sleep quality.37,38 Furthermore, focused assessments like home-based actigraphy may reveal movement disorders and changes in circadian rhythm as potential links between air pollution exposure and sleep health disruption. Second, we did not account for the level of indoor air pollution exposure, which could have been different between participants and, therefore, confounded our results. Finally, we realize that even though environmental air pollution measurement provides an index of patient exposure, it does not represent the dose or volume of air pollutants inhaled. Future studies should, therefore, include methods to estimate the amount of air pollutants deposited in the airways and alveoli, and also quantify tidal volume and minute ventilation. Nevertheless, there are several strengths of this study. Our analysis is based on a large, well-defined, nationally diverse cohort with fine spatiotemporal modeling of ambient air pollution exposure. In addition, this is the first study, to our knowledge, which has evaluated the association between air pollution exposure, obesity, and sleep disturbances in COPD.
Implication
Air pollution exposure may be an important predisposing factor for poor sleep in COPD, with smokers, overweight-obese, and in particular, obese female subgroups, being the most vulnerable. Hence, adopting strategies to mitigate air pollution exposure may improve sleep quality in these vulnerable patient groups. Identification of vulnerable groups in our study also highlights potential mechanisms by which air pollution exposure might affect sleep quality. Future work should, therefore, adopt a multi-dimensional approach to sleep health assessment39,40 to improve the characterization of sleep quality, while investigating the possible role of inflammation, sleep-disordered breathing, and lung mechanics on the effect of air pollution exposure on sleep quality.
Acknowledgement
Author contributions: MOS, ALK, and NNH contributed to the conception and design of the study and drafted the manuscript; IB, RGB, RPB, APC, CBC, DC, MRZ, MKH, VK, JAK, JDK, RP, SPP, PGW, and NNH contributed to the acquisition of the data. MS and HW analyzed the data; MS, HW, and NNH contributed to data interpretation; all authors contributed to revisions of the manuscript, reviewed, and approved the final manuscript.
Data sharing: More information about the study and how to access SPIROMICS data is available at www.spiromics.org
The authors thank the SPIROMICS participants and participating physicians, investigators, and staff for making this research possible. The authors would like to acknowledge the University of North Carolina at Chapel Hill BioSpecimen Processing Facility for sample processing, storage, and sample disbursements (http://bsp.web.unc.edu/). We would like to acknowledge the following current and former investigators of the SPIROMICS sites and reading centers: Neil E. Alexis, MD; Wayne H. Anderson, PhD; Mehrdad Arjomandi, MD; Igor Barjaktarevic, MD, PhD; R. Graham Barr, MD, DrPH; Patricia Basta, PhD; Lori A. Bateman, MSc; Surya P. Bhatt, MD; Eugene R. Bleecker, MD; Richard C. Boucher, MD; Russell P. Bowler, MD, PhD; Stephanie A. Christenson, MD; Alejandro P. Comellas, MD; Christopher B. Cooper, MD, PhD; David J.Couper, PhD; Gerard J. Criner, MD; Ronald G. Crystal, MD; Jeffrey L. Curtis, MD; Claire M. Doerschuk, MD; Mark T. Dransfield, MD; Brad Drummond, MD; Christine M. Freeman, PhD; Craig Galban, PhD; MeiLan K. Han, MD, MS; Nadia N. Hansel, MD, MPH; Annette T. Hastie, PhD; Eric A. Hoffman, PhD; Yvonne Huang, MD; Robert J. Kaner, MD; Richard E. Kanner, MD; Eric C. Kleerup, MD; Jerry A. Krishnan, MD, PhD; Lisa M. LaVange, PhD; Stephen C. Lazarus, MD; Fernando J. Martinez, MD, MS; Deborah A. Meyers, PhD; Wendy C. Moore, MD; John D. Newell, Jr, MD; Robert Paine, III, MD; Laura Paulin, MD, MHS; Stephen P. Peters, MD, PhD; Cheryl Pirozzi, MD; Nirupama Putcha, MD, MHS; Elizabeth C. Oelsner, MD, MPH; Wanda K. O’Neal, PhD; Victor E. Ortega, MD, PhD; Sanjeev Raman, MBBS, MD; Stephen I. Rennard, MD; Donald P. Tashkin, MD; J. Michael Wells, MD; Robert A. Wise, MD; and Prescott G. Woodruff, MD, MPH. The project officers from the Lung Division of the National Heart, Lung, and Blood Institute were Lisa Postow, PhD, and Lisa Viviano, BSN;
Declaration of Interest
Dr. Paulin reports receiving grants from the National Institute of Environmental Health Sciences (NIEHS) during the conduct of the study. Dr Gassett reports receiving grants from the National Institutes of Health (NIH) and the U.S. Environmental Protection Agency (EPA) during the conduct of the study. Dr. Peters reports receiving grants from the NIH/NHLBI during the conduct of the study. Dr. Krishnan reports receiving grants from the NIH/NHLBI during the conduct of the study. Dr. Paine reports receiving grants from the NHLBI and the COPD Foundation during the conduct of the study as well as grants from the Department of Veterans Affairs outside the submitted work. Dr. Woodruff reports receiving grants from the NIH/NHLBI and COPD Foundation during the conduct of the study as well as personal fees from Glenmark Pharmaceuticals, Theravance, GlaxoSmithKline, NGM Pharmaceuticals, Amgen, Genentech, Regeneron, Sanofi, AstraZeneca, and 23andMe outside the submitted work. Dr. Cooper reports receiving personal fees from GlaxoSmithKline outside the submitted work. Dr. Barr reports receiving grants from the NIH and COPD Foundation during the conduct of the study. Dr. Comellas reported receiving grants from the NIH/NHLBI, NIH/NIEHS, and NIH/National Center for Advancing Translational Sciences during the conduct of the study; personal fees from GlaxoSmithKline; and nonfinancial support from VIDA Diagnostics outside the submitted work. Dr. Han reports receiving personal fees from GlaxoSmithKline, Boehringer Ingelheim, Mylan, and AstraZeneca as well as nonfinancial support from Novartis and Sunovion outside the submitted work. Dr. Barjaktarevic reports receiving grants from Theravance, Mylan, Amgen, and GE Healthcare and has consulted for Theravance, Mylan, AstraZeneca, GlaxoSmithKline, Grifols, Verona Pharma, and GE Healthcare. Dr. Putcha reports receiving grants from the NHLBI during the conduct of the study. Dr Kaufman reports receiving grants from the NIH and the EPA during the conduct of the study. Dr. Hansel reports receiving grants and personal fees from AstraZeneca and GlaxoSmithKline; grants from Boehringer Ingelheim, the NIH, and COPD Foundation; and personal fees from Mylan outside the submitted work. No other disclosures were reported.