Running Head: PGE-2 and Macrophages in COPD
Funding support: This work was directly funded by the Johns Hopkins Division of Pulmonary and Critical Care INSPIRE award. The Clinical Trial of Air Cleaners to Improve Indoor Air Quality and COPD Health (CLEAN AIR) was supported by the National Institute of Environmental Health Sciences R01ES022607. The Comparing Urban and Rural Effects of Poverty on COPD (CURE COPD) study was supported by the National Institute for Minority Health and Health Disparities P50MD010431 and the U.S. Environmental Protection Agency (EPA) (agreement number 83615001). AF is supported by the National Heart, Lung, and Blood Institute K23HL151758. The metabolomics assessment is supported by the National Institutes of Health (NIH) instrument grant 1S10OD025226-01. This manuscript has not been formally reviewed by the EPA or NIH, and the views expressed in this document are solely those of the authors and do not necessarily reflect those of the EPA or NIH.
Trial Registration: ClinicalTrials.gov Identifier #NCT02236858
Date of Acceptance: March 10, 2023 | Published Online Date: March 20, 2023
Abbreviations: AECOPD=acute exacerbation of COPD; BCCS=breathlessness, cough, and sputum scale; BD=bronchodilator; CAT=COPD Assessment Test; CCQ=COPD Clinical Questionnaire; COPD=chronic obstructive pulmonary disease; COX=cyclooxygenase; DTT= dithiothreitol; ECSC=Ease of Cough and Sputum Clearance Score; FEV1=forced expiratory volume in 1 second; FEV1 %pred=FEV1 percentage predicted; FVC=forced vital capacity; ICS=inhaled corticosteroid; mMRC=modified Medical Research Council; MFI=mean fluorescence intensity; PGE-2=prostaglandin E2; PGE-M=urinary metabolite of PGE-2; SGRQ=St George’s Respiratory Questionnaire; TNF=tumor necrosis factor; TXA2=thromboxane A2
Citation: Tejwani V, Villabona-Rueda AF, Khare P, et al. Airway and systemic prostaglandin E2 association with COPD symptoms and macrophage phenotype. Chronic Obstr Pulm Dis. 2023; 10(2): 159-169. doi: http://doi.org/10.15326/jcopdf.2022.0375
Online Supplemental Material: Read Online Supplemental Material (278KB)
Introduction
Despite growing understanding of the pathophysiologic mechanisms of chronic obstructive pulmonary disease (COPD), treatment modalities have remained relatively limited. Polymorphisms in the cyclooxygenase (COX) pathway have been associated with development of COPD and COX-produced prostaglandin E2 (PGE-2) may be responsible for the inflammation observed in COPD.1,2 As such, there has been developing interest in the COX pathway, its role in COPD, and the potential of targeted therapeutics.
Two isoforms of the COX enzyme, one constitutively expressed (COX-1) and the other induced by inflammatory signals (COX-2), are involved in the first step of converting the membrane phospholipid product arachidonic acid to prostaglandins and thromboxane A2 (TXA2), depending on cell or tissue specific enzymes.3 In platelets, arachidonic acid is primarily converted to thromboxane A2 whereas PGE-2 is formed in a larger variety of cells and tissues, resulting in context-specific pro-inflammatory or anti-inflammatory effects.4
Individuals with COPD have higher thromboxane levels than controls,5 and elevated urinary 11-dehydro-thromboxane B2, a stable metabolite of TXA2, has been associated with worse respiratory outcomes in stable COPD.6 Likewise, PGE-2 is elevated in individuals with COPD compared with controls and correlated with severity of airflow limitation.7,8 Supporting the potential pathogenic role of the COX pathway in COPD is observational data on aspirin, an irreversible blocker of the COX enzyme, demonstrating aspirin users have slower progression of subclinical emphysema,9 lower incidence rate of acute exacerbation of COPD (AECOPD), better quality of life, and less dyspnea among individuals with stable COPD.10 In asthma, elevated levels of airway PGE-2 have been associated with disease severity,11,12 although the mechanistic role of PGE-2 is controversial. Studies have suggested that PGE-2 limits inflammation and bronchoconstriction,13 while others have shown suppression of alveolar macrophage phagocytic activity14 by PGE-2 and argued that the anti-inflammatory effect may have been inaccurately attributed to PGE-2 instead of prostaglandin I2 (prostacyclin), another COX product.15 This raises the prospect that rather than promoting inflammation, the elevated PGE-2 may reflect a physiologic response to dampen inflammation in the airways.13 Underscoring this is that although a reduction in M1 macrophage and, therefore, phagocytosis capability, by PGE-2 may contribute to worse COPD morbidity,16 the M1 macrophages also release other pro-inflammatory cytokines – such as IL-1β, tumor necrosis factor (TNF), nitric oxide – that can worsen airway inflammation.17
To our knowledge, no studies have investigated whether elevated levels of PGE-2 are associated with respiratory symptoms in COPD. This may be a plausible biological mechanism for aspirin’s association with improved respiratory symptoms and support future studies targeting the COX pathway. Furthermore, since PGE-2 is produced by many different types of cells throughout the body,18 differentiating systemic PGE-2 from that present in the lung compartment is valuable. The goal of this study was to investigate whether levels of PGE-2 are associated with respiratory symptoms in COPD with specific attention to differentiating systemic PGE-2 from PGE-2 present in the lung compartment. We hypothesized that systemic and airway PGE-2 will be associated with worse respiratory symptoms and reduction of the highly phagocytic M1 macrophage with attendant increase in the less phagocytic and reparative M2 macrophage.
Methods
Study Cohort, Clinical Phenotyping and Sputum Induction
Study participants were former smokers (≥10 pack years) with COPD (post-bronchodilator forced expiratory volume in 1 second [FEV1] ≤80% predicted and FEV1 to forced vital capacity [FVC] ratio <0.7) enrolled in either of 2 studies (Clinical Trial of Air Cleaners to Improve Indoor Air Quality and COPD Health [ClinicalTrials.gov: NCT02236858] or Comparing Urban and Rural Effects of Poverty on COPD).19,20 A subset of participants (n=30) with both sputum and urine biospecimens were included in this study. To qualify for sputum induction, post-bronchodilator FEV1 percent predicted (FEV1 %pred) was required to be over 35% with no evidence of active infection or exacerbation within 2 weeks of the study visit. Informed written consent was obtained from all participants and the studies were approved by the Johns Hopkins Institutional Review Board.
Spirometry was performed according to American Thoracic Society criteria.21 Sputum induction was performed according to the methods of Alexis et al.22 Briefly, hypertonic saline was administered through the Aerosol Universal III nebulizer and sputum samples solubilized with Sputolysin. Cytocentrifugation and cytospin slides were generated with Diff-Quick for cell differentials and the pellet was re-suspended in freezing media and cryopreserved for future analysis. Sputum supernatant was stored at -80⁰C.
Sputum and Urine PGE-2 Assessment
Sputum supernatant PGE-2 was measured using an ELISA (Cayman chemicals, Ann Arbor, Michigan; limit of detection 7.8pg/mL) at the University of Maryland Cytokine Core Laboratory. Spike and recovery was performed according to manufacturer’s instructions on a subset of 8 samples with and without dithiothreitol (DTT) which confirmed that there was no difference in sputum supernatant PGE-2 levels based on presence of DTT. Therefore, samples with and without DTT were included in our study and analysis. A known amount of analyte was added to the sample matrix and standard diluent, and the 2 sets of responses were compared based on values calculated from a standard curve. The recovery and linearity of the assays after appropriate spiking experiments produced samples with values within the dynamic range of the assay.
Urine was collected at the study visit and stored at -80⁰C. The major urinary metabolite of PGE-2 (11alpha-hydroxy-9,15-dioxo-2,3,4,5-tetranor-prostane-1,20-dioic acid [PGE-M]) was measured via liquid chromatography-mass spectrometry. The metabolites were extracted using methanol as the extraction solvent. The samples were mixed with ice-cold methanol to achieve a final concentration of 80% (v/v) methanol. The sample was incubated at -80°C for a few hours, and the extracted metabolites were separated from the protein fraction by centrifugation. The samples further underwent a speed-vacuum process to remove the methanol and were then lyophilized to eliminate the water. The resultant metabolites in powder form were suspended in 50% acetonitrile (v/v) diluted in water, ready for acquisition.
The instrument used for metabolomic data acquisition was the Thermo Scientific Q Exactive Plus Orbitrap Mass Spectrometer coupled with a Vanquish UPHLC system. The column used for reverse-phase chromatography was a Discovery® HSF5 reverse phase HPLC column (Sigma) kept at 35° C with a guard column. The mass spectrometer performed both full MS scans for quantification of metabolites as well as full MS/ddMS2 scans for identifying metabolites via fragmentation pattern matching. The acquired raw data was subsequently analyzed using Thermo Scientific XCalibur, Compound Discoverer®, and TraceFinder® software packages and further normalized with respect to the protein concentration of the samples.
Absolute quantification of PGE-M was achieved by acquiring data from serial diluted purified standard of the metabolite (Cayman Chemical) with known concentrations. The acquired raw intensities were plotted against known concentrations of the standard to generate a calibration curve. The concentration of PGE-M within each individual patient urine sample was then extrapolated from the standard curve and adjusted for urinary creatinine concentration which was measured by ELISA (Quidel Corporation, San Diego, California; mg/mL) at the Johns Hopkins Institute for Clinical and Translational Research Core Laboratory.
Clinical Outcome Measures
The outcomes of interest were the occurrence of any mild, moderate, or severe COPD exacerbation during a 6-month follow-up, occurrence of at least one self-reported moderate or severe COPD exacerbation in the 12-month preceding the baseline visit, disease severity (FEV1 %pred), as well as respiratory symptoms, health status, quality of life, and presence of chronic bronchitis using questionnaires. Prospective exacerbations were ascertained via monthly telephone calls. A mild exacerbation was defined as a worsening of symptoms associated with increased rescue inhaler use whereas, a moderate or severe exacerbation was defined as worsening of symptoms leading to treatment with antibiotics or systemic glucocorticoids or resulting in an urgent care visit, emergency department visit, or hospitalization, respectively. The specific questionnaires completed the same day as the biospecimen collection were: the COPD Assessment Test (CAT),23 the modified Medical Research Council (mMRC) Dyspnea Scale,24 the St George’s Respiratory Questionnaire (SGRQ),25 Ease of Cough and Sputum Clearance (ECSC) score,26 breathlessness, cough, and sputum (BCCS) scale,27 and Clinical COPD Questionnaire (CCQ) score.28 A participant was considered to have chronic bronchitis if they met criteria using either the classic or alternative SGRQ definition.29
Macrophage Phenotyping
Participants with sputum samples with at least 1x10⁶ cells (n=16) were processed for flow cytometry. Cells were thawed and plated prior to incubation with Golgi Stop and Golgi Plug for 3 hours, then stained with UV excitable LIVE/DEAD (Invitrogen, Waltham, Massachusetts) discriminator and treated with human IgG (Rockland, Pottstown, Pennsylvania) to block Fc receptors. We stained with surface markers and cells were subsequently fixed and permeabilized for 30 minutes followed by intracellular staining. Fluorescence minus one was utilized to determine specificity for intracellular expression. Compensation was completed with UltraComp eBeads (eBioscience). Acquisition is performed using a FACSAria instrument with FACSDiva software (Becton Dickinson Biosciences) and FlowJo version 10.5.0 (Tree Star, Inc., Ashland, Oregon) for analysis. Flow cytometer gating strategy was as follows: single cells were identified first, subsequently, a UV excitable live dead discrimination assay (Invitrogen) was applied. Live cells that were CD45+ were included to identify leukocytes and subsequently, HLA-DR+ with characteristic side-scatter were gated to identify airway macrophages with CD14+ cells excluded to remove large monocytes (Figure E1 in the online supplement). We then measured the mean fluorescence intensity (MFI) and percentage of positive cells of each surface marker (CD64, CD80, CD163, and CD206) and intracellular cytokine (IL-1β and TGF-β1).
Statistical Analysis
Descriptive analyses were used to examine means and standard deviations or proportions and counts of baseline variables. Sputum PGE-2 and urinary PGE-M intensity were log-transformed due to positively skewed distribution and analyzed as continuous variables. Urinary PGE-M concentration was dichotomized as presence versus absence of PGE-M at the limit of detection (0 μg/mg creatinine). Logistic regression analyses were performed to evaluate the relationship between sputum PGE-2 and urinary PGE-M with the occurrence of at least one COPD exacerbation over a 6-month follow-up and during the 12 months prior to enrollment. Linear regression analyses were performed to evaluate the relationship between sputum PGE-2 and urinary PGE-M with respiratory symptoms (CAT, mMRC, ECSC, BCSS), health status (CCQ), quality of life (SGRQ), chronic bronchitis, and FEV1 %pred. All models were adjusted by age, race, sex, comorbidity count, self-reported use of aspirin, and FEV1 %pred (except in the model when it was the outcome) defined as potential confounders based on both theoretical considerations from prior literature and their bivariate associations (p<0.2) with sputum PGE-2 or PGE-M and any measured outcomes. An exploratory analysis investigating the association of PGE-2 and PGE-M with macrophage immune markers was conducted using linear regression with minimal adjustment for inhaled corticosteroid (ICS) use due to the smaller sample size. ICS was used as a covariate given the biologic effect of ICSs on macrophage marker expression.30 Analyses were carried out using R version 3.6.3.
Results
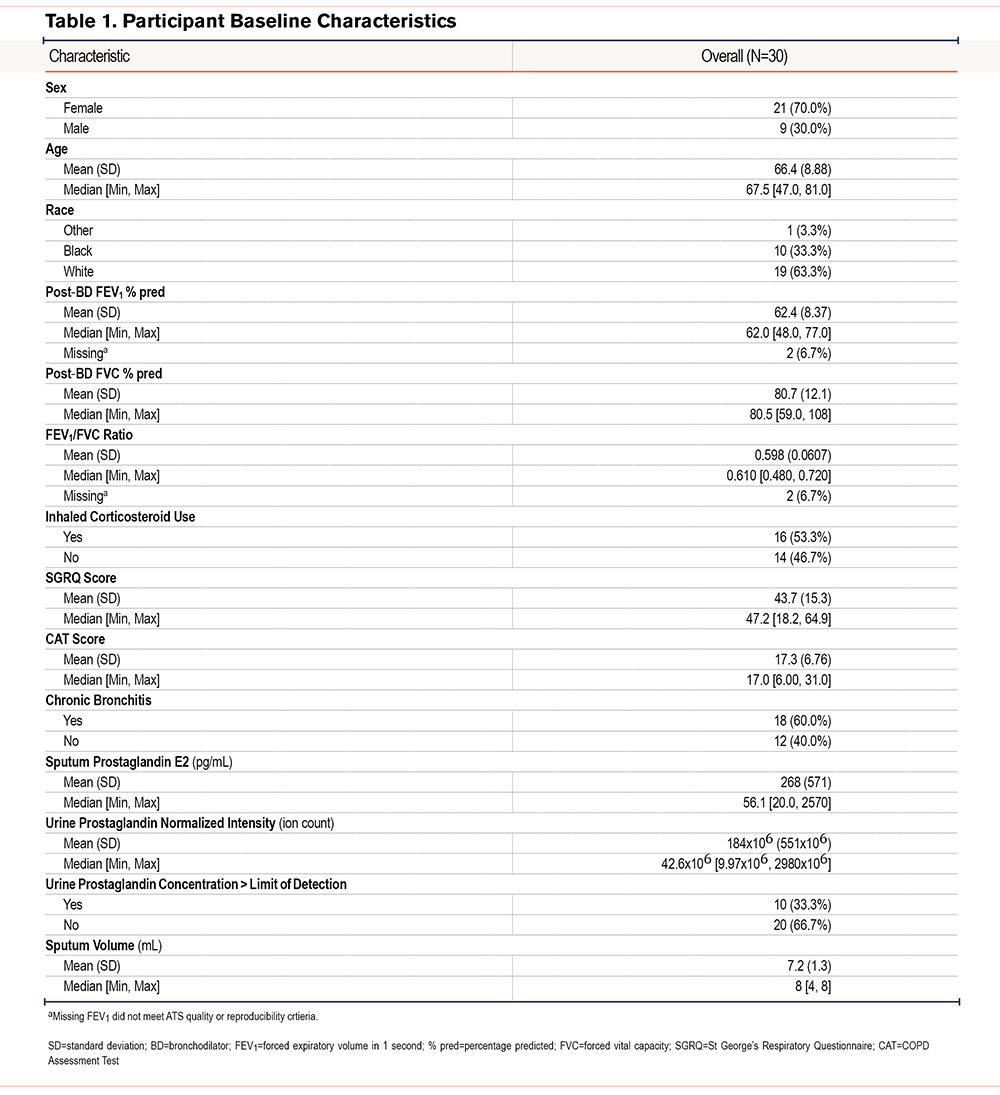
Participants had a mean±SD age of 66.4±8.9 and post-bronchodilator FEV1 %pred of 62.4±8.4 (Table 1).The mean±SD PGE-2 was 268±571pg/mL. The mean±SD normalized PGE-M intensity was 184x106±551x106 and 10 participants (33%) had a urine µg/mgCr above the limit of detection. There was poor correlation between sputum PGE-2 and urine PGE-M intensity (ρ=0.23).
Prostaglandin and COPD Outcomes
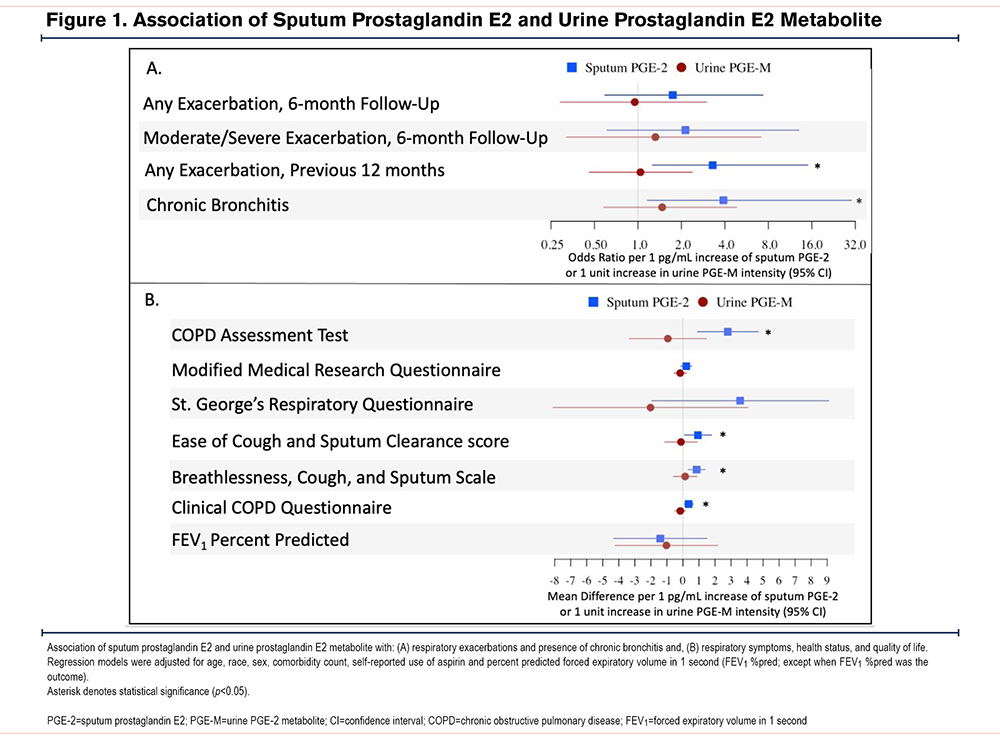
A 1pg/mL increase in sputum PGE-2 was associated with a higher odds of reporting at least one moderate/severe COPD exacerbation in the 12 months before enrollment (odds ratio [OR] 3.3, 95% confidence interval [CI]: 1.3, 15.0); worse respiratory symptoms as measured by CAT (mean difference [β] 2.8, 95% CI: 0.9, 4.7), ECSC (β 0.9, 95% CI: 0.1, 1.8), and BCSS (β 0.86, 95% CI: 0.33, 1.4); and health status as measured by CCQ (β 0.4, 95% CI: 0.09, 0.6); and higher odds of chronic bronchitis (OR 3.90, 95% CI: 1.16, 30.04) but not significantly associated with mMRC (β 0.2, 95% CI: -0.1, 0.6), SGRQ (β 3.6, 95% CI: -1.9, 9.1), or FEV1 %pred (β -1.41, 95% CI: -4.33, 1.51) (Figure 1). There was no association between sputum PGE-2 and odds of experiencing at least one COPD exacerbation during 6-month follow-up (OR 1.7, 95% [CI]0.6-7.3) or at least one moderate/severe COPD exacerbation (OR 2.1, 95% CI: 0.6-13) during 6-month follow-up. Urinary PGE-M was not associated with COPD exacerbations, respiratory symptoms, health status, or quality of life regardless of whether it was analyzed continuously as PGE-M intensity (Figure 1) or dichotomized based on PGE-M concentration above the limit of detection (Table E1 in the online supplement).
Prostaglandin and Macrophage Phenotype
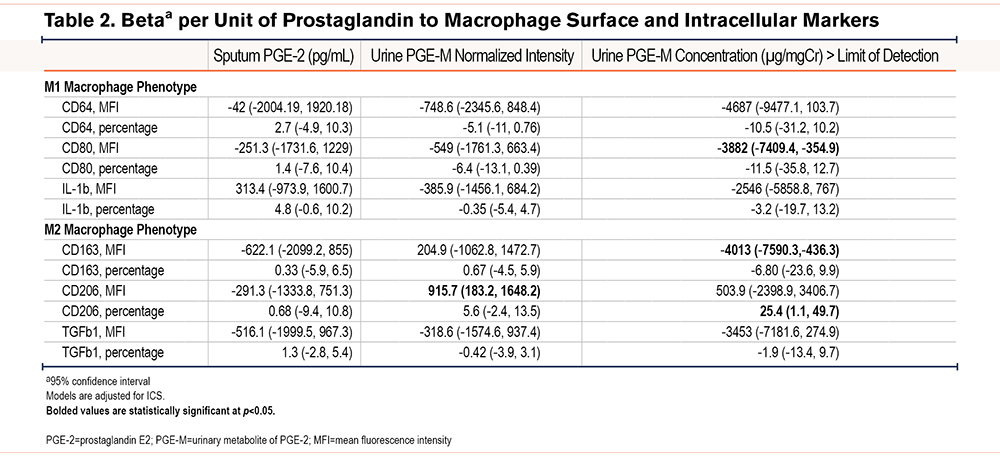
Macrophage receptor and intracellular cytokine MFI and percentage positive are shown in Table E2 in the online supplement. There was no association with sputum PGE-2 and any macrophage surface markers or intracellular cytokines (Table 2). While urinary PGE-M was not consistently statistically significantly associated with a specific macrophage phenotype, there was a directionally consistent negative relationship between PGE-M and M1 macrophages (Table 2).
Discussion
This study of former smokers with COPD demonstrates that elevated airway PGE-2 is associated with worse COPD respiratory symptoms and health status and higher odds of at least one respiratory exacerbation in the year preceding measurement. Previous studies have demonstrated that PGE-2 is increased in the airway of individuals with COPD and higher expression is associated with severity of airflow limitation.7,8 This study expands on this prior work by also showing an association with greater respiratory morbidity. Further, to our knowledge, this study is the first to assess systemic PGE-2 levels in COPD; however, the major urinary metabolite of PGE-2, a marker of systemic PGE-2 production, was not associated with any respiratory outcomes. This study expands our current understanding of the role of PGE-2, suggesting that airway, rather than systemic, PGE-2 is associated with worse morbidity in individuals with COPD.
The mechanism underlying the association of prostaglandin and worse COPD morbidity is controversial. It is plausible PGE-2 may be harmful in COPD given its reduction in pathogen engulfment (phagocytosis) and clearance (efferocytosis) capability of macrophages.14,31 It has been suggested that this may be through polarization of macrophages from the M1 to the M2 profile.32 We sought to explore this via flow cytometry phenotyping of airway macrophages but did not find an association with airway PGE-2 and macrophage profile, though results may have been underpowered. Interestingly, we found a trend towards a directionally inverse association with PGE-M and the more phagocytic M1 profile, suggesting systemic PGE-2 may be more directly involved in airway macrophage polarization. PGE-2 has also been shown to have harmful effects on other cells in COPD, causing an increase in senescence of fibroblasts and increased IL-8 levels that promote neutrophilic inflammation typical of COPD.2,33
Alternatively, the elevated PGE-2 may reflect a physiologic response to dampen inflammation in the airways given a number of potentially beneficial effects.13 Specifically, PGE-2 has been shown to promote bronchodilation,34 inhibit TGF-β promotion of extracellular matrix formation,35 and induce macrophage expression of IL-10 which is an anti-inflammatory cytokine helpful in dampening inflammation.36 It is hypothesized to do this through increasing the reparative M2 macrophage phenotype,30,37 although we observed heterogenous results when assessing both sputum PGE-2 and urine PGE-M to our M2 markers. An additional indirect bronchodilatory effect of PGE-2 may be through inhibition of TXA2 release from bronchial epithelial cells.38 TXA2 leads to bronchoconstriction and its major urinary metabolite, 11-dehydro-TxB2, has been associated with worse respiratory symptoms and quality of life in COPD.6,39 Furthermore, the reduction in M1 macrophage and therefore, phagocytosis capability by PGE-2 may contribute to worse COPD morbidity,16 however, there are other pro-inflammatory cytokines released by M1 macrophages – such as IL-1β, TNF, nitric oxide – that can worsen airway inflammation.17 Therefore, although the association of PGE-2 with worse COPD severity is becoming better established through this and prior studies, it remains unclear whether the presence of PGE-2 is perpetuating or responding to increased airway inflammation and merits further investigation. Notably the association between PGE-2 and respiratory exacerbations was only present for retrospective but not prospective exacerbations which may further indicate that PGE-2 is playing an anti-inflammatory role following an inflammatory insult.
The role of PGE-2 in asthma has been more extensively studied where it is thought to play a beneficial role.40 Akin to the findings of this study, several studies demonstrated an association between elevated levels of sputum PGE-2 and asthma severity.11,12,41 However, experimental evidence suggests PGE-2 inhibits both Th2 and Th1 cytokine production, inhibits eosinophil trafficking, and can inhibit mast cells specifically expressing EP2 and EP3 receptors.42-45 Future studies should specifically focus on investigating eosinophilic and atopic phenotypes of COPD as well as asthma-COPD overlap.
The strength of our study lies in the comprehensive phenotype data and measurement of PGE-2 from multiple compartments. There are limitations that merit discussion. The 30 study participants were selected because they underwent sputum induction, however, only half had adequate cells to perform flow cytometry which limited the power to detect associations of PGE-2 with macrophage phenotype. Furthermore, we adjusted for aspirin use based on self-reported medications in our model, however, participants may have been using non-steroidal anti-inflammatory drugs which can affect PGE-2 and we were unable to account for this in our analysis.46 We also did not have complete data on other inhalational use (e.g., vaping or marijuana) so could not account for the potential effect of these exposures. The requirement that participants have FEV1 %pred >35% to undergo sputum induction may limit generalizability to individuals with more severe COPD. Also, although we demonstrated an association of airway PGE-2 to COPD morbidity, our cross-sectional analysis could not evaluate whether the relationship is causal. Exacerbations assessed retrospectively at the study visit are subject to bias although the bias may be dampened by dichotomization of exacerbations as having occurred or not as opposed to relying on the specific exacerbation count. Although our macrophage phenotyping was conducted via a robust flow cytometry panel, it did not include transcriptional analysis and we also acknowledge evidence that the M1/M2 nomenclature may be binary modeling of a more continuous and dynamic polarization.47 Furthermore, we did not directly assess macrophage phagocytosis, however, our M1 panel did include CD80, which we have previously shown may be associated with worse COPD morbidity in this population and plays an important role providing costimulatory signals required for the development of antigen-specific immune responses.48,49
In conclusion, elevated levels of airway PGE-2 in induced sputum, rather than systemic PGE-2, is associated with increased respiratory symptoms and history of exacerbation among individuals with COPD. Whether the presence of PGE-2 in the lungs of individuals with worse COPD symptoms is protective or destructive remains unclear and requires further investigation with particular attention to specific disease phenotypes.
Acknowledgments
Author contributions: VT, NP, NNH, NEA, and AF conceived of the presented idea. VT, AFV, FD, NEA, and AF performed flow cytometry and processed flow cytometry data. VT, PK, C.Z, AL, and AF performed metabolomic studies and metabolite analysis. VT, NP, NNH, and AF performed biostatistical analysis. All authors discussed the results and contributed to the final manuscript.
Declaration of Interest
Dr. Tejwani, Dr. Villabona-Rueda, Mr. Khare, Ms. Zhang, Dr. Le, Dr. Putcha, Dr. D’Alessio, Dr. Alexis, and Dr. Fawzy have nothing to disclose. Dr. Hansel reports grants and personal fees from AstraZeneca, grants and personal fees from GSK, grants from Boehringer Ingelheim, grants from the COPD Foundation, and personal fees from Mylan, all outside the submitted work.