Running Head: Lung Volumes in COPD
Funding support: Support for MA, SZ, and JC work on this study was provided by grants from the Flight Attendant Medical Research Institute (CIA190001 to Arjomandi), the California Tobacco-Related Disease Research Program (T29IR0715 to Arjomandi), and the Department of Veterans Affairs (CXV-00125 to Arjomandi). SZ’s effort was also supported by the National Library of Medicine Training Grant under Award Number T15LM007442. RGBuhr’s effort was also supported by the National Institutes of Health (NIH)/National Center for Advancing Translational Sciences grant KL2TR001882. SPIROMICS was supported by contracts from the NIH/National Heart, Lung, and Blood Institute (NHLBI) (HHSN268200900013C, HHSN268200900014C, HHSN268200900015C, HHSN268200900016C, HHSN268200900017C, HHSN268200900018C, HHSN268200900019C, HHSN268200900020C), and supplemented by contributions made through the Foundation for the NIH and the COPD Foundation from AstraZeneca/MedImmune; Bayer; Bellerophon Therapeutics; Boehringer-Ingelheim Pharmaceuticals, Inc.; Chiesi Farmaceutici S.p.A.; Forest Research Institute, Inc.; GlaxoSmithKline; Grifols Therapeutics, Inc.; Ikaria, Inc.; Novartis Pharmaceuticals Corporation; Nycomed GmbH; ProterixBio; Regeneron Pharmaceuticals, Inc.; Sanofi; Sunovion; Takeda Pharmaceutical Company; and Theravance Biopharma. COPDGene was supported by Awards R01-HL-089897 and R01-HL-089856 from the National Heart, Lung, and Blood Institute. COPDGene is also supported by the COPD Foundation through contributions made to an Industry Advisory Board that has included AstraZeneca, Bayer Pharmaceuticals, Boehringer-Ingelheim, Genentech, GlaxoSmithKline, Novartis, Pfizer, and Sunovion.
Date of Acceptance: May 12, 2023 │ Published Online Date: May 16, 2023
Abbreviations: BMI=body mass index; CI=confidence interval; COPD=chronic obstructive pulmonary disease; COPDGene=COPD Genetic Epidemiology study; CT=computed tomography; EHRs=electronic health records; FEF25-75=forced expiratory flow at 25%–75%; FEF75=maximum airflow after 75% of lung volume exhaled; FEV1=forced expiratory volume in 1 second; FRC=forced residual capacity; FVC=forced vital capacity; IC=inspiratory capacity; ILD=interstitial lung disease; NHANES=National Health and Nutrition Examination Survey; NIH=National Institutes of Health; PFT=pulmonary function test; PRISM=preserved ratio-impaired spirometry; PRMAir trapping=parametric response mapping of percentage air trapping; PRMEMPH=parametric response mapping of functional small airway disease as measures of emphysema; PRMfSAD=parametric response mapping of functional small airway disease; RV=residual volume; SPIROMICS=SubPopulations InteRmediate Outcome Measures In COPD Study; SVC=slow vital capacity; TLC=total lung capacity; V1=visit 1; VA=Veterans Affairs; VAHCS=Veterans Affairs Health Care System; VC=vital capacity; VINCI=VA Informational Computing Infrastructure
Citation: Arjomandi M, Zeng S, Chen J, et al; COPD and SPIROMICS investigators. Changes in lung volumes with spirometric disease progression in COPD. Chronic Obstr Pulm Dis. 2023; 10(3): 270-285. doi: http://doi.org/10.15326/jcopdf.2022.0363
Online Supplemental Material: Read Online Supplemental Material (1533KB)
Introduction
In chronic obstructive pulmonary disease (COPD), the general understanding in the field has been that as airflow obstruction progresses, air trapping and hyperinflation worsen, and vital capacity (VC) and inspiratory capacity (IC) decrease.1-3 However, recent studies have suggested that in early disease, the development of spirometric COPD occurs from an increase in forced VC (FVC) while airflow obstruction (as measured by forced expiratory volume in 1 second [FEV1]) remains unaffected,4,5 a finding that is contrary to the current conventional wisdom. This finding triggered our interest to more precisely investigate how the lung volumes change during the development and progression of spirometric disease, as it remains unclear how underlying obstructive pathology may contribute to an increased FVC in early COPD.
This study aimed to examine the distributions of and changes in lung volumes with the development and progression of COPD. To achieve this goal, we first examined the differences in lung volumes by conducting cross-sectional analyses of patients with differing severity of COPD. Second, we examined the longitudinal changes in lung volumes in smokers with preserved spirometry to determine whether the changes in lung volumes mirrored the cross-sectional differences that we observed at baseline. For these analyses, we used the plethysmographic lung volume measurements from the pulmonary function test (PFT) results available in the U. S. Department of Veterans Affairs (VA) electronic health records (EHRs) and lung volume measurements derived from thoracic computerized tomography (CT) scans available in the National Institute of Health (NIH)-funded research cohorts of the COPD Genetic Epidemiology (COPDGene) study and the SubPopulations and InteRmediate Outcome Measures In COPD Study (SPIROMICS).
Methods
Study Design
Lung volumes measured by plethysmography in seated posture extractable from the VA EHR PFT data (n=71,356) and lung volumes measured by CT in supine posture from the COPDGene (n=7969) and SPIROMICS (n=2552) cohorts were examined over the spectrum of the spirometric airflow obstruction. VA EHR PFT data contained total lung capacity (TLC), VC, IC, residual volume (RV), and functional residual capacity (FRC). COPDGene CT data contained TLC and FRC while SPIROMICS CT data contained TLC and RV.
Longitudinal changes in the lung volumes were computed for patients/participants who had both spirometric and lung volume data available in a follow-up visit. For the SPIROMICS cohort, although spirometry data were available from multiple visits, lung volume measurements were only available at baseline and 1-year follow-up visits (the 5-year SPIROMICS II CT-measured lung volumes were not available at the time of this analysis). For the COPDGene cohort, CT-measured lung volumes were available from 3 visits (baseline, 5-year, and 10-year visits). For the VA EHR cohort, we identified the patients with available full PFT data ≥1 year or ≥3 years after their index PFT. These timeframes were chosen to match the follow-up time intervals available from the SPIROMICS and COPDGene cohorts.
In all 3 cohorts, patients/participants with preserved ratio and impaired spirometry or PRISm (those with a normal FEV1/FVC but reduced FEV1, as defined originally by COPDGene investigators)6 at any visit were excluded from the analysis, as they may have had a restrictive impairment affecting their lung volumes. Similarly, patients/participants who showed improvements in their follow-up spirometry, resulting in an improvement in their Global initiative for chronic Obstructive Lung Disease (GOLD)7 stage, were also excluded from the analysis, as they may represent a subgroup with a reversible disease pathology distinct from the rest of the cohort. Overall, the longitudinal analysis included those whose spirometry at the follow-up visit stayed the same or worsened. Full study methods are available in the online supplement.
Statistical Analysis
For cross-sectional analyses, the distributions of the baseline lung volumes were examined across airflow obstruction as measured by the post-bronchodilator FEV1 as a continuous variable. To understand the nature of the relationship between lung volumes and spirometry variables, we performed an initial exploratory evaluation using locally weighted scatterplot smoothing (LOWESS) analysis of the relative distribution of the lung volume variables versus FEV1 and found that many lung volume variables had a nonlinear association with FEV1. To generate better fits, we chose to examine the association of lung volumes versus partitions of FEV1 based on the arbitrary but clinically well-known Global initiative for obstructive Lung Disease (GOLD) categorization.7 To account for the random effect of study sites, the comparisons among each of the 5 baseline lung volume measurements (TLC, VC, RV, FRC, and IC) with respect to the baseline GOLD stages were assessed using mixed-effects linear regression, with a random effect of study sites and fixed effect covariates, including age, sex, height, and body mass index (BMI). BMI instead of weight was used as a covariate based on previous studies demonstrating BMI to have significant effects on lung volume measurements even in people with normal lung function.8,9 Smoking status (current versus former) was also included as a covariate only in analyses of the COPDGene and SPIROMICS data, as it was not available in the VA EHR data, although all patients in the VA EHR cohort had a history of smoking.
Longitudinal changes in lung volume measurements and additional covariates (including changes in age, height, and BMI) were calculated by subtracting the follow-up values from those from baseline visit. Changes in lung volumes were stratified by the baseline GOLD stages of the patients/participants and then compared across the subsequent GOLD stages at follow-up visits. To account for the random effect of study sites, this analysis was performed using mixed-effects linear regression, with a random effect of sites within each of the 3 cohorts, and fixed effects of baseline age, sex, height, BMI, and smoking status as well as changes in age, height, BMI, and smoking status. The same modeling was examined for each of the baseline GOLD stages. To assess the pattern of change in lung volumes from initially mild disease onward, average changes in lung volumes for those smokers with preserved spirometry (denoted for simplicity of comparison terminology as GOLD 0) at baseline with respect to subsequent GOLD stages were examined using 1-sample t-tests with the null hypothesis of changes in lung volumes being zero. Comparisons of baseline lung volumes and their longitudinal changes for those patients/participants with GOLD 0 at baseline with respect to subsequent GOLD stages were examined using 2-sample t-tests. P-values and 95% confidence intervals (CI) for relative differences from mixed-effects linear regression modeling were estimated by Satterthwaite’s degrees of freedom method via R package, “lmerTest.” Statistical significance was defined as a P-value <0.05.
Results
Cross-Sectional Analyses of the Study Cohorts at Baseline
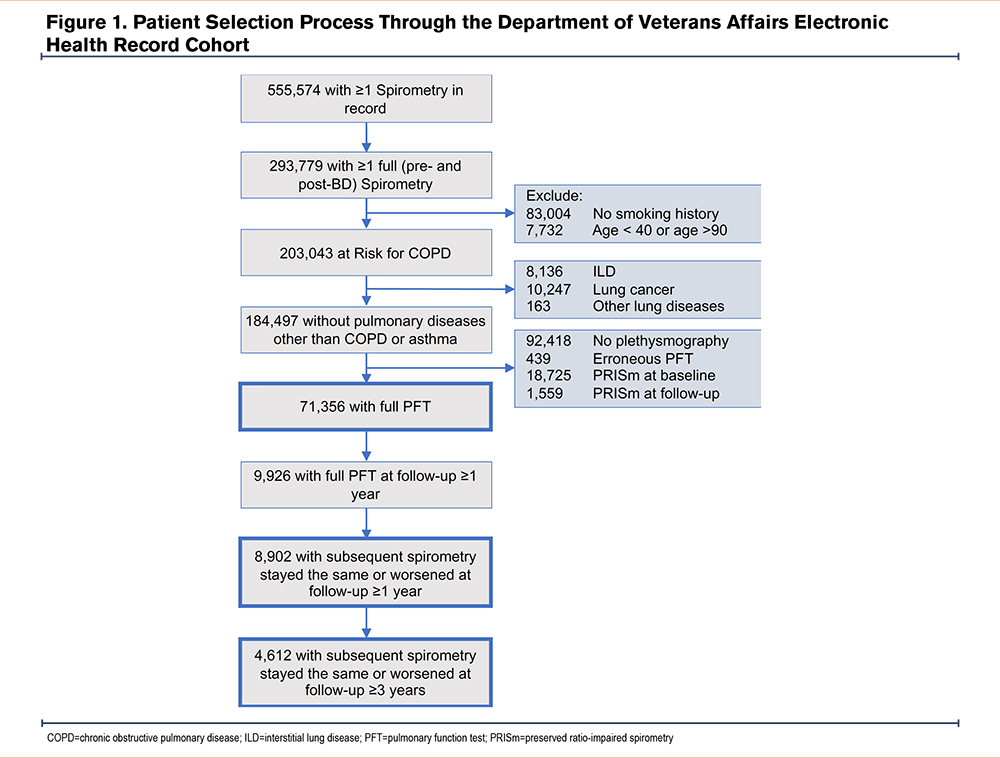
Veterans Affairs Electronic Health Record Cohort: Characteristics of the patients included in the VA EHR cohort are shown in Table 1.10,11 Between 1985 and 2020, structured EHR data for spirometry tests were available from 555,574 patients enrolled in the Veterans Affairs Health Care System (VAHCS) who had at least one documented diagnosis of smoking or obstructive lung disease (Figure 1). Among them, 293,779 had full pre- and post-bronchodilator spirometry. We then identified 203,043 patients aged ≥40 years with COPD or at risk for COPD who had records of tobacco use at any time before their index spirometry. A further 18,546 patients with diagnoses of interstitial or fibrotic lung diseases, or with allergic lung diseases (except for asthma) were excluded from our analysis. Among the remaining 184,497 patients, full PFT data (including pre- and post-bronchodilator spirometry and lung volume measurements by plethysmography) were available for 71,356 patients (baseline cross-sectional cohort). The cohort mostly consisted of men (68,722 or 96%) with an average age of 63±10 years.
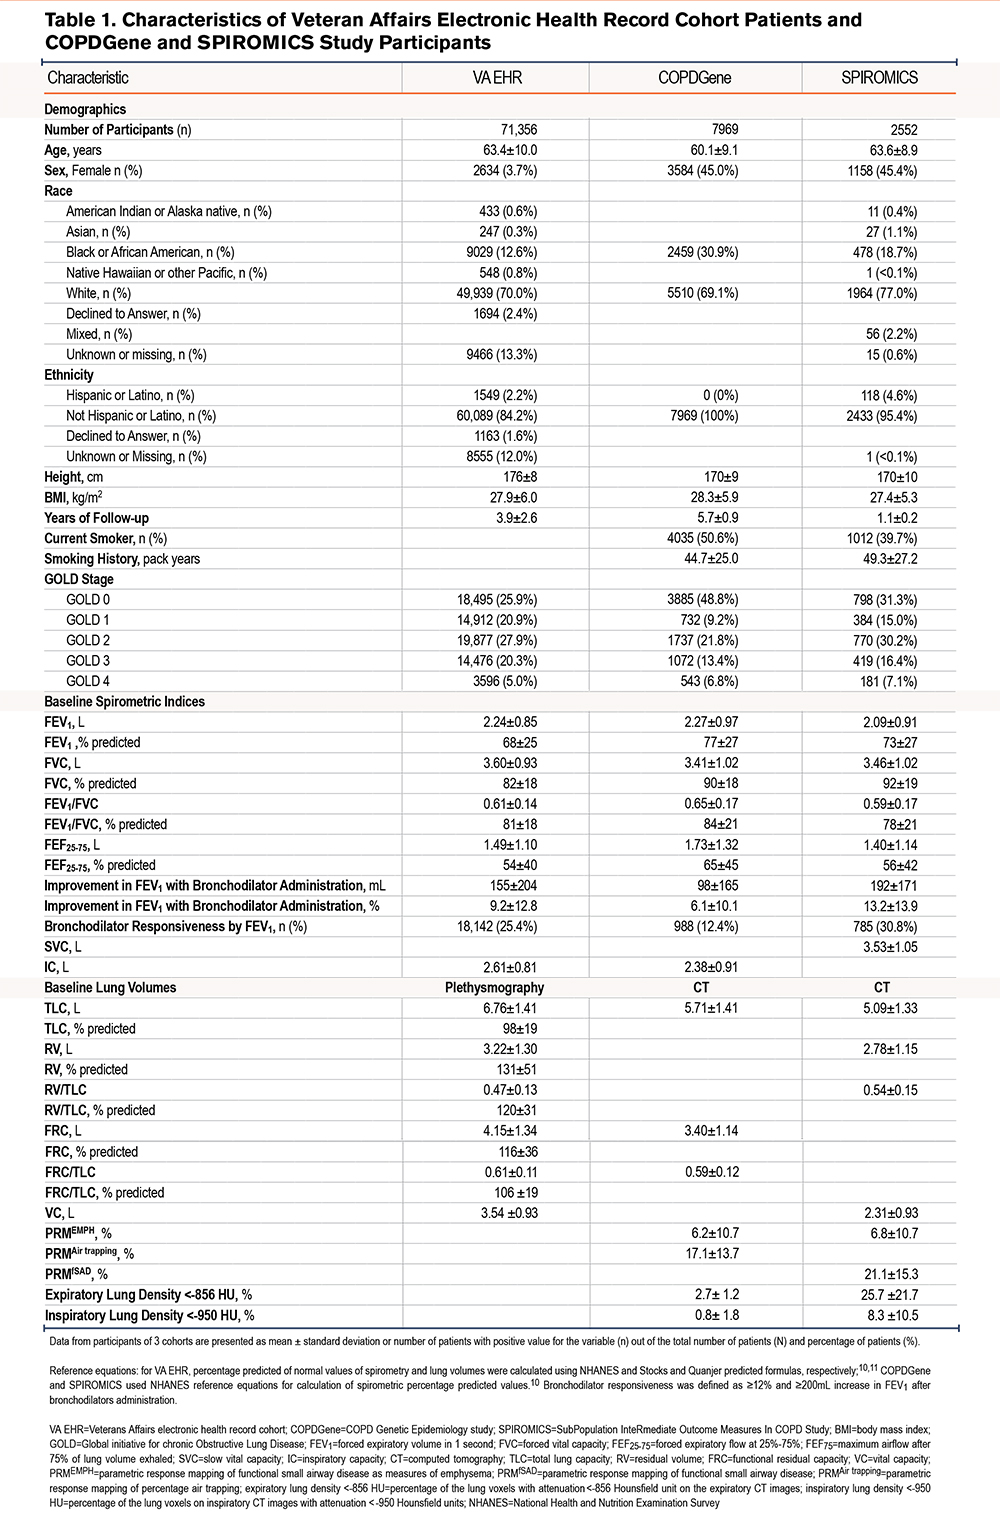
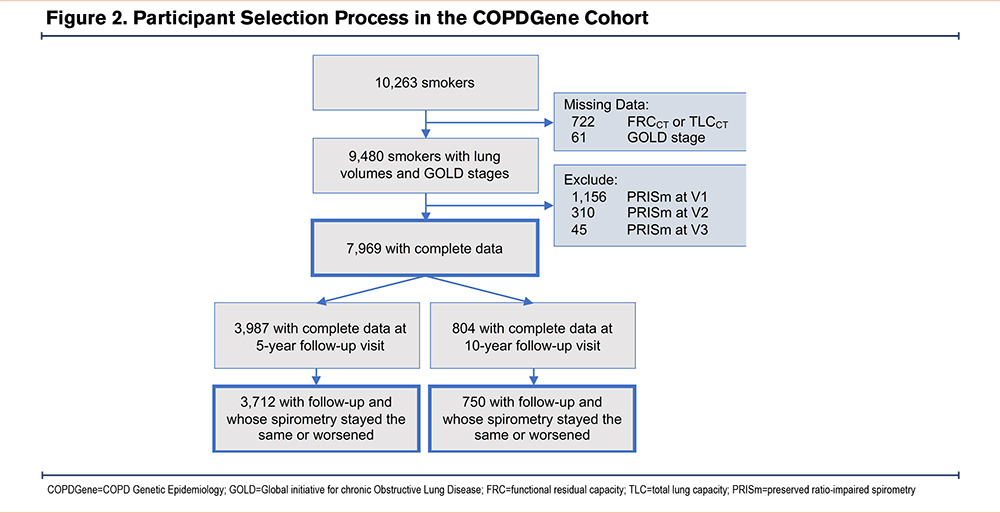
COPDGene Cohort:Characteristics of the participants in the COPDGene cohort are shown in Table 1. CT-measured TLC and FRC were available for 7969 participants, consisting of 4385 (55.0%) men and 3584 (45.0%) women with an average age of 60.1±9.1 years (Figure 2).
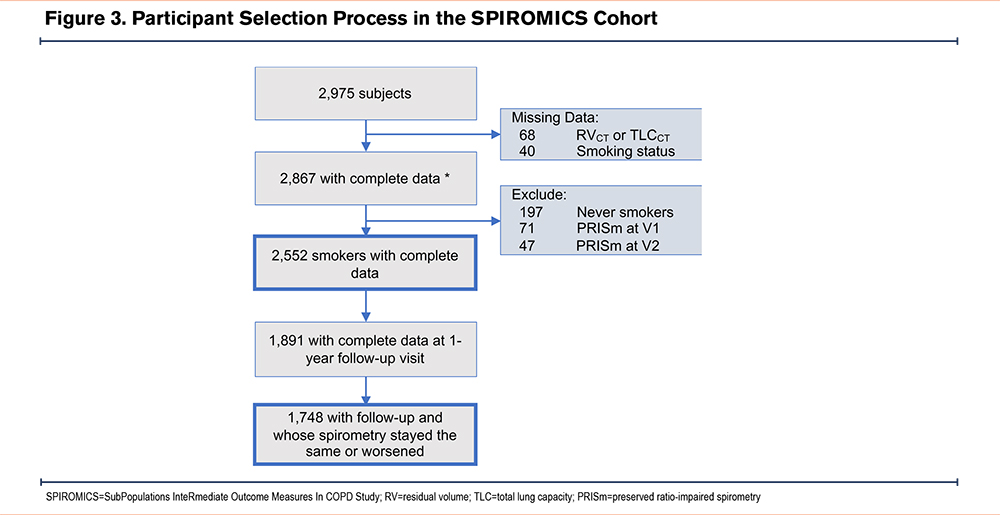
SPIROMICS Cohort: Characteristics of the participants in the SPIROMICS cohort are shown in Table 1. CT-measured lung volumes including both TLC and RV were available for 2552 participants (Figure 3).
Cross-Sectional Distributions of Lung Volumes Across GOLD Stages of COPD at Baseline Visits
LOWESS analysis of the relative distribution of TLC, VC, and IC versus FEV1 showed the presence of nonlinear relationships (Figure S1 in the online supplement). Further analyses were conducted using categories of FEV1 based on GOLD categorization.
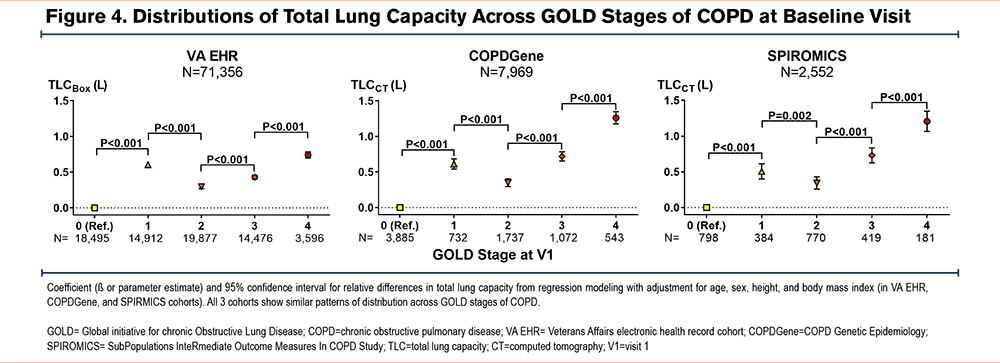
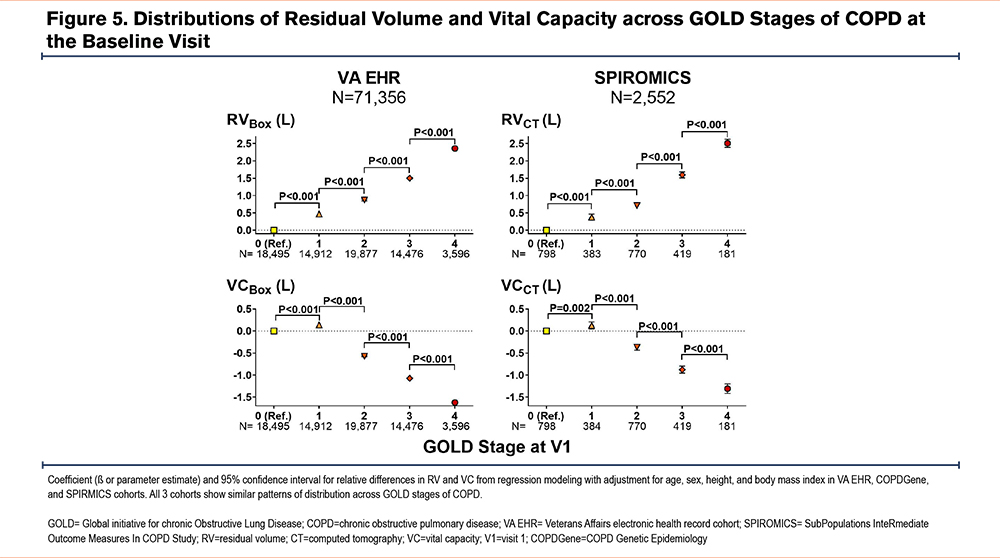
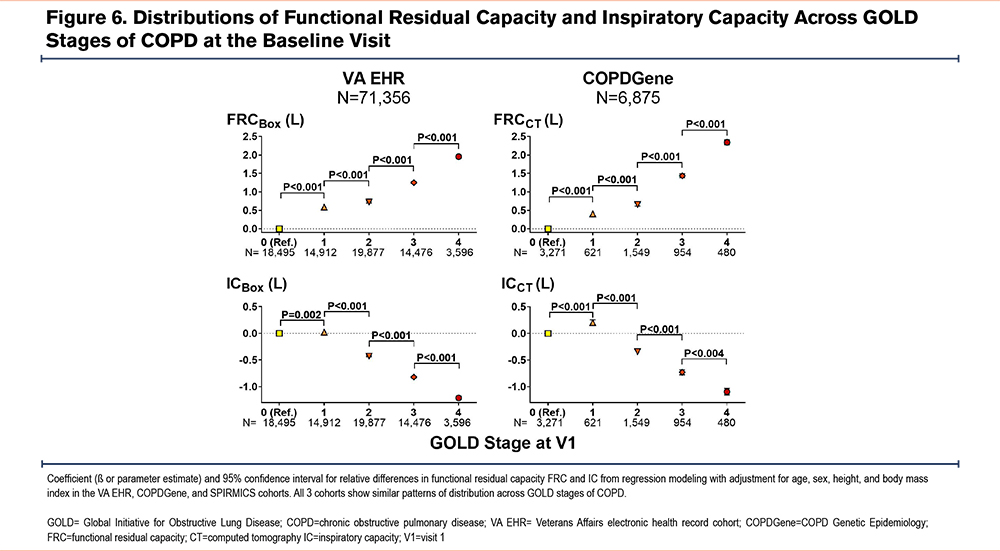
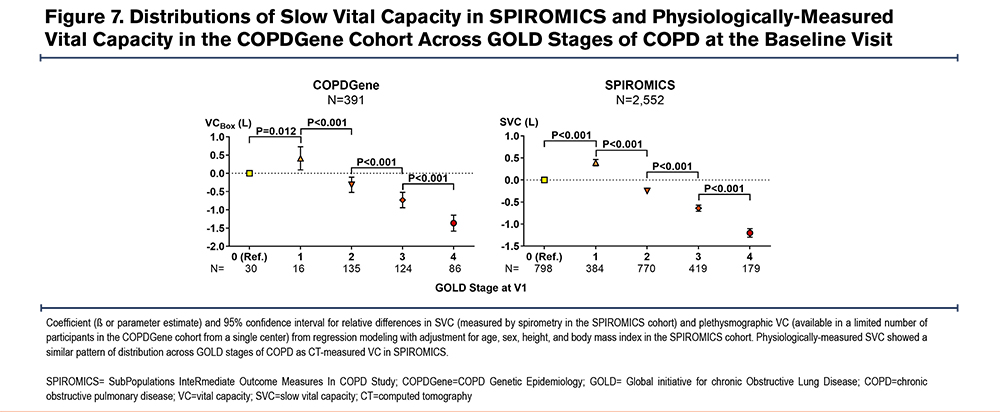
Cross-sectional analyses of all 3 cohorts showed a remarkably similar pattern of lung volume distributions across GOLD stages of COPD. In all 3 cohorts, patients/participants with GOLD 1 COPD had larger TLC values than those with GOLD 0, while those with GOLD 2 COPD had smaller TLC values than those with GOLD 1 (Figure 4). Those with GOLD 3 and GOLD 4 COPD had the expected trend of progressively larger TLC compared to those with GOLD 2. On the other hand, both RV and FRC showed progressively larger values in higher GOLD stages of COPD (Figure 5 and Figure 6). However, VC and IC were actually larger in patients/participants with GOLD 1 COPD compared to those in GOLD 0, but progressively smaller in those with more advanced disease (GOLD 3 and GOLD 4) (Figure 5 and Figure 6). Notably, slow vital capacity (SVC) obtained by spirometry in SPIROMICS at the baseline visit also showed a similar pattern of distribution, with larger SVC values in those with GOLD 1 than in those with GOLD 0, and progressively smaller SVC values in those with more advanced disease (GOLD 2 through GOLD 4) (Figure 7). Furthermore, baseline plethysmographic lung volumes were available for a limited number of participants in COPDGene (n=391); these volumes corroborated the pattern of VC and SVC distributions as seen in the other cohorts. (Figure 7).
Description of Longitudinal Cohorts
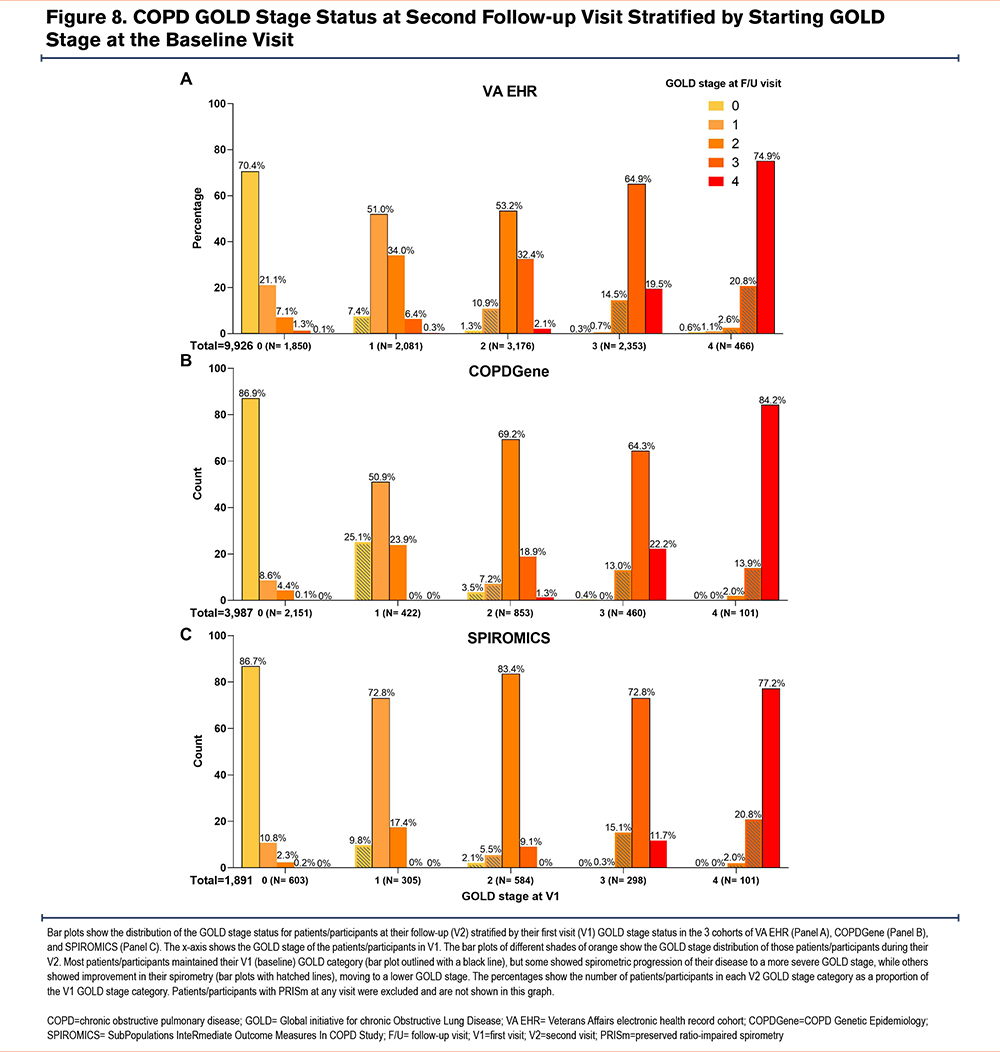
Longitudinal Veterans Affairs Electronic Health Record Cohort: From the 71,356 patients in the VA EHR cohort, longitudinal PFT data ≥1 year after the index PFT were available for 9926 patients (Figure 1). On the follow-up PFT, the majority of these 9926 patients remained in the same spirometric GOLD stage as that at their baseline visit, while a smaller proportion progressed to more severe COPD, and another smaller proportion showed an improvement (Figure 8). The 1024 (10.3%) patients who showed improvements in their GOLD stage were excluded from this analysis. The final longitudinal cohort included 8902 (89.7%) patients whose GOLD stage remained the same or worsened on follow-up spirometric examination conducted ≥1 year after their index PFT (Table S1 in the online supplement). The median (25th percentile–75th percentile) number of years between the index and follow-up PFT for this group was 3.1 (2.0–5.0) years.
When the follow-up time of ≥3 years from the index PFT was used, longitudinal full PFT data were available for 5084 patients, of whom 472 showed improvement in their COPD GOLD stage and were, thus, excluded from this analysis. The final longitudinal cohort included 4612 (90.7%) patients whose GOLD stage remained the same or worsened. The median (25th percentile–75th percentile) number of years between the index and follow-up PFT for this group was 4.9 (3.8–6.7) years.
Longitudinal COPDGene Cohort: Longitudinal data with follow-up pre- and post-bronchodilator spirometry and CT imaging were available from 5-year and 10-year follow-up visits (visits 2 and 3) for 3987 and 804 participants, respectively (Figure 2). Overall, 3712 (93.1%) and 750 (93.3%) participants whose subsequent GOLD category remained the same or worsened on follow-up spirometry at visits 2 and 3, respectively, were included in the longitudinal analysis (Table S2 in the online supplement). Visits 2 and 3 took place at a median (25th percentile–75th percentile) of 5.3 (5.0–5.8) and 9.9 (9.7–10.2) years after the baseline visit, respectively.
Longitudinal SPIROMICS Cohort: Longitudinal data with follow-up pre- and post-bronchodilator spirometry and CT data from the 1-year follow-up visit (visit 2) were available for 1891 participants (Figure 3). Overall, 1748 (92.4%) participants whose subsequent GOLD category remained the same or worsened on follow-up spirometry at visit 2 were included in the longitudinal analysis (Table S3 in the online supplement). The follow-up visit 2 took place at a median (25th percentile–75th percentile) of 1.0 (1.0–1.1) year after the baseline visit.
Longitudinal Changes in Lung Volumes with Progression of Obstruction Across GOLD Stages
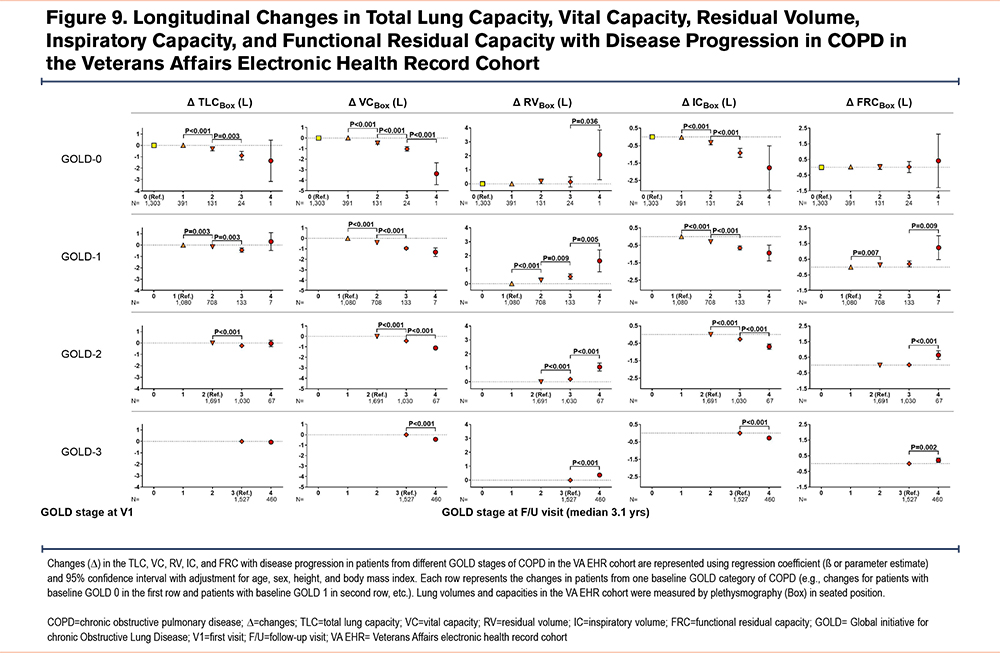
In longitudinal analyses, we examined changes in lung volumes as the spirometric disease progressed to more severe GOLD stages of COPD. The proportions of patients/participants who experienced disease progression were similar among all 3 cohorts (Figure 8). Overall, longitudinal changes in lung volumes at follow-up visits in the 3 cohorts corroborated the nonlinear pattern of distribution observed in the cross-sectional analysis of those lung volumes at baseline visits (Figure 9 for VA EHR; Figure S2 for COPDGene in the online supplement; and Figure S3 for SPIROMICS in the online supplement). The VA EHR and COPDGene cohorts’ data from longer follow-up times showed similar trends as their respective shorter follow-up data (Figure S4 and Figure S5 in the online supplement). Given that a small number of patients/participants progressed to advanced (GOLD stages 3 and 4) COPD, we focused our analysis on patients with GOLD 0 classification at baseline who progressed to GOLD 1 or GOLD 2 disease, as described below.
High Baseline Total Lung Capacity, Vital Capacity, and Inspiratory Capacity Were Associated with Spirometric Progression to GOLD 1 Rather Than to GOLD 2 Disease
To better understand the nature of the nonlinear pattern of change in lung volumes with progression of spirometric disease in early COPD, we examined whether stratification by lung volumes could identify subgroups of GOLD 0 patients at baseline who have diverging disease progression. We found that among baseline GOLD 0 patients who progressed to spirometric COPD, those with higher lung volumes went on to develop mild obstruction (GOLD 1) while those with lower TLC and VC went on to develop moderate obstruction (GOLD 2).
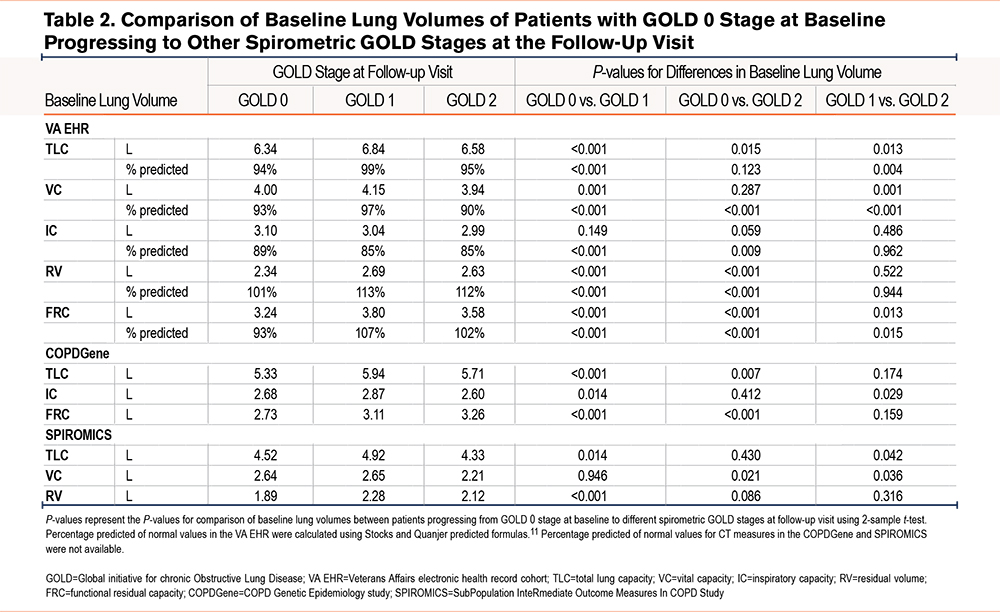
In the VA EHR longitudinal analysis using ≥1-year follow-up data (median follow-up time of 3.1 years), those who progressed to GOLD 1 had higher TLC and VC (absolute and percentage predicted) values at baseline than those who remained at GOLD 0 or those who progressed to GOLD 2 (Table 2). In the COPDGene cohort analysis using 5-year follow-up data, those progressing to GOLD 1 had higher TLC and IC absolute values (CT-measured with no predicted values available) than those who remained at GOLD 0 or those who progressed to GOLD 2 (TLC comparison for GOLD 0 versus GOLD 2 was not statistically significant) (Table 2). In the SPIROMICS cohort analysis, those who progressed to GOLD 1 had higher TLC and VC absolute values (CT-measured with no predicted values available) than those who remained at GOLD 0 or those who progressed to GOLD 2 (VC comparison for GOLD 0 versus GOLD 1 was not statistically significant) (Table 2).
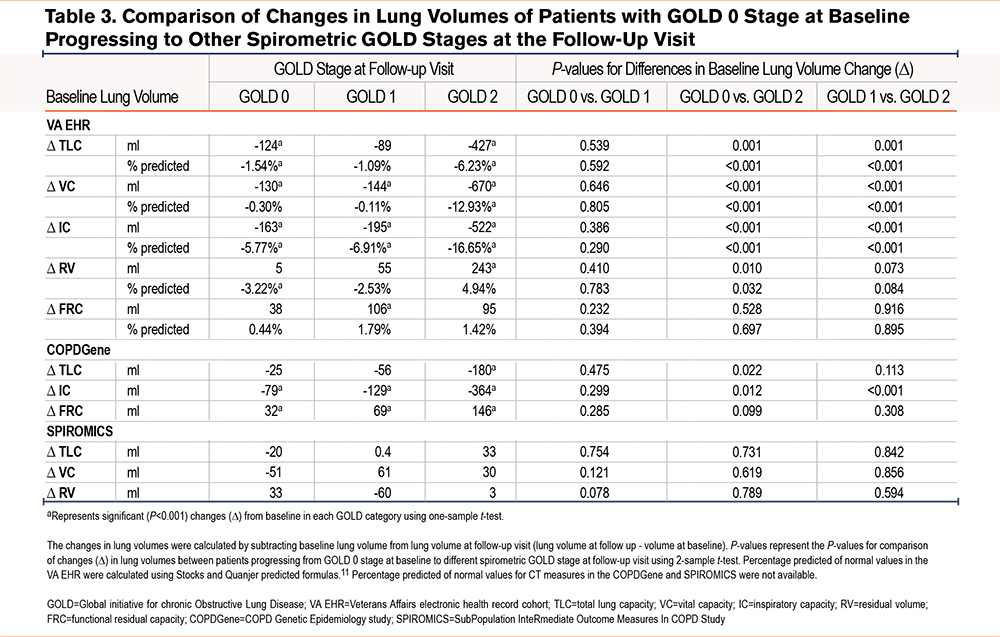
Interestingly, in the VA EHR cohort, even in those who stayed in GOLD 0, there was a significant decline in TLC over time (the decline in VC was not significant in adjusted values) (Table 3). In those whose spirometric disease progressed to mild obstruction (GOLD 0 to GOLD 1), the decline was smaller although not statistically different. On the other hand, in those whose spirometric disease progressed to moderate obstruction (GOLD 0 to GOLD 2), there was a significantly larger decline in TLC, VC, and IC compared to both those who stayed in GOLD 0 and those who progressed to GOLD 1. In the COPDGene cohort, spirometric disease progression to moderate obstruction (GOLD 0 to GOLD 2) was also associated with a significant differential decline in TLC and IC (Table 3).
Discussion
In this analysis of cross-sectional and longitudinal data from 3 large cohorts of patients with a history of smoking or COPD, we found a nonlinear pattern of change in lung volumes across the spectrum of spirometric disease progression. This phenomenon has not been described previously and appears paradoxical to the conventional understanding of COPD pathophysiology. The distributions of lung volumes, regardless of whether they were measured by plethysmography or CT, were nearly identical in the 3 large cohorts of real-world patients and research participants. In particular, we found a biphasic pattern of distribution of TLC values across GOLD 0 to GOLD 4 stages of COPD: TLC showed a peak in GOLD 1, a trough in GOLD 2, and a subsequent peak in GOLD 4. In contrast, both RV and FRC had progressively larger values across all GOLD stages of COPD. These patterns resulted in the IC and VC values being the highest in patients with GOLD 1 disease compared to those with GOLD 0 or more advanced spirometric disease (GOLD 2 to GOLD 4). Longitudinal analysis of the lung volumes data corroborated these nonlinear patterns of distributions observed in the cross-sectional analysis.
To better understand the unanticipated finding of biphasic distributions of lung volumes with spirometric disease progression, we examined the changes in lung volumes in the population of GOLD 0 patients who progressed from GOLD 0 stage to GOLD 1 (mild) disease versus those who progressed from GOLD 0 stage to GOLD 2 (moderate) disease. We found that progression from GOLD 0 to GOLD 1 was associated with larger baseline lung volumes than progression from GOLD 0 to GOLD 2, i.e., high baseline TLC, IC, and VC values were predictive of future progression to GOLD 1, while lower baseline values were predictive of progression to more advanced spirometric disease (GOLD 2). Remarkably, those patients progressing to GOLD 2 not only had smaller lung volumes at baseline than those who progressed to GOLD 1 but also had their lung volumes relatively diminished. Overall, these findings imply the presence of an inhomogeneous population among the smokers with preserved spirometry (GOLD 0 stage) with diverging predispositions for spirometric disease development. Furthermore, these findings imply that stratification by lung volumes (TLC, VC, and IC) at GOLD 0 stage could help identify those susceptible to more rapid progression of their spirometric disease.
Our study does not provide any mechanistic explanation for the observed pattern of lung volume changes. It is also possible that different disease mechanisms might underlie the progression from GOLD 0 to GOLD 1 versus to GOLD 2 disease. Several pathological factors have been described to contribute to changes in lung volumes in COPD.2,12-16 However, it is unclear whether these pathological factors begin to affect the lungs concurrently or sequentially, and whether they affect all at-risk populations in a similar manner. The biphasic pattern that we observed in this analysis suggests that different pathologies may develop or become important at different stages of the disease in different at-risk individuals. For example, the higher baseline TLC and VC in those progressing from GOLD 0 to GOLD 1 may be due to a disproportionately higher rate of loss of lung elastance in the setting of a relatively lower burden of small airway disease, resulting in lung expansion with lesser air trapping (an emphysematous phenotype). Conversely, the lower baseline and subsequent decline in TLC, VC, and IC values among those progressing to GOLD 2 may be due to a higher burden of small airway disease in the presence of a slower loss of lung elastance, resulting in more air trapping with relatively lesser thoracic expansion in the early stages of disease progression (a small airway phenotype). Disruption of connective tissue is also recognized as a potential mechanism.17,18 However, lung connective tissue is organized into an extremely complex 3-dimensional network,19,20 and it is reasonable to speculate that disruption of different portions of the network by similar mechanisms could have very disparate effects.21 Further research with quantification of various pathologic mechanisms can lead to a better understanding of the nature and sequence of the pathologies that contribute to the observed nonlinear lung volume changes with spirometric disease progression in COPD. By understanding these mechanisms, we may be able to better apply prognostic biomarkers and design targeted therapy for the different stages of COPD.
Our study has several limitations. First, the PFT data of the VA EHR cohort, which were obtained at different centers across the country over several decades using various PFT machines, were unlikely to have been fully harmonized; therefore, it may have been problematic to group them together. However, there is no clear reason to believe that any systematic or technical errors in the PFT measurements could have produced the consistent pattern of change in lung volume across GOLD stages we observed. Second, the smoking status of the patients in the VA EHR cohort was only characterized as “ever smoker” and their cumulative smoking burden was not certain, although it is known that most veterans begin smoking early in life and have a heavier smoking burden than the general public.22,23 While these considerations may have a bearing on the generalizability of the findings from the VA EHR data, there is no clear reason for this bias to produce the pattern that we observed. Finally, the lung volumes measured in the 3 cohorts examined herein were obtained using different methods of plethysmography (in the seated position) and CT scanning (in the supine position); moreover, the CT scanning algorithms in COPDGene and SPIROMICS were not harmonized. In addition, neither the COPDGene nor the SPIROMICS CT scan protocols included spirometry gating; therefore, CT-measured lung volume may have underestimated the TLC and/or overestimated the RV compared to the plethysmographic measurements in the VA EHR cohort. Despite these limitations, the remarkably similar patterns of lung volume distribution across the GOLD stages of COPD in 3 independent cohorts of real-world patients and research participants provide robust confirmation that the observed patterns were not simply the result of technical variability.
In conclusion, our cross-sectional and longitudinal analyses of data from 3 large cohorts showed a remarkably similar pattern of change in lung volumes as spirometric disease progressed in COPD, regardless of whether the lung volumes were measured by plethysmography or CT. The TLC, VC, and IC values showed nonlinear patterns of change as the disease progressed. While the underlying pathology of these nonlinear patterns of change remain to be investigated, the observed patterns highlight the heterogeneity of disease development in COPD and suggest the contribution of distinct pathophysiologic mechanisms at different stages of the disease in different individuals. Moreover, baseline lung volumes seem to predict the risk of more rapid spirometric disease progression in COPD, making a case for more routine incorporation of lung volume measurement in assessment of tobacco-exposed persons at risk for COPD in early disease. Further research on these mechanisms could help in understanding the heterogeneity of disease in COPD and with identification of appropriate biomarkers and design of therapies targeting its specific phenotypes.
Acknowledgements
Author Contributions: Conceived and designed the current manuscript study: MA, SZ. Developed study protocols: MA, SZ, JC, SPB, CBC, IB, RGBarr, ERB, RGBuhr, GJC, APC, DJC, JLC, MTD, SF, MKH, NNH, EAH, JEH, RJK, REK, JAK, WL, DAL, VEO, SPP, PGW, RPB, RP, SIR, DPT. Collected data: MA, SZ, JC, SPB, RP, CBC, IB, RGBarr, ERB, RGBuhr, GJC, APC, DJC, JLC, MTD, SF, MKH, NNH, EAH, JEH, RJK, REK, JAK, WL, DAL, VEO, SPP, PGW, RPB, RP, SIR, DPT. Analyzed and interpreted data: MA, SZ, JC, SPB, CBC, IB, RGBarr, ERB, RGBuhr, GJC, APC, DJC, JLC, MTD, SF, MKH, NNH, EAH, JEH, RJK, REK, JAK, WL, DAL, VEO, SPP, PGW, RPB, RP, SIR, DPT. Prepared and/or edited the manuscript: MA, SZ, JC, SPB, FA, CBC, IB, RGBarr, ERB, RGBuhr, GJC, APC, DJC, JLC, MTD, SF, MKH, NNH, EAH, JEH, RJK, REK, JAK, WL, DAL, VEO, SPP, PGW, RPB, RP, SIR, DPT. Obtained funding: MA, SZ, SPB, CBC, IB, RGBarr, ERB, RGBuhr, GJC, APC, DJC, JLC, MTD, SF, MKH, NNH, EAH, JEH, RJK, REK, JAK, WL, DAL, VEO, SPP, PGW, RPB, RP, SIR, DPT.
SPIROMICS Acknowledgement Statement: The authors thank the SPIROMICS participants and participating physicians, investigators, and staff for making this research possible. More information about the study and how to access SPIROMICS data is at www.spiromics.org. We would like to acknowledge the following current and former investigators of the SPIROMICS sites and reading centers: Neil E. Alexis, MD; Wayne H. Anderson, PhD; Mehrdad Arjomandi, MD; Igor Barjaktarevic, MD, PhD; R. Graham Barr, MD, DrPH; Lori A. Bateman, MSc; Surya P. Bhatt, MD; Eugene R. Bleecker, MD; Richard C. Boucher, MD; Russell P. Bowler, MD, PhD; Stephanie A. Christenson, MD; Alejandro P. Comellas, MD; Christopher B. Cooper, MD, PhD; David J. Couper, PhD; Gerard J. Criner, MD; Ronald G. Crystal, MD; Jeffrey L. Curtis, MD; Claire M. Doerschuk, MD; Mark T. Dransfield, MD; Brad Drummond, MD; Christine M. Freeman, PhD; Craig Galban, PhD; MeiLan K. Han, MD, MS; Nadia N. Hansel, MD, MPH; Annette T. Hastie, PhD; Eric A. Hoffman, PhD; Yvonne Huang, MD; Robert J. Kaner, MD; Richard E. Kanner, MD; Eric C. Kleerup, MD; Jerry A. Krishnan, MD, PhD; Lisa M. LaVange, PhD; Stephen C. Lazarus, MD; Fernando J. Martinez, MD, MS; Deborah A. Meyers, PhD; Wendy C. Moore, MD; John D. Newell Jr, MD; Robert Paine, III, MD; Laura Paulin, MD, MHS; Stephen P. Peters, MD, PhD; Cheryl Pirozzi, MD; Nirupama Putcha, MD, MHS; Elizabeth C. Oelsner, MD, MPH; Wanda K. O’Neal, PhD; Victor E. Ortega, MD, PhD; Sanjeev Raman, MBBS, MD; Stephen I. Rennard, MD; Donald P. Tashkin, MD; J. Michael Wells, MD; Robert A. Wise, MD; and Prescott G. Woodruff, MD, MPH. The project officers from the Lung Division of the National Heart, Lung, and Blood Institute were Lisa Postow, PhD, and Lisa Viviano, BSN.
Data Sharing Statements: The VA EHR dataset generated and analyzed during the current study was created through the VA Informatics and Computing Infrastructure (VINCI) resource and is available on VINCI digital platform to the VA, VA-affiliated, and VA-approved investigators. Availability of the VA data is subject to the U.S. Department of Veterans Affairs regulations. Clinical and research data along with the definition of variables are available on NIH dbGaP for COPDGene (phs000179.v6.p2) and SPIROMICS (phs001119.v1.p1).
Declaration of Interest
All authors report research grants support from the National Institutes of Health (NIH)/National Heart, Lung and Blood Institute (NHLBI), the COPD Foundation, and the Foundation of the NIH related to this manuscript. In addition, the following authors have disclosed the undermentioned disclosures. MA reports grants from the Departments of Defense (W81XWH-20-1-0158) and Veterans Affairs (CXV-00125), the Flight Attendant Medical Research Institute (012500WG and CIA190001), and the California Tobacco-related Disease Research Program (T29IR0715) during the conduct of the study. He has received research support from Guardant Health and Genentech. SZ reports a grant from the National Library of Medicine. SPB reports receiving royalties from Elsevier, consulting fees from Boehringer Ingelheim and Sabofi/Regeneron, and honoraria from IntegrityCE. IB has received grants from Theravance/Viatris and Amgen, and consulting fees from AstraZeneca, GSK, Theravance/Viatris, Aerogen, Verona Pharma, Inhibrx, and Grifols. ERB has undertaken clinical trials for AstraZeneca, MedImmune, Boehringer Ingelheim, Genentech, Johnson & Johnson (Janssen), Novartis, Regeneron, and Sanofi Genzyme and has also served as a paid consultant for AstraZeneca, MedImmune, Boehringer Ingelheim, GSK, Novartis, Regeneron, and Sanofi Genzyme. RGBuhr reports consulting for Viatris/Theravance Biopharma, DynaMed, and American College of Physicians, and is an employee of the Department of Veterans Affairs. GJC reports grants and personal fees from GSK, grants and personal fees from Boehringer Ingelheim, grants and personal fees from Chiesi, grants and personal fees from Mereo, personal fees from Verona, grants and personal fees from AstraZeneca, grants and personal fees from Pulmonx, grants and personal fees from Pneumrx, personal fees from BTG, grants and personal fees from Olympus, grants and personal fees from Broncus, personal fees from EOLO, personal fees from NGM, grants and personal fees from Lungpacer, grants from Alung, grants and personal fees from Nuvaira, grants and personal fees from ResMed, grants and personal fees from Respironics, grants from Fisher Paykel, grants and personal fees from Patara, grants from Galapgos, outside the submitted work. JLC reports a grant from NIH/NHLBI during the conduct of the study; grants from NIH/NHLBI, NIH/NIAID, the Department of Veterans Affairs, and the Department of Defense, outside the submitted work; and personal fees from AstraZeneca, Ltd. and Novartis AG, outside the submitted work. MKH reports personal fees from GSK, AstraZeneca, Boehringer Ingelheim, Cipla, Chiesi, Novartis, Pulmonx, Teva, Verona, Merck, Mylan, Sanofi, Roche, DevPro, Aerogen, Polarian, Regeneron, Amgen, UpToDate, Altesa Biopharma, Medscape, NACE, MDBriefcase, Integrity and Medwiz. She has received either in-kind research support or funds paid to the institution from the NIH, Novartis, Sunovion, Nuvaira, Sanofi, AstraZeneca, Boehringer Ingelheim, Gala Therapeutics, Biodesix, the COPD Foundation, and the American Lung Association. She has participated in Data Safety Monitoring Boards for Novartis and Medtronic with funds paid to the institution. She has received stock options from Meissa Vaccines and Altesa Biopharma. NNH reports grants and personal fees from AstraZeneca, GlaxoSmithKline, and Boehringer Ingelheim, and personal fees from Mylan, outside the submitted work. EAH is a founder and shareholder of VIDA Diagnostics, outside the submitted work. APC reports received consulting fees from GSK, Astra Zeneca, and Eli Lilly, and non-paid consulting for VIDA Diagnostics. JLC reports a grant from NIH/NHLBI during the conduct of the study; grants from NIH/NHLBI, NIH/NIAID, the Department of Veterans Affairs, and the Department of Defense, outside the submitted work; and personal fees from AstraZeneca, Ltd. and Novartis AG, outside the submitted work. MTD has received consulting fees from Boehringer Ingelheim, GlaxoSmithKline, AstraZeneca, Quark Pharmaceuticals, and Mereo. RJK has received grants from Boehringer Ingelheim and honoraria from UpToDate, the France Foundation, Boehringer Ingelheim, and Genentech, and has stock in Air Cycle Systems. SPP reports personal fees from AstraZeneca, personal fees from Novartis, personal fees from TEVA, personal fees from Wolters Kluwer-UpToDate, personal fees from Palladian Partners, NIAID, personal fees from Syneos Health, personal fees from Genentech, personal fees from GSK, personal fees from Integrity CE, personal fees from Respiratory Medicine-Elsevier, outside the submitted work. PGW reports personal fees from Sanofi, Regeneron, Glenmark Pharmaceuticals, Theravance, GSK, and NGM Pharma, outside the submitted work. CBC reports personal fees from PulmonX, Nuvaira, and MGC Diagnostics, and is a Global Medical Expert for GSK, outside the submitted work. RP reports grants from the Department of Veterans Affairs, and personal fees from Partner Therapeutics, outside the submitted work. DPT reports personal consulting fees from Viatris/Theravance Biopharma, not related to this work. All other authors declare no competing interests.