Running Head: Deep Learning on CT and Gene Expression in COPD
Funding Support: This work was supported by the National Heart, Lung, and Blood Institute (NHLBI) R01 HL14813, K08 HL141601, R01 HL124233, R01 HL126596, R01 HL147326, U01 HL089897, and U01 HL089856. The COPD Gene study (NCT00608764) is also supported by the COPD Foundation through contributions made to an Industry Advisory Committee comprised of AstraZeneca, Bayer Pharmaceuticals, Boehringer-Ingelheim, Genentech, GlaxoSmithKline, Novartis, Pfizer, and Sunovion.
Date of Acceptance: June 30, 2023 | Published Online Date: July 6, 2023
Abbreviations: AP=airway predominant; BMI=body mass index; COPD=chronic obstructive pulmonary disease; CT=computed tomography; CSRL=context-aware self-supervised representation; DICOM=Digital Imaging and Communications in Medicine standard; FA=factor analysis axe; FAairway=airway disease FA; FAemph=emphysema FA; FDR=false discovery rate; FEV1=forced expiratory volume in 1 second; FVC=forced vital capacity; %gas trapping= %low attenuation area using −856 Hounsfield unit threshold on expiratory CT scan; GO=gene ontology; GOLD=Global initiative for chronic Obstructive Lung Disease; HU=Hounsfield unit; IEA=image-expression axe; IEAemph=emphysema IEA; IEAairway=airway disease IEA; MLP=multilayer perceptron; mMRC=modified Medical Research Council; PCA=principal component analysis; PCA-Is=PCA-image only axes; perc15=15th percentile Hounsfield unit in inspiratory CT scan; Pi10=the average wall thickness for a hypothetical airway of 10-mm lumen perimeter on CT; %pred=percentage predicted; PRISm=preserved ratio-impaired spirometry; RNAseq=RNA sequencing; RRS=relatively resistant smoker; SE= severe emphysema; SNR=single nucleotide polymorphism; SGRQ=St George’s Respiratory Questionnaire; %WA segmental=the percentage of airway wall area for 3rd generation bronchi
Citation: Chen J, Xu Z, Sun L, et al. Deep learning integration of chest computed tomography and gene expression identifies novel aspects of COPD. Chronic Obstr Pulm Dis. 2023; 10(4): 355-368. doi: http://doi.org/10.15326/jcopdf.2023.0399
Online Supplemental Material: Read Online Supplemental Material (1643KB)
Introduction
Chronic obstructive pulmonary disease (COPD) is one of the most prevalent chronic diseases,1 responsible for approximately 3 million deaths annually.2 COPD is characterized by persistent respiratory symptoms and poorly reversible airflow limitation.3 It is associated with an abnormal inflammatory response of the lungs to cigarette smoke or other noxious particles,4 which results in lung structural changes, including the loss or narrowing of airways (airway disease) and parenchymal destruction (emphysema).5 In addition to its characteristic lung structural changes, the changes in blood transcriptome patterns have been linked to COPD exacerbations6,7 and lung function decline.8
Although lung structural changes and the changes in blood transcriptome patterns are characteristic aspects of COPD, their relationship remains unclear. Therefore, we are motivated to apply a deep learning method to analyze computed tomography (CT) imaging and blood RNA-sequencing (RNA-seq) data to identify novel relationships between them.
Based on the paradigm of COPD as a collection of treatable traits,9 we hypothesize that COPD heterogeneity can be described by continuous measures corresponding to distinct disease processes that are present to varying degrees in affected individuals. We refer to these continuous measures as “disease axes,”10 and we further hypothesize that integrative analysis of CT images and blood RNA-seq data can identify disease axes that reveal patterns of association between lung structural abnormalities and blood transcriptomic profile change. We tested these hypotheses by training a deep learning model on data from 1223 participants in the COPD Genetic Epidemiology (COPDGene®) study11 with CT scans and blood gene expression data. Our analysis identified 2 disease axes that capture patterns of CT features consistent with emphysema and airway-predominant disease processes that are also associated with emphysema core-peel distribution and specific inflammatory pathways.
Methods
A comprehensive description of methods is included in the online supplement, and all analysis code is available in a GitHub repository (https://github.com/batmanlab/IEA).
Participant Enrollment and Data Collection
COPDGene enrolled 10,198 participants with a minimum 10-pack-year lifetime smoking history at 21 centers across the United States (NCT00608764).11 Individuals with a history of lung diseases other than asthma, such as pulmonary fibrosis, extensive bronchiectasis, and cystic fibrosis, are excluded from this study. Five-year follow-up data are available for 6717 participants, and 10-year follow-up visits are currently being completed. Participants underwent spirometry, questionnaire assessments, standardized inspiratory and expiratory chest CT imaging, and genome-wide single nucleotide polymorphism (SNP) genotyping. At the second visit (year 5), complete blood counts were conducted, PAXgene blood RNA tubes were collected, and RNA-seq was performed. Each center obtained institutional review board approval, and all participants provided written informed consent.
Learning Image-Expression Axes
Only participants whose CT scans were obtained on Siemens scanners with the b31f kernel and with RNA-seq data available at the second visit were analyzed. CT features were extracted from Digital Imaging and Communications in Medicine (DICOM) standard image files using the following procedure. Every inspiratory chest CT scan was divided into 581 patches, each with a volume of 323 mm3. We extracted 128 features from each patch using context-aware self-supervised representation learning (CSRL),12 resulting in a 581× 128-dimensional matrix for each scan.
Image-expression axes (IEAs) were constructed where CSRL features were the input to a multilayer perceptron (MLP) that produced a low-dimensional representation for each patch. Further supervised dimension reduction was performed to obtain participant-level IEAs using a product of an expert's model.13 At this stage, we applied statistically independent constraints with the Hilbert-Schmidt independence criterion14 to ensure that each IEA captured an independent disease process. A final linear layer used IEAs as the input to predict the expression levels of the genes simultaneously. The parameters of the model were jointly optimized via Adam, an optimization algorithm used to train a machine-learning model.15 In the training process, we evaluated the impact of feature selection on genes by testing each gene for the association with the top-128 principal components of the CSRL features in the training dataset. We also evaluated various thresholds for gene inclusion determined by the p-value of the F-test for each gene.
We randomly split the data into training and testing sets with sizes of 923 and 300, respectively. Model training was performed in the training set using 5-fold cross-validation, giving us 5 models. The final IEAs were given by taking the average value of the IEAs from the 5 models.
Association of Image-Expression Axes With Clinical Measurements
We computed Pearson correlation coefficients between IEAs and clinical measurements to understand their association. A full description of the measurements is included in the online supplement. Multivariable analyses were conducted by training ordinary least squares models for continuous measurements and logistic regression models for categorical measurements. We conducted a survival analysis (starting from the second visit) with the Cox proportional hazards model.16 We applied the IEA model to 1527 participants from another subset of the COPDGene dataset to provide independent replication of our IEA associations. These participants had their CT scans available but without RNA-seq data and, therefore, were not used for model training. A full description of these models, including model covariates, is provided in the online supplement.
Comparison of Image-Expression Axes to Other Disease Axes
We compared IEAs to the following disease axes:
- COPD factor analysis axes (FAs): Previously published phenotype disease axes identified through factor analysis.17
- Principal component analysis image-only axes (PCA-Is): Disease axes constructed by applying PCA to the CSRL features.
The comparative analyses included the calculation of Pearson correlation coefficients between IEAs and other disease axes, association analyses to clinical measurements, and comparison of nested models for clinical outcomes utilizing IEAs, FAs, and PCA-Is in determining whether IEAs improved the performance of models already containing FAs and/or PCA-Is.
Differential Expression and Usage Analyses
To identify the genes and pathways associated with IEAs, we conducted a differential gene expression analysis using the voom function18 of the limma package.19 Voom prepares RNA-Seq data for linear modeling. It works in conjunction with limma, a library specifically designed to assess differential expression through linear models. Multiple comparisons were corrected with the Benjamini-Hochberg method to control the false discovery rate (FDR)20 at 10%. Gene ontology (GO) pathway enrichment analysis was performed for pathways in the “biological process” category using the Top GO (v2.33.1) method.21 The threshold for statistical significance was an adjusted P-value < 0.001.
Results
A total of 1223 participants in the COPDGene study with complete CT scan and blood RNA-seq data were analyzed, and the flow diagram for the selection of participants for analysis is shown in Supplemental Figure E1 in the online supplement. The analyzed participants were 50% female, 82% non-Hispanic White, and 18% African American, and the average age of the participants was 67 years. The Global initiative for chronic Obstructive Lung Disease (GOLD)3 spirometric stage distribution of participants was 42.5% in GOLD 0, 44.0% in GOLD 1–4, and 13.5% with preserved ratio-impaired spirometry (PRISm). For model training and validation, participants were split into training and test sets, with no statistically significant differences in demographic or key clinical characteristics between these groups (Table 1).
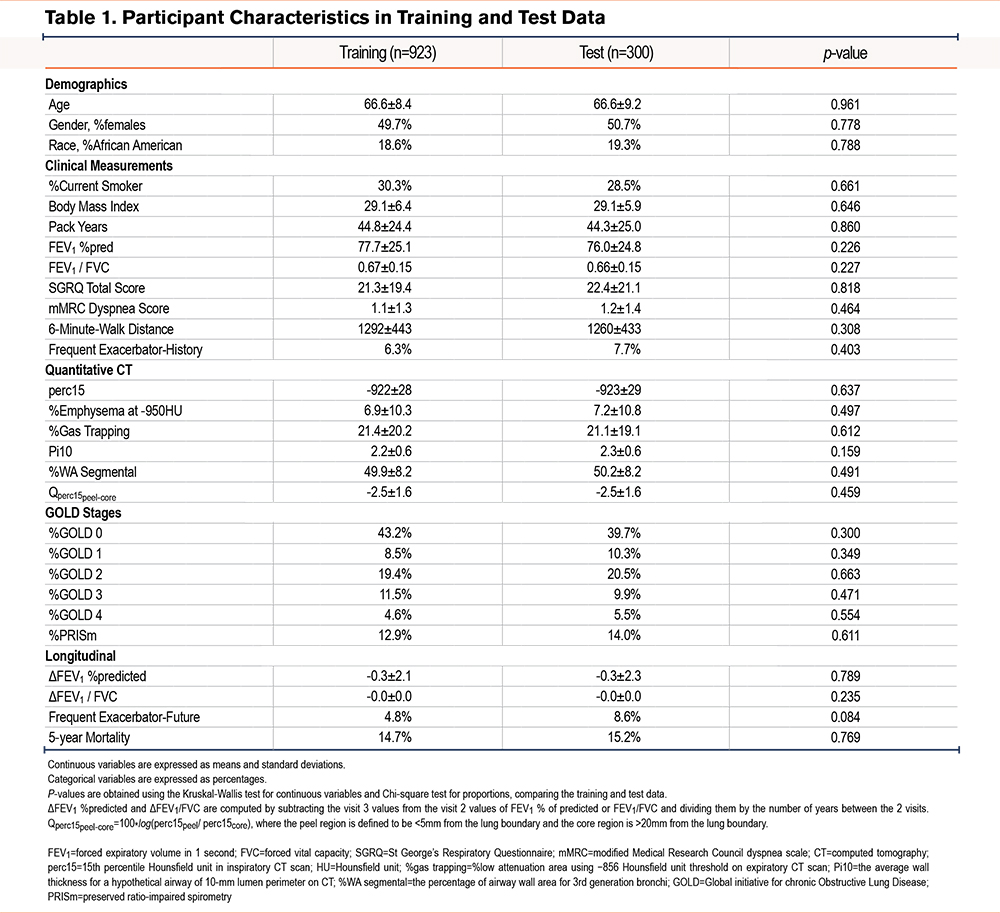
Image-Expression Axe Model Training and Reproducibility Analysis
A schematic overview of the model training process is shown in Figure 1, and the data flow is summarized in Supplemental Figure E2 in the online supplement. To maximize the stability of the IEAs and reduce the effects of sampling variability, we used nested cross-validation in the model training process to select the number of genes included in the model and the number of IEAs identified. For gene selection, we tested genes in the training data for the association to the top 128 principal components of the CSRL image features using an F-test, and a series of p-value thresholds for gene inclusion were explored, ranging from p=1x10⁻⁶ to p=1. The resulting IEAs were found to be stable across the entire range of p-value thresholds, and the threshold corresponding to p=0.01 was selected (Pearson’s r for IEAs across cross-validation folds ≥ 0.96, Supplemental Table E1 in the online supplement). With this threshold, 4685 genes were included in the final model. The number of IEAs identified by the model was determined by the amount of gene expression variance explained, which was the highest with 2 IEAs (Figure 2).
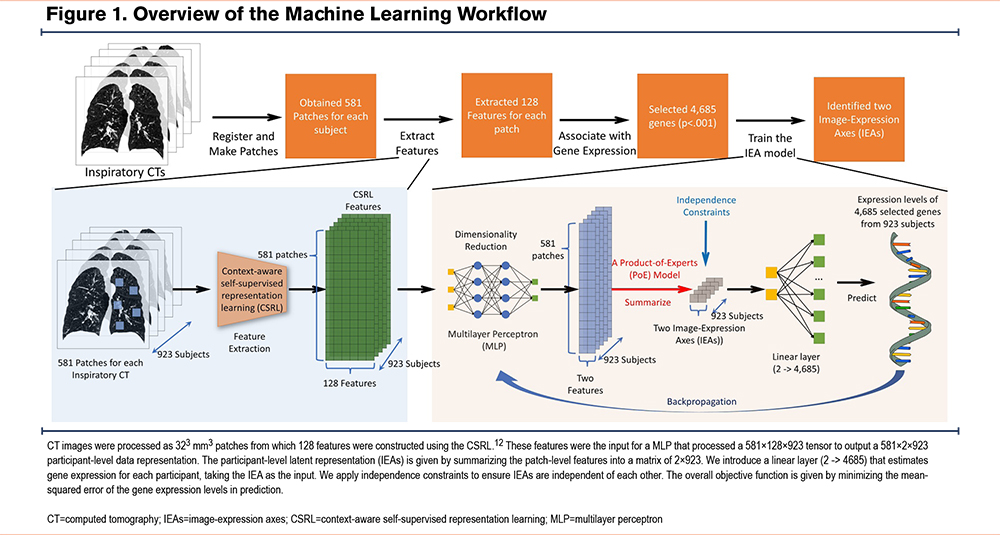
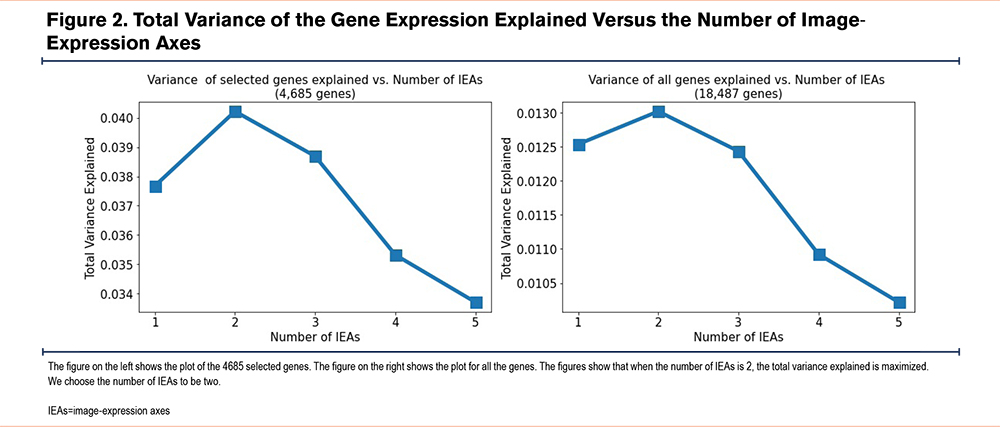
Image-Expression Axe Association to Clinical and Radiographic Features and Prospective Outcomes
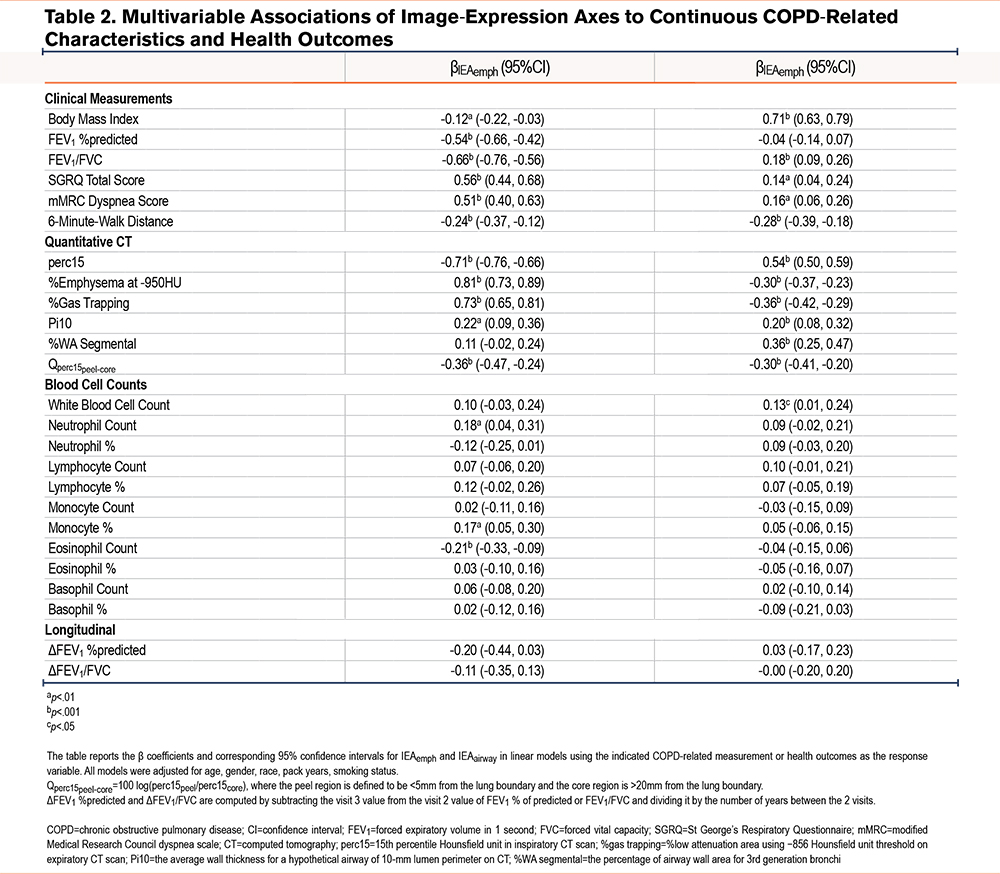
To provide a clinical interpretation of the IEAs, we calculated their correlation to a range of COPD-related clinical and imaging measurements Figure 3. We refer to the first IEA as the emphysema axis (IEAemph), because it demonstrates a pattern of clinical associations consistent with quantitative emphysema. Specifically, higher levels of IEAemph were associated with lower lung function, emphysema, lower body mass index (BMI), and a lower likelihood of being a current smoker. The second IEA is consistent with airway disease and is referred to as IEAairway. Higher levels of IEAairway were associated with higher BMI, thicker airways, and less emphysema. The analysis comparing IEAs with blood cell counts reveals that IEAemph is positively associated with the neutrophil count, proportion of neutrophils, and monocyte count, but negatively correlated with lymphocyte count and proportion. On the other hand, IEAairway is positively associated with both white blood cell count and neutrophil count. The IEAs were uncorrelated with each other, suggesting that they may capture different underlying disease processes.
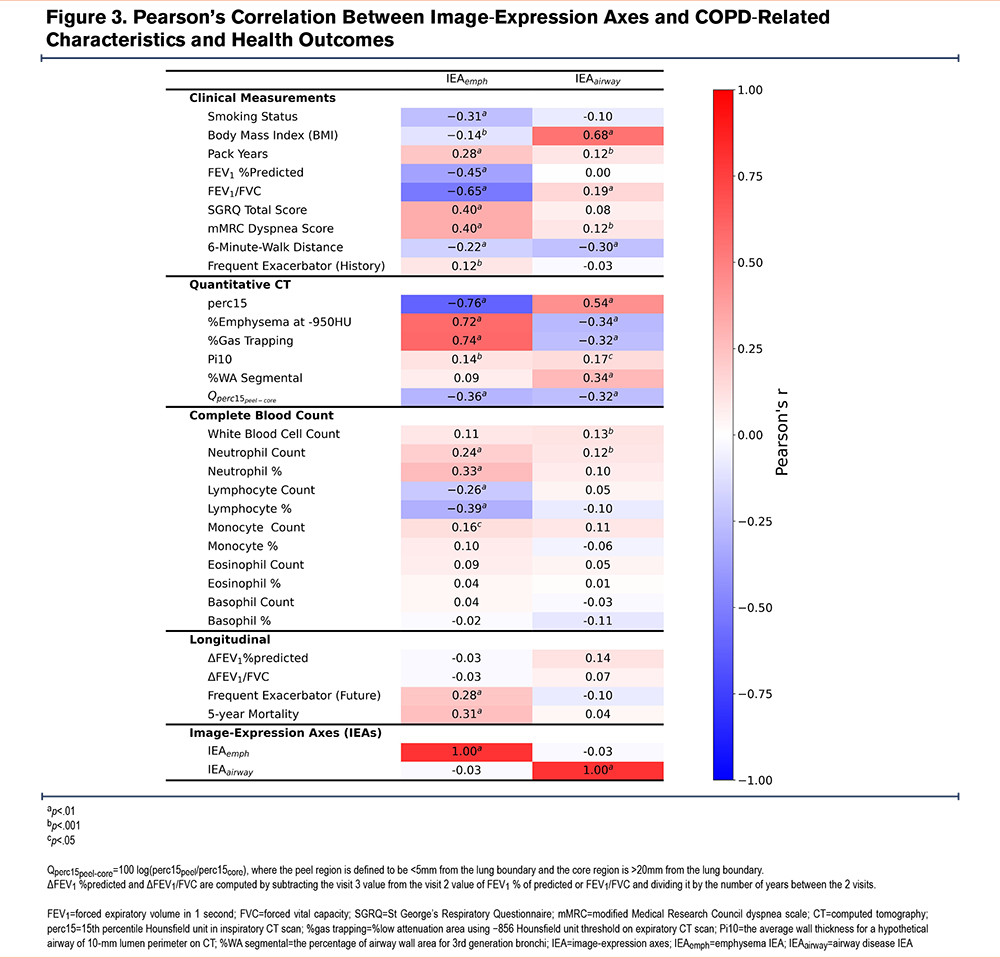
Figure 3 reveals that both IEAs showed a negative association with emphysema peel/core distribution (Qperc15peel-core), indicating that higher IEA values are linked to more emphysema in the central regions of the lung. To further explore this association, we conducted sensitivity analyses by dividing the lung into concentric bands based on the distance to the lung boundary and defining the peel region with different bands (as detailed in the online supplement). The results suggest that IEAemph exhibits a consistently positive association with Qperc15peel-core, regardless of the band used to define it. However, it is currently unclear whether the association between IEAairway and Qperc15peel-core reflects a real biological phenomenon at the extreme periphery of the lung, or if it is an artifact of segmentation.
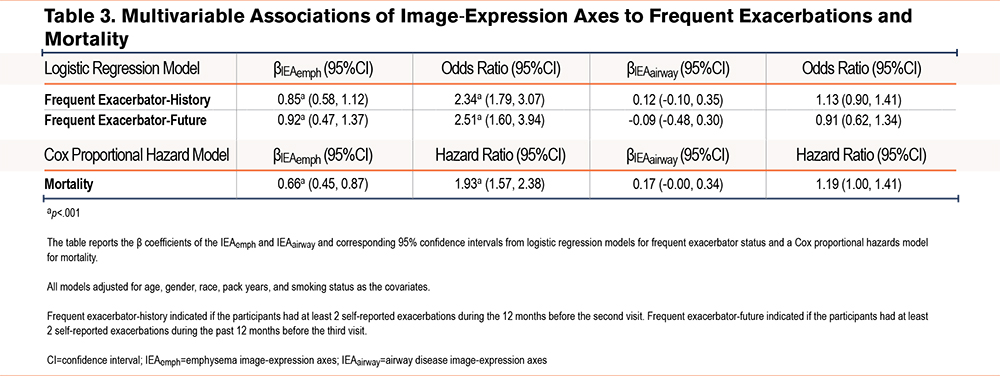
To determine whether the IEAs provided clinical information in addition to standard demographic variables, we tested the significance of adding IEAs to regression models for various COPD-related measures (Table 2, Table 3, and Supplemental Tables E2 and E3 in the online supplement). After adjusting for standard demographic variables, both IEAemph and IEAairway were significantly associated with forced expiratory volume in 1 second (FEV1) percentage predicted (%pred), FEV1 to forced vital capacity (FVC) ratio, St George’s Respiratory Questionnaire (SGRQ) total score, modified Medical Research Council (mMRC) dyspnea score, and 6-minute-walk distance, as well as neutrophil count. Additionally, IEAemph was also associated with being a frequent exacerbator-history, a frequent exacerbator-future, an all-cause mortality rate, monocyte proportion, and eosinophil count. On the other hand, IEAairway is associated with white blood cell count, neutrophil proportion, lymphocyte count, and lymphocyte proportion.
To provide independent replication of our IEA associations, the IEA model was applied to 1527 participants from another subset of the COPDGene dataset that had not been used for model training. All the significant associations to clinical and longitudinal measures remained significant with very similar effect estimates indicating a high level of reproducibility for IEAs (Supplemental Tables E4, E5, and E6 in the online supplement).
COPD Subgroups Defined by Image-Expression Axes and Comparison to Existing COPD Subtypes
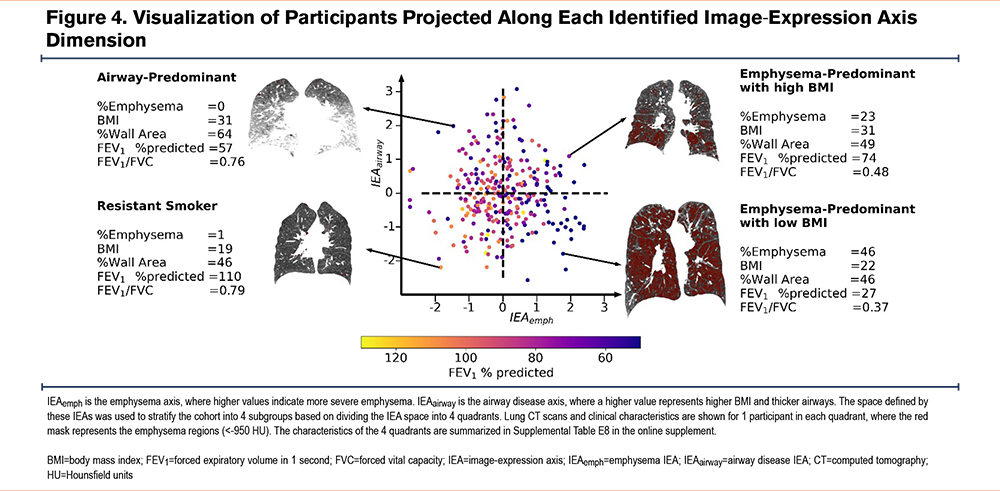
To further understand the clinical characteristics of COPD subgroups defined by IEAs, we divided the IEA space into 4 quadrants (Figure 4) and computed the average characteristics of each subgroup (Supplemental Table E8 in the online supplement). As expected, participants with low IEAemph/low IEAairway values had the least obstruction (mean FEV1 89.2% predicted), the highest percentage of GOLD spirometric grade 0 participants, low emphysema, and the thinnest airways. Participants with high IEAemph/low IEAairway values had characteristics consistent with emphysema-predominant COPD, namely high emphysema and low BMI, with about 70% of GOLD grade 4 participants present in this group. Participants with low IEAemph/high IEAairway values had an airway-predominant profile with thick airway walls, elevated BMI, and the greatest proportion of PRISm participants. Participants with high IEAemph/high IEAairway had the highest SGRQ total score, highest mMRC dyspnea scores, and shortest 6-minute walk distance. In terms of COPD progression, the groups differed significantly in mortality risk (p<0.001) and frequent exacerbation status (2 or more exacerbations in 1 year) but did not change in FEV1. The group with the highest mortality was high IEAemph/high IEAairway followed by high IEAemph/low IEAairway. The latter group also had the highest percentage of participants with frequent exacerbations, both for retrospective (p<0.001, Chi-square test of all groups) and prospective exacerbations (p=0.048).
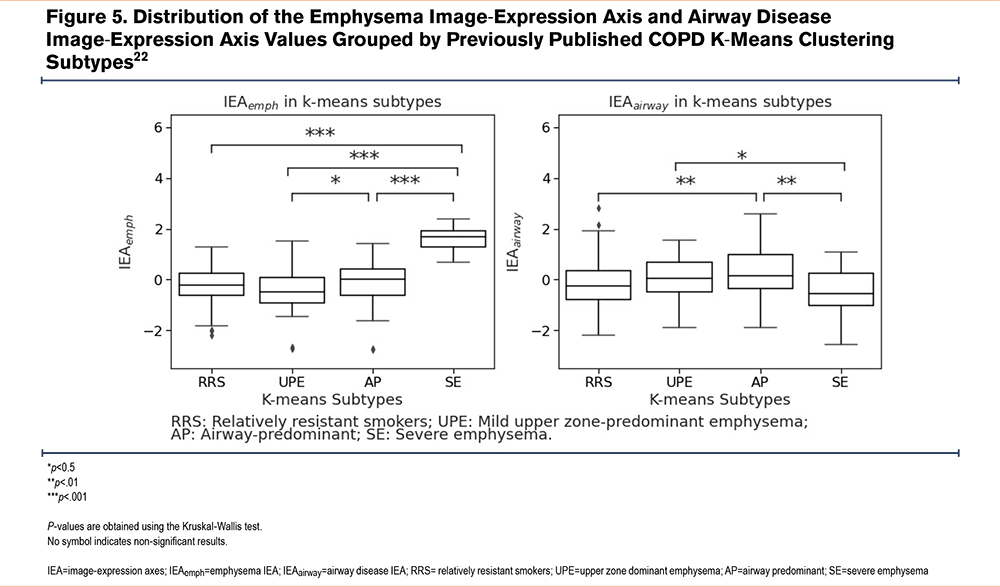
To place IEAemph and IEAairway in the context with previously reported subtypes and disease axes in COPDGene, we compared these axes directly with the previously reported k-means subtypes22 and FAs.17 In Figure 5, we observe that the highest values of IEAemph are found in the severe emphysema k-means subtype, and the highest values of IEAairway are found in the airway-predominant k-means subtype, confirming our clinical interpretation of these disease axes. Since the FAs also showed patterns consistent with emphysema (FAemph) and airway-predominant disease (FAairway), we compared the IEAs to the FAs and observed that IEAemph and FAemph showed a reasonably strong correlation (Pearson’s r=0.58), but the IEAairway and FAairway axes showed only modest correlation (Pearson’s r=0.28, see Supplemental Table E9 in the online supplement). Examination of the pattern of clinical associations for IEAairway and FAairway revealed that while airway axes were positively correlated to airway wall thickness, IEAairway is negatively correlated to emphysema, whereas, FAairway is positively correlated (Supplemental Table E10 in the online supplement). To determine whether the IEAs provided additional information about COPD phenotypes (FEV1 % pred, FEV1/FVC, SGRQ, mMRC, retrospective frequent exacerbations, and 6-minute walk distance) and COPD progression (mortality and prospective frequent exacerbations) above and beyond FAs, we constructed baseline models for each COPD phenotype and progression measurements with FAs included and then compared them to models including both FAs and IEAs. In most cases, the models with IEAs included outperformed the baseline models (p<0.001 for all COPD phenotypes and mortality, Supplemental Tables E11 and E12 in the online supplement).
Comparison to Principal Components Based on Images Alone
After observing that IEAs contain additional clinically relevant information relative to standard features extracted from CT images, we sought to determine whether the additional information came only from applying dimension reduction to the CT images (CSRL features), or whether there was added value from our algorithm that combined the CT features with gene expression. To make this comparison, we constructed disease axes from images only by using PCAs to extract the top 2 principal components (PCs) of the CSRL features, denoted as PCA-Is. We then compared the predictive performance of linear models that utilize both IEAs and PCA-Is with the nested version that involves the PCA-Is only, and we observed that the models including IEAs were superior to models with PCA-Is only for all of the 6 studied COPD phenotypes as well as prospective exacerbations and mortality (p<0.001, Supplemental Tables E13 and E14 in the online supplement). These results suggest that by incorporating gene expression data during training, IEAs extract more clinically important information than similar methods that utilize imaging features only.
Image-Expression Axes Are Associated With Inflammatory Pathways
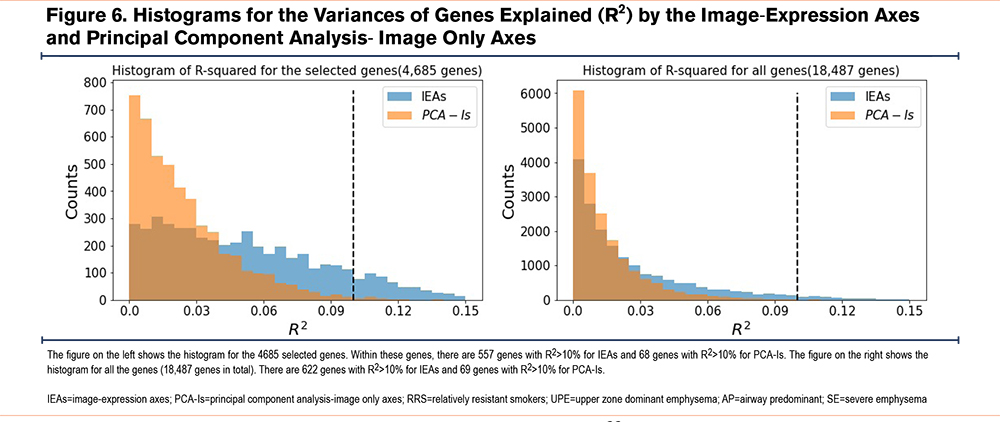
To understand the biological aspect of the IEAs, we first confirmed that IEAs explained a greater proportion of gene expression variance than PCA-Is, as demonstrated in Figure 6, which shows that IEAs explain a greater proportion of variation on a per-gene basis than PCA-Is (557 genes with R2>10% for IEAs versus 68 genes with R2>10% for PCA-Is).
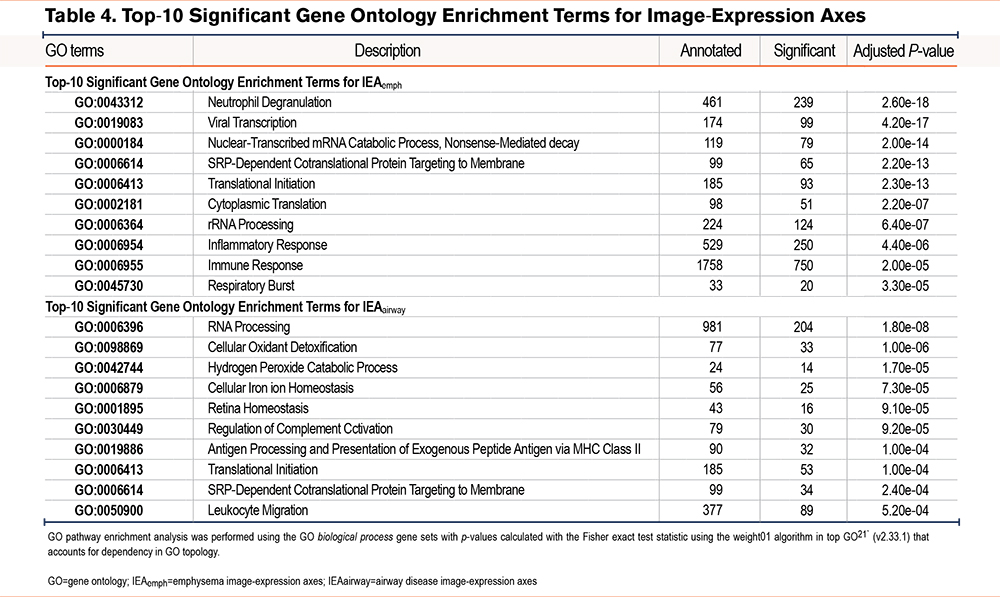
To identify specific biological processes associated with each IEA, we performed differential expression and pathway enrichment analysis. We identified 6494 and 3815 genes associated at an FDR of 10% with IEAemph and IEAairway, respectively (Supplemental Tables E15 and E16 in the online supplement). GO pathway enrichment identified 29 and 13 enriched pathways (p-value < 0.001) for IEAemph and IEAairway, respectively (Supplemental Tables E17 and E18 in the online supplement). The most significantly associated pathway for IEAemph was neutrophil degranulation, whereas IEAairway had the strongest enrichment for RNA processing. The most significant pathway results are shown in Table 4.
Discussion
In this paper, we used deep learning to identify novel connections between lung imaging features and blood gene expression. The deep learning model provided novel disease axes, i.e., IEAs, that captured elements of shared variability between CT scans and blood RNA-seq. We demonstrated: (1) that these IEAs are associated with important COPD-related physiologic and functional measures, (2) that these associations contained information that is independent from pre-existing, standard clinical and imaging variables, (3) that the IEAemph axis is significantly associated with prospective mortality in multivariable models, and (4) that IEAs capture distinct patterns of connection between lung structural changes and blood transcriptome patterns.
Many of our main results are consistent with our current understanding of COPD. IEAs capture the 2 cardinal pathologies of COPD, emphysema, and airway disease; but clearer links between these aspects of lung structure and blood transcriptome patterns emerge from the joint analysis of CT images and blood RNA-seq. First, neutrophilic inflammation was strongly associated with emphysema but not the airway axis. This agrees with the prominent role of neutrophils in alpha-1 antitrypsin deficiency-associated emphysema,23 and it provides further support for the role of neutrophils in the emphysema of typical COPD. The IEAemph axis is negatively correlated with FEV1 and it is positively correlated with neutrophil and monocyte counts with corresponding negative correlation to lymphocyte counts. This result is consistent with previous observations that FEV1 itself is positively correlated with lymphocyte counts, and negatively correlated with neutrophil and monocyte counts.24 There is evidence as well for a role for specific adaptive immune processes that show significant enrichment for both IEAemph and IEAairway, though the inflammatory signals that we observed in blood differ from the B-cell predominated signatures that have been observed in some lung transcriptomic studies of emphysema.25 This discrepancy is expected, because the B-cell signature in the lungs may be driven by the aggregation of B-cells in submucosal lymphoid aggregates, which would not be expected to be observable in peripheral blood samples. The biological pathway enrichments we observed are consistent with previous reports of the association of emphysema to biomarkers related to systemic inflammation, oxidative stress, and elevated plasma fibrinogen levels.26 IEAairway is strongly correlated to BMI, which coincides with a previous hypothesis that obesity-related adipose tissue hypoxia and systemic hypoxia due to reduced pulmonary function contribute to the systemic inflammation of COPD.27 Future studies, including single-cell transcriptomic data, could better identify the association of emphysema and airway disease with specific types of innate and adaptive inflammatory cells.
While our IEAs seem most descriptive of emphysema and airway disease, they are not completely correlated to standard CT measurements of emphysema and airway disease, and they differ notably from machine-learning disease axes based on imaging alone (PCA-Is) or based on imaging and spirometry (FAs).17 While none of these representations of emphysema and airway disease is demonstrably superior to the others, the IEA axes have a clear interpretation due to the integrative nature of the deep learning algorithm, whose goal was to find shared variability between CT images and transcriptomic patterns in the blood. The clinical relevance of these axes was demonstrated through regression models showing that IEAs were significantly associated with a wide range of COPD-related measures, including mortality. In the future, these algorithms can be extended to incorporate additional sources of molecular or imaging data.
While the IEAs primarily captured patterns of emphysema and airway-predominant COPD, they were also significantly correlated with core versus the periphery (peel) emphysema distribution. Previous work has demonstrated numerous clinically relevant associations to aspects of emphysema distribution, most notably for core/peel and apical/basal emphysema distribution,28-32 and a machine learning analysis of images alone also identified peel-core emphysema distribution as an important dimension of COPD-related variability.33 Our analysis suggests that blood transcriptome patterns are most strongly associated with core/peel rather than apical/basal emphysema distribution and that the amount of emphysema in the core region is associated with the more severe disease along both the IEAemph and IEAairway axes. Since quantification of the lung peel can be influenced by technical factors related to lung segmentation, we conducted sensitivity analyses that confirmed a consistent association for the IEAemph axis, whereas the IEAairway association was clearly present only when the analysis included the outermost lung regions. Accordingly, we have high confidence in the IEAemph association to core/peel distribution, but it is not clear whether the IEAairway axis association reflects a true biological relationship or technical artifacts.
By collecting CT scans, blood transcriptomics, and detailed phenotype data on thousands of current and former smokers enriched for COPD, the COPDGene study provides a novel opportunity for the application of machine learning to better understand the connections between the lung structure in COPD and molecular mechanisms of systemic inflammation. Like all machine learning models, the construction of our model required many explicit and implicit design choices. In our model, we extracted patch-level representations via self-supervised learning. Such methods are capable of extracting generalized and semantically meaningful features.34 The linear independence assumption in our model was intended to identify IEAs that captured distinct underlying disease processes and increase the reproducibility of our model. Unlike previous studies that explore the relationship between COPD imaging and omics by associating previously discovered image patterns to omics data,22,35,36 our method potentially identifies new image patterns that have not been previously explored.
The main strengths of this study are:
- The joint analysis of full DICOM data from CT images and gene expression data via deep learning is novel and provides new biological and clinical insight into COPD.
- The sample size is large, allowing for more power to identify novel discoveries.
- We used a number of techniques to improve the reproducibility of our disease axes, including cross-validation, sensitivity analysis, and the use of constraints in our modeling procedure.
The main limitations are: (1) our study is limited to blood RNA biomarkers, which capture systemic inflammation but no other important aspects of the COPD inflammatory response, such as lung gene expression and protein biomarkers, and (2) our analysis was limited to the COPDGene study. In the future, such analyses could be conducted in other ongoing studies collecting CT scan and omics data in populations enriched for COPD.
In summary, deep learning applied to CT images, and transcriptomic biomarkers in COPD identified 2 main inflammatory processes related to CT image features that can be broadly defined as emphysema and airway disease. The emphysema-related process was most enriched for pathways related to neutrophilic inflammation. The airway axis differed from previously reported disease axes learned from phenotypic data alone and it was negatively correlated with emphysema. Finally, there was also a strong relationship between the core-peel distribution of emphysema and blood transcriptome patterns. In the future, these integrative machine learning methods can be refined for more fine-grained interpretability and extended to include other sources of biological information.
Acknowledgements
Author contributions: JC, PJC, and KB designed the study. JC performed the modeling and statistical analysis and wrote the initial manuscript. ZX conducted differential expression and usage analyses. LS and KY conducted image pre-processing and feature extraction. CPH, AB, J H, FCS, EKS, and PJC assisted with the analysis of the COPDGene data. All authors contributed to the production of the final manuscript with revision for important intellectual content.
Declaration of Interest
PJC has received grant support from Bayer and consulting fees from Novartis and GSK. CPH reports grant support from Bayer, Boehringer-Ingelheim, and Vertex, and consulting fees from AstraZeneca and Takeda. EKS has received grant support from Bayer and GSK. All other authors have nothing to declare.