Running Head: COPD Respiratory Microbiome Profiles
Funding Support: This study was supported by the National Natural Science Foundation of China (grant no. 81800036) and the National High-Level Hospital Clinical Research Funding, Elite Medical Professionals Project of China-Japan Friendship Hospital (grant no. ZRJY2021-TD02).
Date of Acceptance: December 12, 2023 │ Published Online Date: December 19, 2023
Abbreviations: %pred=percentage predicted; BMI=body mass index; CAT=COPD Assessment Test; CH=Calinski-Harabasz; COPD=chronic obstructive pulmonary disease; FEV1=forced expiratory volume in 1 second; ICS=inhaled corticosteroid; LDA=linear discriminant analysis; LEfSe=linear discriminant analysis effect size; mMRC=modifed Medical Research Council; PAM=partitioning around medoid; PCoA=principal coordinates analysis
Citation: Yu T, Chen Y, Ren X, Yang T. Respiratory microbiome profiles associated with distinct inflammatory phenotype and clinical indexes in chronic obstructive pulmonary disease. Chronic Obstr Pulm Dis. 2024; 11(2): 155-163. doi: http://doi.org/10.15326/jcopdf.2023.0445
Online Supplemental Material: Read Online Supplemental Material (413KB)
Introduction
Chronic obstructive pulmonary disease (COPD) is a common disease characterized by persistent airway symptoms and restricted airflow, which cause airway and/or alveolar abnormalities.1 The pathogenesis of COPD is complex; inflammation is a major causative mechanism. In recent years, bacterial colonization in the lungs of patients with COPD has been recognized as an important factor contributing to chronic airway inflammation, however, the exact underlying mechanisms are unclear.2,3
Many studies have found significant bacterial colonization in the lungs of healthy individuals and patients with COPD using 16S rRNA assays.4-7 The main normal colonizing bacteria in the lower respiratory tract of the healthy population are genera from the phyla Bacteroidetes (Bacteroides and Prevotella), Firmicutes (Veillonella and Streptococcus), Proteobacteria, and Fusobacteria (Fusobacterium).8 In patients with stable COPD, the types and proportions of airway microorganisms change, with the main colonizing phyla being Aspergillus, Firmicutes, and Actinomycetes, with Veillonella, Haemophilus, Streptococcus, Prevotella, Neisseria, and Moraxella being the dominant genera.4,9 The proportion of Aspergillus increases further when acute exacerbations of slow-onset lung disease occur.10 Moreover, the alpha and beta diversity of airway microorganisms is significantly lower in patients with COPD and those with acute exacerbations of COPD than in the normal population.11-13 Additionally, changes in pulmonary microecology correlate with the severity of disease. A study by Sze et al6 found a significant decrease in microbial diversity in patients with the Global initiative for chronic Obstructive Lung Disease (GOLD)14 stage 4 COPD compared with the normal population, mainly associated with Firmicutes and Aspergillus. Dicker et al15 also showed that Aspergillus was associated with disease stage, risk of acute exacerbation, blood eosinophil levels, and predicted percentage (%pred) of forced expiratory volume in 1 second (FEV1) in patients with COPD. However, few studies have explored the correlation among airway microorganisms, symptoms, and biological indicators in patients with COPD.
Therefore, this study aimed to detect microbial changes in the sputum of patients with stable COPD using the 16S rRNA method and to explore their relationship with clinical symptoms and biological indicators.
Materials and Methods
Study Population
Thirty-two patients with stable COPD were recruited between December 2019 and December 2020 from the outpatient clinic of the China-Japan Friendship Hospital, Beijing, China. The inclusion criteria for patients with COPD were as follows: (1) met the GOLD 2021 diagnostic criteria,14 (2) aged > 40 years, and (3) no acute exacerbations within 1 month. Exclusion criteria were: (1) history of chronic diseases such as severe cardiovascular and cerebrovascular pathology and liver and kidney insufficiency; (2) history of epilepsy and other neuropsychiatric diseases; (3) history of antituberculosis drug treatment or active tuberculosis; (4) history of thoracic, abdominal, or ophthalmic surgery in the last 3 months; (5) pregnancy/ lactation; (6) untreated cancer with an expected survival of < 1 year; and (7) unwillingness to participate and inability to cooperate. All participants completed questionnaires, pulmonary function tests, and computed tomography examinations. All patients signed an informed consent form, and the study protocol was approved by the Ethics Committee of the China-Japan Friendship Hospital (2018-148-K105). All experiments were performed in accordance with the Declaration of Helsinki.
16S rRNA Gene Sequencing
All patients received sputum induction after inhalation of 3% hypertonic saline from an ultrasonic nebulizer, and sputum was stored in a -80 °C refrigerator. Total genomic DNA was extracted from the sputum samples using the cetyltrimethylammonium bromide/sodium dodecyl sulfate method. DNA concentration and purity were monitored on a 1% agarose gel. According to the concentration, DNA was diluted to 1 ng/μL using sterile water. Polymerase chain reaction amplification was performed using fusion primers targeting the V3–V4 region of the 16S rRNA gene. The fusion primers used were 806R (5′-GGACTACNNGGGTATCTAAT-3′) and 341F (5′-CCTACGGGRBGCASCAG-3′) with the barcode. Sequencing libraries were generated using TruSeq® DNA PCR-Free Sample Preparation Kit (Illumina, San Diego, California) following the manufacturer's recommendations, and index codes were added. Library quality was assessed using a Qubit@ 2.0 Fluorometer (Thermo Scientific, Waltham, Massachusetts) and an Agilent Bioanalyzer 2100 system. Finally, the library was sequenced on an Illumina NovaSeq (Illumina, San Diego, California) platform, and 250 bp paired-end reads were generated.
Microbiome Analyses
Paired-end reads were assigned to samples based on their unique barcodes and truncated by cutting off the barcodes and primer sequences. Fast Length Adjustment of Short Reads was used for sequence assembly. Quality filtering of the raw tags was performed under specific filtering conditions to obtain high-quality clean tags according to the Quantitative Insights Into Microbial platform. Finally, the tags were compared with those in the reference database using the UCHIME algorithm. Sequence analysis was performed using UPARSE software. Sequences with ≥ 97% similarity were assigned to the same operational taxonomic units.
Microbiome Data Analysis for the Clustered Groups
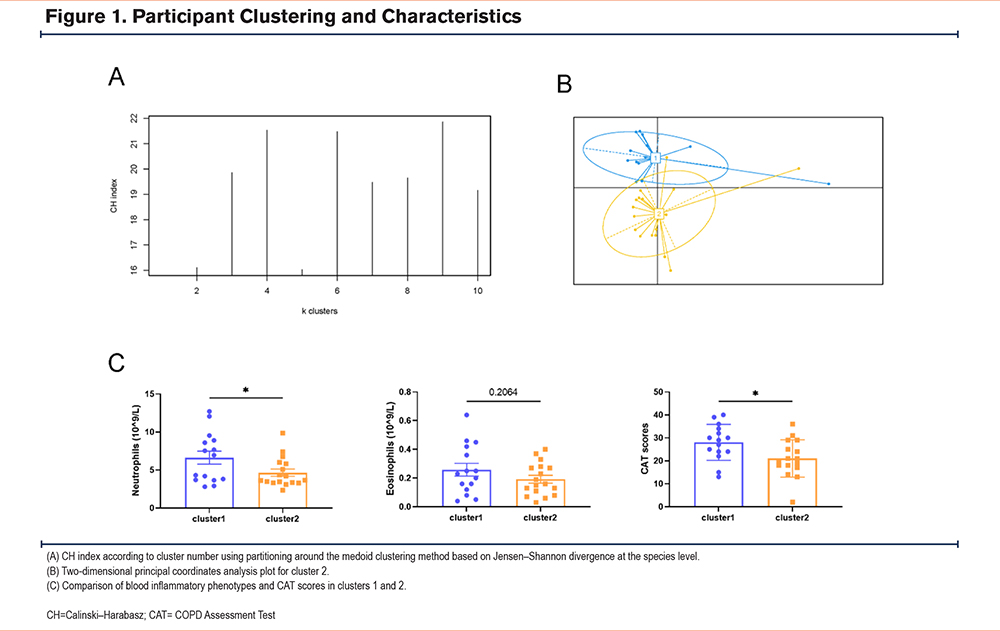
We performed clustering analysis on the samples using species-level abundance data, employing the partitioning around medoid (PAM) clustering algorithm based on the Jensen–Shannon divergence.16 To determine the optimal number of clusters, we calculated the Calinski–Harabasz (CH) index based on cluster count.17 The resulting clusters were visualized using the "ade4" package in R for principal coordinates analysis (PCoA) utilizing Jensen–Shannon divergence.18
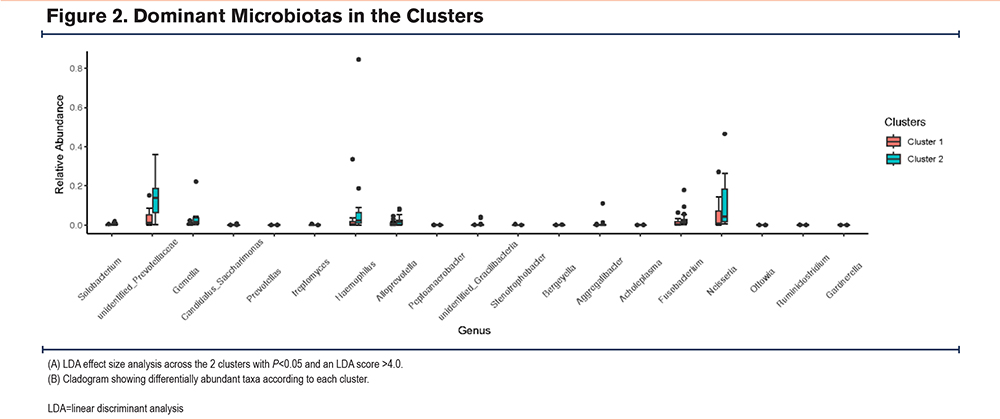
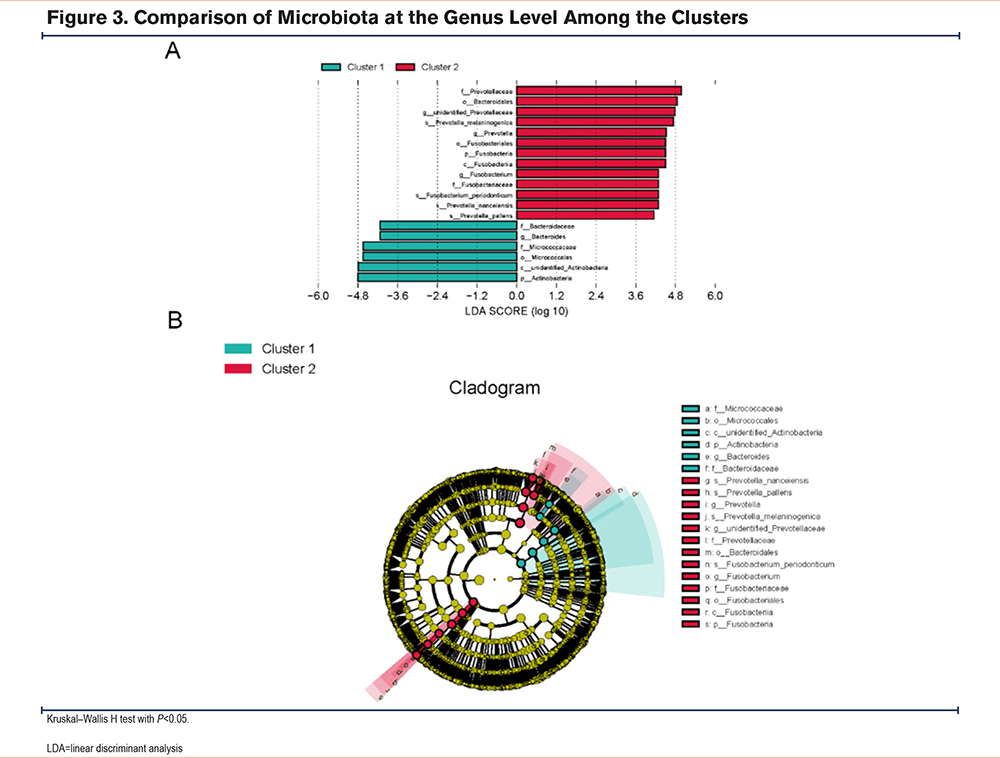
Linear discriminant effect size (LEfSe) analysis was conducted to identify the microbiota as biomarkers associated with each cluster. Significant biomarkers were identified using a linear discriminant analysis (LDA) score >4.0 and a P< 0.05 in pairwise comparisons using the Mann–Whitney test and Bonferroni's methods.19 The resulting biomarkers were visualized using GraPhlAn for cladogram representation and the R statistical package (R version 3.2.5; Institute for Statistics and Mathematics, Vienna, Austria) with the "ggplot" package for boxplot visualization, based on the Kruskal–Wallis H test.20
Statistical Analysis
Patients were clustered using PAM clustering and the CH index, and the demographic characteristics of different groups of patients were analyzed using the t-test for continuous variables and Chi-square test for categorical variables. Continuous data are presented as median ± standard deviation, and categorical data are presented as numbers and percentages. Spearman’s correlation was used to assess the correlation between each group of marker microorganisms and clinical indicators. Statistical significance was set at P<0.05, and the data were analyzed using SPSS (version 26.0; IBM, Armonk, New York).
Results
Participant Demographics and Sputum Microbiota Composition
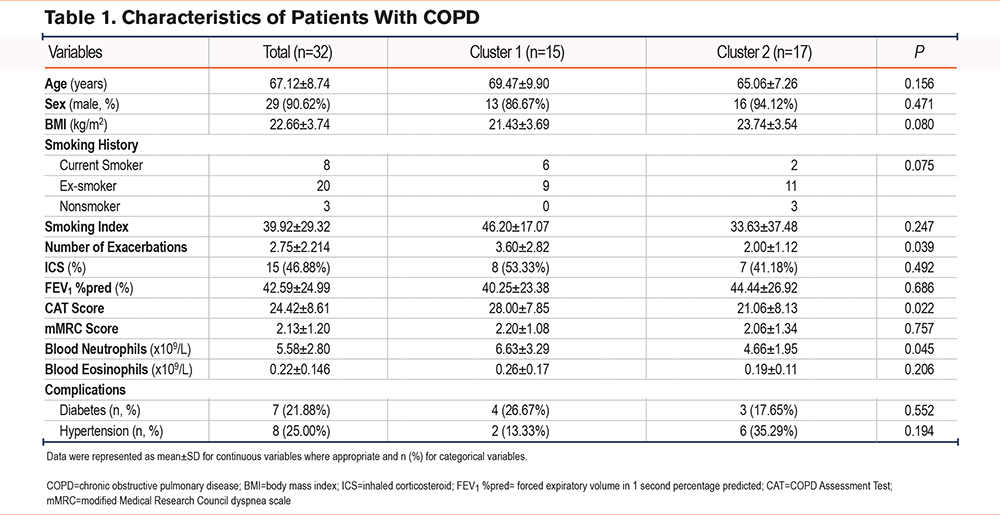
A total of 32 patients with COPD were enrolled (Table 1). The mean FEV1 %pred was 42.59%, and the mean COPD Assessment Test (CAT) and modified Medical Research Council (mMRC) dyspnea scale scores were 24.42 and 2.13, respectively. The predominant phyla observed in the microbiome were Firmicutes, Proteobacteria, and Bacteroidetes, followed by Actinobacteria and Fusobacteria. At the genus level, the most abundant genera were Haemophilus, Streptococcus, Neisseria, and Rothia, although some individual samples also showed a predominance of genera such as Porphyromonas, Acinetobacter, Abiotrophia, Lactobacillus, and unknown members of Prevotellaceae and Corynebacteriaceae (Supplementary Figure 1A-1B in the online supplement).
Participant Clustering and Characteristics
According to the PAM clustering and CH index, for sputum species-level bacteria, clustering patients into 2, 3, or 4 clusters resulted in a higher CH index, whereas the PCoA plots showed better separation (Figure 1A-1B, Supplementary Figure 2A-2B in the online supplement). We compared the clinical indexes of the patients using different clustering methods and found significant differences in blood neutrophil counts, number of exacerbations, and CAT scores when divided into 2 clusters (Figure 1C, Supplementary Figure 2C-2D in the online supplement). When divided into 3 or 4 clusters, there was only one sample in a cluster and the sample size was small and thus, could not be representative to a certain extent. Therefore, we divided the patients into 2 clusters. The clinical demonstration of each cluster is shown in Table 1.
Dominant Microbiotas in the Clusters
We used LEfSe analysis to analyze the different microbial distributions in the 2 patient groups (LDA score: 4.0) (Figure 2). At the phylum level, Actinobacteria were the more dominant microorganisms in cluster 1, and Fusobacteria were the predominant microorganisms in cluster 2. At the genus level, cluster 1 was dominated by Bacteroides, while cluster 2 was dominated by Prevotella, Fusobacterium, and unidentified Prevotellaceae. As it is difficult to fully recognize the species level of many microorganisms through 16S rRNA, we compared 2 clusters at the genus level21 at P < 0.05 using the Kruskal–Wallis H test to identify the dominant microbiota related to each cluster (Figure 3). Cluster 2 had more elevated counts of Prevotella, Fusobacterium, Solobacterium, and Gemella than cluster 1, whereas cluster 1 had more elevated counts of Streptomyces, Peptoanaerobacter, and Ottowia than cluster 2. Combining these 2 analyses, cluster 2 had more Prevotella and Fusobacterium than cluster 1.
Relationship Between the Sputum Flora and Clinical Phenotypes
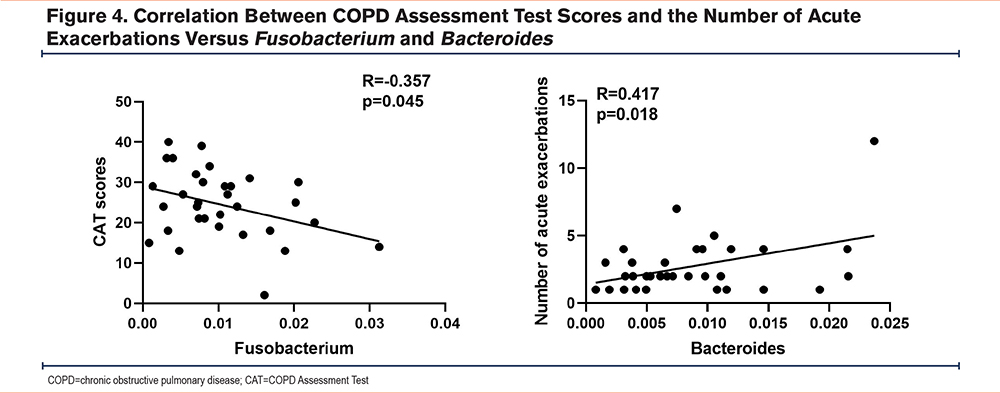
To explore the correlation between differentially predominated changes in microbiota tested in the sputum, including Prevotella, Fusobacterium, and Bacteroides, and the clinical index parameters, we performed Spearman correlation analysis (Supplementary Table 1 in the online supplement). As shown in Figure 4, there was a positive correlation between Bacteroides and the number of acute exacerbations (r=0.417, P=0.018), a negative correlation between Fusobacterium and CAT scores (r=-0.357, P=0.045), and no significant correlation between other bacteria and the number of acute exacerbations or CAT scores.
Discussion
Using the unbiased microbiome profile clustering method for clustering sputum microorganisms in patients with COPD, we divided patients into 2 clusters. Patients with a lower abundance of Prevotella and Fusobacterium and a higher abundance of Bacteroides had higher CAT scores and a neutrophil inflammatory phenotype. Correlation analysis showed a positive correlation between Bacteroides and the number of acute exacerbations and a negative correlation between Fusobacterium and CAT scores.
The unsupervised clustering of microorganisms used in this study is a relatively new method. Most studies exploring the correlation between microorganisms and clinical phenotypes are grouped based on clinical phenotypes, with few groupings based on microorganisms. We chose to group patients with COPD according to their microbial characteristics, which is different from the method used in previous studies.22-24 Meanwhile, one study in previous literature grouped patients according to the major genus Haemophilus but did not use the unsupervised clustering method used in this study,25 which has some bias. In addition, this method has also been used in a study on adult and pediatric asthma that showed a significant correlation between classification and clinical characteristics.26,27 Alongside this cluster method, we also identified the neutrophil inflammatory phenotype, an important phenotype in COPD. Therefore, this cluster analysis method may be more clinically relevant.
In the present study, cluster 2 had a lower acute exacerbation of COPD, neutrophil inflammation, and CAT score compared to cluster 1. Additionally, at the genus level, there was a higher Prevotella count. A negative correlation was found between Prevotella and disease severity. This is comparable to Mayhew et al,28 which found that Haemophilus and disease severity were positively correlated, while Prevotella was negatively correlated. Similarly, another study found that Prevotella abundance was significantly higher in healthy individuals and significantly associated with better lung function and reduced symptoms in patients with COPD.29 Moreover, previous studies have also found that Fusobacterium exhibited a significant positive correlation with pre-FEV1,30 and Fusobacterium and Prevotella jejuni were significantly more abundant in the infrequent than in the frequent exacerbator group.23 This confirms that Fusobacterium and Prevotella are negatively correlated with disease severity.
This study had some limitations. First, the sample size was not sufficiently large, and a larger sample size is needed to confirm the results. Second, this was a cross-sectional study that can only show a correlation between microorganisms and clinical indicators but does not confirm the existence of a causal relationship. Finally, this was a clinical study lacking relevant basic experiments for validation. Therefore, additional data are required to support the results of this study.
Conclusion
This microbiome-driven unbiased clustering method for COPD can help identify new endotype-related COPD phenotypes. This study divided patients into 2 clusters for microbial clustering and found that differential flora was negatively associated with CAT scores and the number of acute exacerbations of COPD. Thus, understanding the mechanisms that drive bacterial composition and disease will help to prevent and discover new phenotypes of COPD and treat this condition.
Acknowledgements
Author contributions: XR and TY were responsible for the study’s concept and design. YC was responsible for data collection and TY provided data analyses and drafted the initial manuscript. All authors were responsible for data interpretation and proofing and approving the final manuscript. XR is the guarantor of the manuscript’s content including all data and data analysis.
Data availability statement: The datasets used and/or analyzed in the current study are available from the corresponding author upon reasonable request.
The authors thank Dr. Lichao Sun (Department of Emergency, China-Japan Friendship Hospital, Beijing, China) and Professor Hongbo Zhang (Department of Emergency, China-Japan Friendship Hospital, Beijing, China) for their help with data acquisition in this study.
Declaration of Interests
The authors declare they have no competing interests.