Running Head: Phenomapping Severe COPD Exacerbations
Funding Support: R01 HL153604, and R03 HL154275 to JLG. This publication was made possible by CTSA Grant Number UL1 TR000142 from the National Center for Advancing Translational Science (NCATS), a component of the National Institutes of Health (NIH). National Heart, Lung, and Blood Institute, 2T32HL007778-26 to support JZ and SK. R01 HL155948 to MS. Manuscript contents are solely the responsibility of the authors and do not necessarily represent the official view of the NIH.
Date of Acceptance: October 13, 2024 | Publication Online Date: October 17, 2024
Abbreviations: ABG=arterial blood gas; AECOPD=acute exacerbations of COPD; AIC=Akaike information criterion; BMI=body mass index; BUN=blood urea nitrogen; CRP=C-reactive protein; COPD=chronic obstructive pulmonary disease; EHR=electronic health record; FDR=false discovery rate; HF=heart failure; HR=hazard ratio; ICS/LABA=inhaled corticosteroid/long-acting beta2-agonist combination; ICU=intensive care unit; IL=interleukin; ML=machine learning; pro-BNP=probrain natriuretic peptide; T2=type 2
Citation: Li H, Huston J, Zielonka J, Kay S, Sauler M, Gomez J. Identification of severe acute exacerbations of chronic obstructive pulmonary disease subgroups by machine learning implementation in electronic health records. Chronic Obstr Pulm Dis. 2024; 11(6): 611-623. doi: http://doi.org/10.15326/jcopdf.2024.0556
Online Supplemental Material: Read Online Supplemental Material (457KB)
Introduction
Chronic obstructive pulmonary disease (COPD) is heterogeneous.1-3 Factors involved in heterogeneity include clinical characteristics, distinct pathobiological characteristics, including types of inflammation, genetic factors, and treatment response. The emergence of the concept of endotypes has led to the development of novel disease classification models.4 Acute exacerbations of COPD (AECOPDs) also exhibit this heterogeneity, which can be related to the baseline characteristics of the subgroups or to the triggers for exacerbations.5
Severe AECOPDs that require hospitalization are associated with significant morbidity and mortality, in addition to significant health care expenses.6 Furthermore, the Centers for Medicare and Medicaid Services has established a Hospital Readmission Reduction Program that penalizes hospitals that have high readmission rates for COPD.7 All these factors underscore the impact of severe AECOPDs on patients and the health care system and underscore the importance of understanding the heterogeneity associated with severe exacerbations.
Several studies have shown the ability of machine learning (ML) methods to identify discrete groups in COPD.
COPD subgroups have been identified by: (1) cytokine profiles2; (2) a combination of clinical data including comorbidities8; (3) a combination of clinical, physiologic, and imaging data1; and (4) imaging,9 among others. A new eosinophilic endotype of COPD has also been identified thanks to advances in our understanding of COPD pathobiology.10,11 Despite these important observations, the highly selected cohorts used to obtain these insights may not reflect the overall COPD patient population.
The 2009 Federal Health Information Technology for Economic and Clinical Health Act led to the creation of an incentive program to encourage hospitals and health care providers to adopt electronic health records (EHRs). Currently, more than 95% of U.S. hospitals have adopted EHRs.12 As a result of EHR adoption, the volume of health care data has increased exponentially13 from 153 exabytes in 2013 to 2314 exabytes in 2020. This massive increase in data encodes millions of health care encounters and creates a crucial opportunity to transform patient care. The concept of computable phenotypes, defined as clinical conditions or characteristics that are derived from a computerized query using a defined set of data elements,14 has gained significant attention as a result. By leveraging EHR data, clinical decision-making in COPD can be informed by novel computational applications.
Identifying disease subgroups and potential disease endotypes using EHR data may help focus therapeutic efforts on COPD exacerbations. The purpose of this study was to determine whether the combination of EHR data and ML in hospitalizations for severe AECOPDs could identify specific subgroups of patients characterized by differences in clinical outcomes.
Methods
Original Cohort Data Source and Study Population
We conducted a retrospective cohort study using data collected from patients hospitalized at Yale-New Haven Hospital between September 30, 2012, after the Epic EHR system (Epic; Verona, Wisconsin) was implemented, and December 31, 2017. The Yale University Human Research Protection Program approved this study and ethical approval was obtained from the Yale Institutional Review Board under a Waiver of Consent. We have previously described this cohort.15 Data were obtained from the Joint Data Analytics Team at Yale University School of Medicine.
COVID Cohort
The Yale Department of Medicine COVID-19 Explorer and Repository tool was used to extract data on patients admitted with COVID-19 from March 1, 2020, to April 1, 2021, in Yale-New Haven Health System hospitals.16 The patients had a positive test for SARS-CoV-2 using reverse transcriptase–polymerase chain reaction assays performed on nasopharyngeal swab specimens within 14 days after admission.
Clustering
To use the unsupervised learning k-means clustering method, we preprocessed the non-COVID-19 data. We identified those features with missing values and removed them to ensure that the training process was unbiased and free of unnecessary noise. This led to a data frame with 1736 observations and 52 features, including the unique identifier. We did not use imputation for the selected features and only used complete data. The numerical features (24) were normalized, while the string features (27) were one hot encoded. We utilized an autoencoding deep learning technique to enhance the efficiency of k-means clustering on datasets by reducing the datasets’ dimensions to 3. Prior to training the k-means clustering model, we employed the NbClust Package in R to determine the optimal number of clusters. Once the number of clusters was identified, we divided the data into 80% for training and 20% for testing purposes.
Classifier
An XGBoost classifier was developed using the multi:softmax objective function to target the subgroup labels obtained from the previous k-means clustering. The same data processing methods were applied, and the data was divided into 80% for training and 20% for testing. A Grid Search was conducted with 5-fold cross-validation to identify the best hyperparameters for the classifier. The trained classifier was then saved and later applied to the COVID-19 cohort. The classifier code is included in the supplementary material in the online supplement.
Statistical Analysis
The R statistical software was used for statistical analyses. Significance was defined as p<0.05 and false discovery rate (FDR) < 0.05. STROBE guidelines for cohort studies were followed in the preparation of this report. Additional methods are described in the supplementary material in the online supplement.
Results
Identification of the COPD Subgroups
To identify subgroups characterized by specific clinical features, we applied k-means, an unsupervised clustering method, to clinical data from 1736 patients admitted to the hospital for a severe AECOPD. We used 51 features to implement this clustering method. The resulting subgroups were characterized by clinical similarities. We identified 3 distinct subgroups in the resulting analysis (Table 1). Across all 3 subgroups, sex and absolute monocyte counts were similar, suggesting that sex or monocytes were not key factors in this classification.
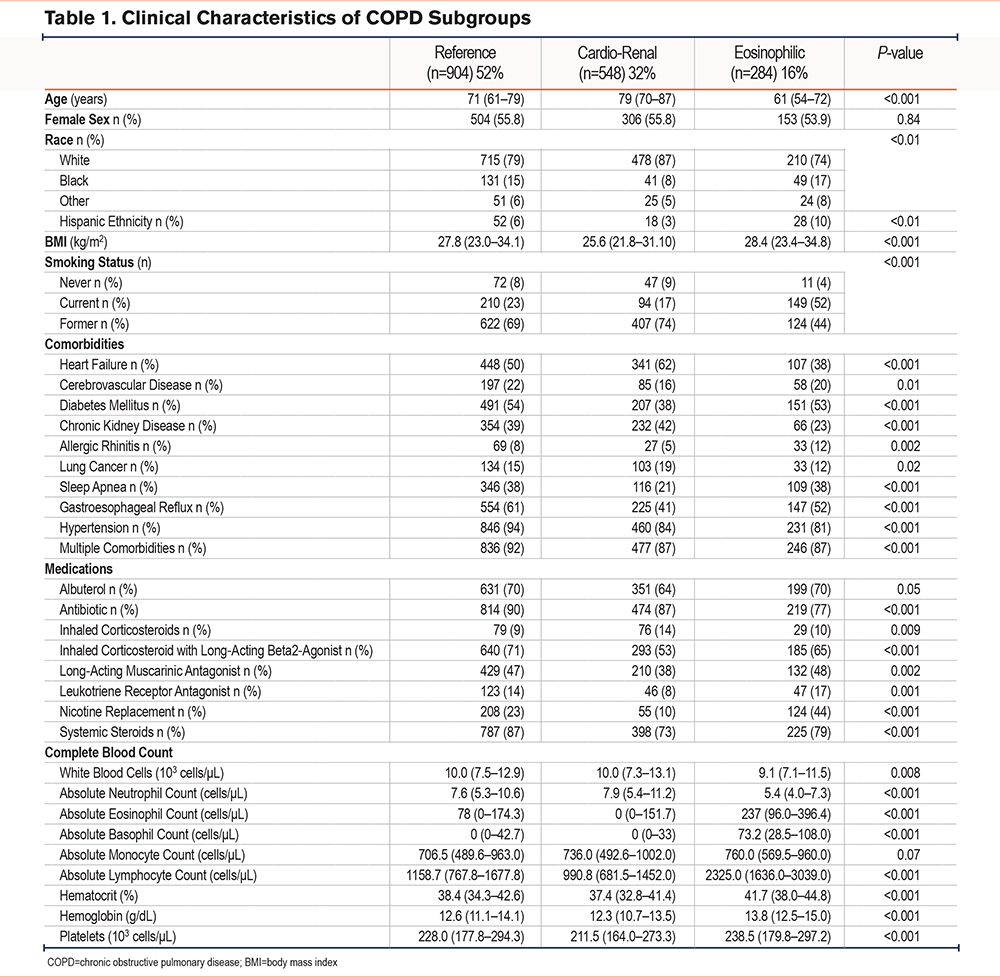
Clinical Characteristics of the Acute Exacerbation of COPD Subgroups
The largest subgroup (n=904, 52%) was mainly composed of former smokers (69%), with the highest rates of comorbid hypertension of all subgroups (94%). Half of these patients were diagnosed with heart failure (50%) or diabetes (54%). This subgroup was also characterized by the highest inpatient administration of inhaled corticosteroid/long-acting beta2-agonist combination (ICS/LABA), antibiotics, and systemic steroids. As the most prevalent subgroup, it will be treated as a reference herein.
The patients in the second largest subgroup (n=548, 32%) were the oldest (77 years [70–87]) and had the lowest body mass index (BMI) of the 3 subgroups (25.6 kg/m2 [21.8–31.1]). This subgroup was notable for the highest rates of heart failure (62%) and chronic kidney disease (42%). This subgroup had the lowest systemic steroid administration rate (73%) and ICS/LABA (53%) of the 3 subgroups but had similar rates of antibiotic use to the reference subgroup (87%). Given the high rates of heart failure and renal failure, this subgroup will be described as cardio-renal hereafter.
The third and smallest subgroup (n=284, 16%) had the youngest patients (61 years [54–72]) and the highest rate of active smokers (52%). Subgroup 3 had the lowest rates of heart failure (38%) and chronic kidney disease (23%), but the highest rates of allergic rhinitis (12%) in the 3 subgroups. This subgroup also had the lowest antibiotic administration rates (77%). Consistent with the high rates of active smoking, subgroup 3 had the highest rate of nicotine replacement during hospitalization (44%).
Subgroups of Acute Exacerbation of COPD Exhibit Distinct Blood Chemistry and Complete Blood Counts
Although blood chemistries were not used to identify the COPD subgroups, we were interested in exploring whether the cardio-renal subgroup also showed abnormal markers of cardiac and renal function. We compared the values of probrain natriuretic peptide (pro-BNP), blood urea nitrogen (BUN), and creatinine values from patients in the 3 subgroups. The cardio-renal subgroup had the highest combined pro-BNP, BUN, and creatinine values of the 3 subgroups (Figure 1A-C).
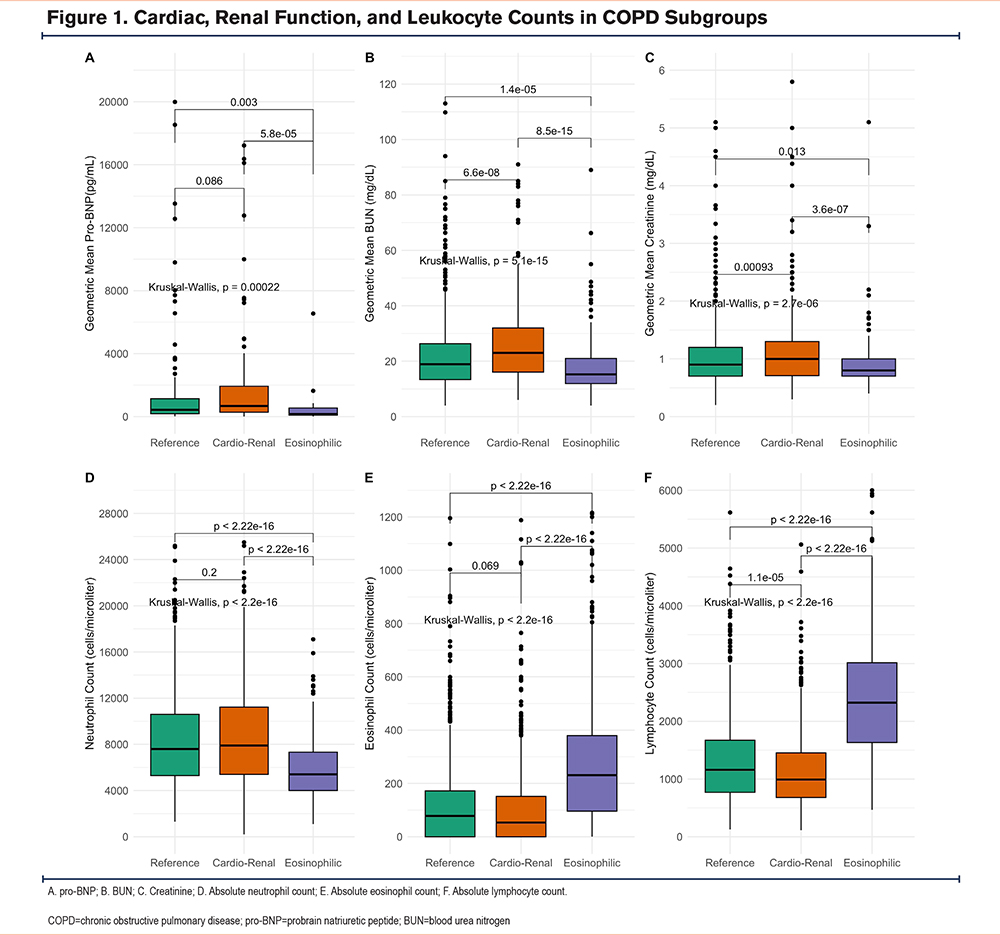
In contrast to blood chemistries, complete blood count values were used to identify COPD subgroups. Consequently, white blood cell, neutrophil, lymphocyte, basophil, and eosinophil counts significantly differed among the subgroups (Table 1). Subgroup 3 was characterized by the lowest neutrophil counts (5400 cells/microliter [4000–7300]), and highest blood lymphocyte (2325 cells/microliter [1637–3,039]) and eosinophil counts (337 cells/microliter [96–396])(Figure 1 D-F). Due to the increasing recognition that eosinophils are a major risk factor for COPD exacerbations,17-19 the identification of a subgroup with higher counts is particularly relevant. Subgroup 3 will be described as eosinophilic hereafter.
COPD Subgroups are Characterized by Specific Disease Outcomes
Given the known associations between specific comorbidity patterns,20 eosinophilic inflammation in COPD exacerbations,17 and exacerbation outcomes, we examined whether the COPD exacerbation subgroups demonstrated any outcome differences. We found no differences in intensive care use or readmissions within 30 days. Consistent with previous observations,17 we found that the eosinophilic subgroup had the shortest stay (5.98 days [2–6])(Table 2). During hospitalization (5%) and in the year following an AECOPD hospitalization (30%), the cardio-renal subgroup had the highest mortality rates.

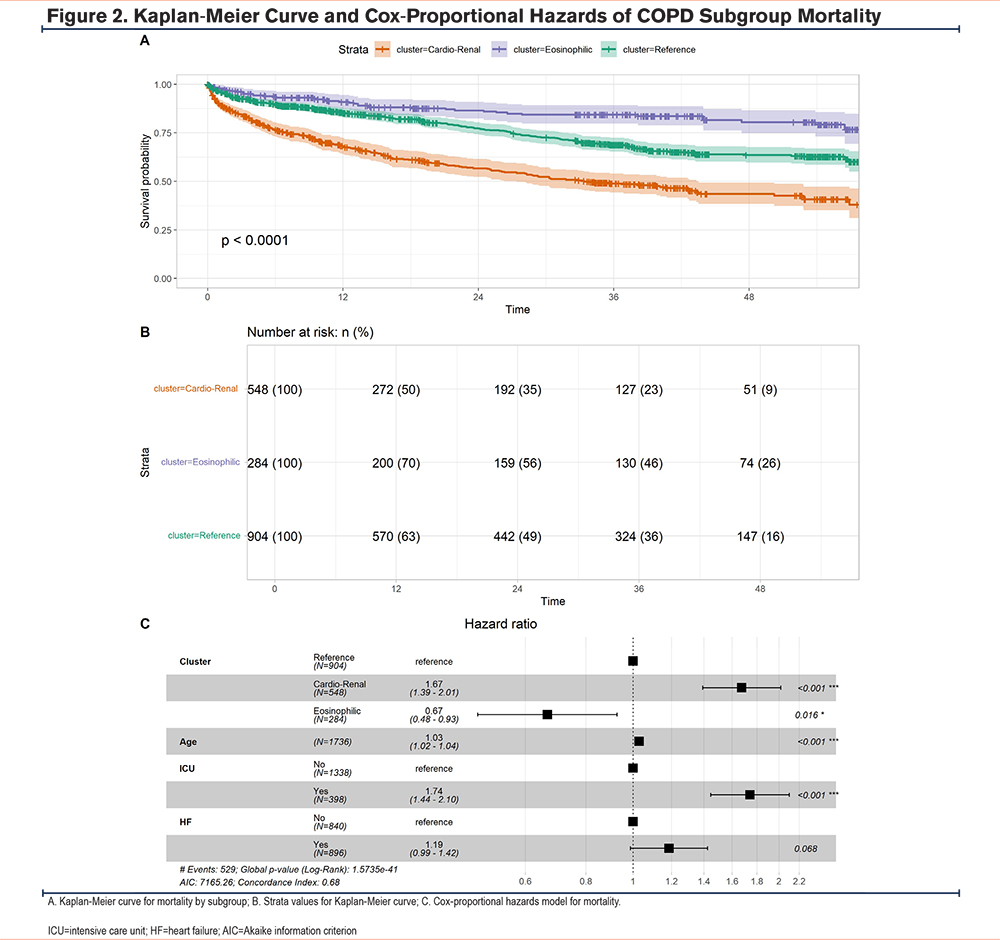
The high mortality rates of the cardio-renal subgroup led us to determine the survival times stratified by subgroups for severe AECOPD following hospitalization. This analysis showed that in contrast to the cardio-renal subgroup, the eosinophilic subgroup had the best median survival times after hospital discharge (Figures 2A and 2B).
To understand the relationship between COPD subgroups and the Rome criteria for severe AECOPDs,21 we identified patients with respiratory acidosis based on arterial blood gas (ABG) testing (pH<7.35 and partial pressure of carbon dioxide>45mm Hg) at any point of their admission (n=65). There were no differences in severe AECOPDs across subgroups (Table 2).
To understand the factors that impact survival time in the COPD exacerbation subgroups, we first performed a univariate Cox regression analysis using subgroup, age, sex, admission to the intensive care unit (ICU), heart failure, and chronic kidney disease given their potential influence on the subgroups and relevant biological input of age and sex. We found that subgroup assignment, age, ICU admission, and heart failure predicted survival time in the univariate analysis (Table 3). Because the hazard ratio distribution of absolute eosinophil counts crossed 1 in the univariate analysis, absolute eosinophil counts were not considered in the multivariate model. The multivariate Cox regression analysis included subgroup, age, admission to the ICU, and heart failure (Figure 2C and Table 3). After controlling for age, admission to the ICU, and heart failure, subgroup categories had a significant impact on survival.

A COVID-19 Cohort of COPD Patients Replicates the Original Subgroups
The triggers for severe AECOPDs that require hospitalization are heterogeneous, and their influence on the clustering of COPD exacerbations is unclear. SARS-CoV-2 infection, the causal agent of COVID-19, is an exceptional trigger for COPD exacerbations and disproportionately affects patients with COPD.22 As a test of the validity of the severe COPD exacerbation subgroups, we implemented a deep learning classifier in a separate cohort of COPD patients in our hospital system admitted with COVID-19.
The 3 original AECOPD subgroups were recapitulated in this COVID-19 AECOPD cohort (n=1646) (Table 4). In the COVID-19 cohort, 68% of the patients were included in the reference subgroup, while 4% were classified as eosinophilic. There were no differences in sex or monocyte counts between subgroups in the COVID-19 cohort, similar to the original cohort. The cardio-renal subgroup in the COVID-19 cohort was the oldest (77 years [68–84]) and had the lowest BMI (27.6kg/m2 [23.2–32.4]). Similarly to the cardio-renal subgroup in the original cohort, the COVID-19 cardio-renal subgroup had the highest prevalence of heart failure (60%) and chronic kidney disease (48%) of all 3 subgroups. The rates of antibiotic administration (75%) and systemic steroids (55%) were highest in this subgroup, in contrast to the original cohort (Table 1). Like the original cohort, the COVID-19 cardio-renal subgroup had the highest serum levels of pro-BNP, BUN, and creatinine (Figures 3A-C). Except for systemic steroids, used in the classifier to identify subgroups, no differences in tocilizumab or remdesivir use were seen across the COVID-19 subgroups (Table 4).
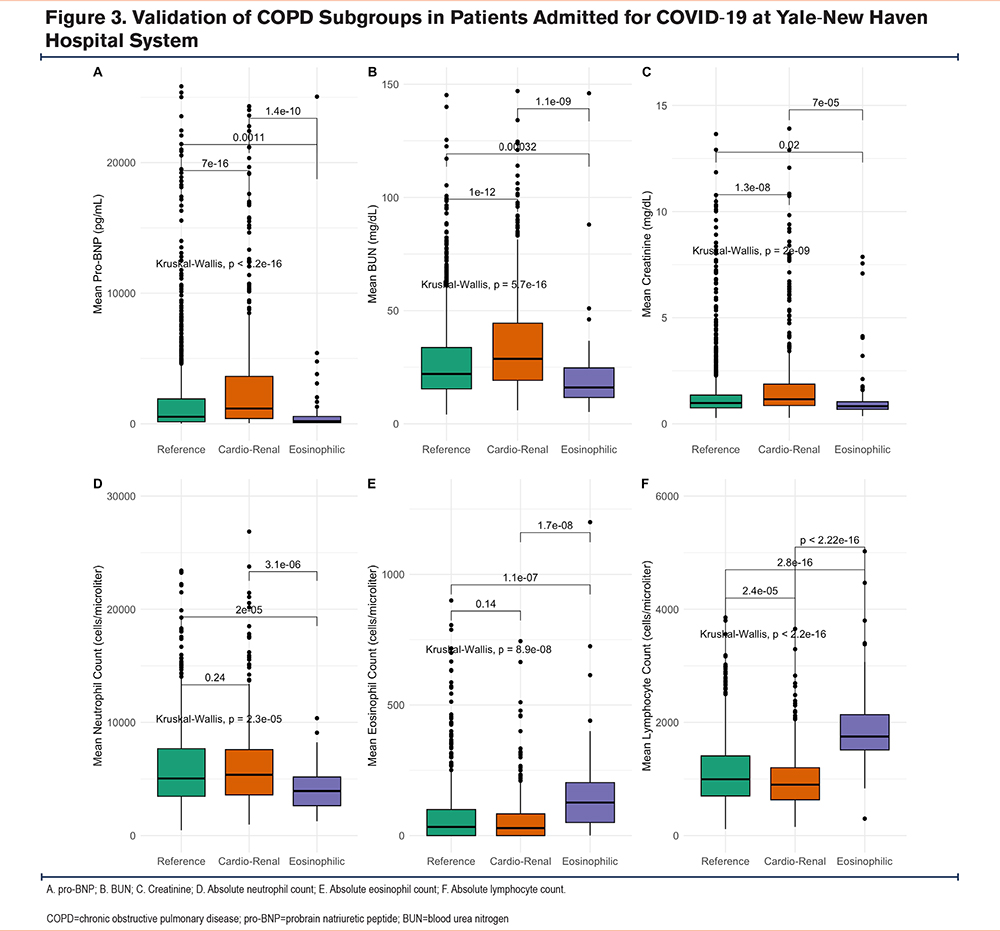
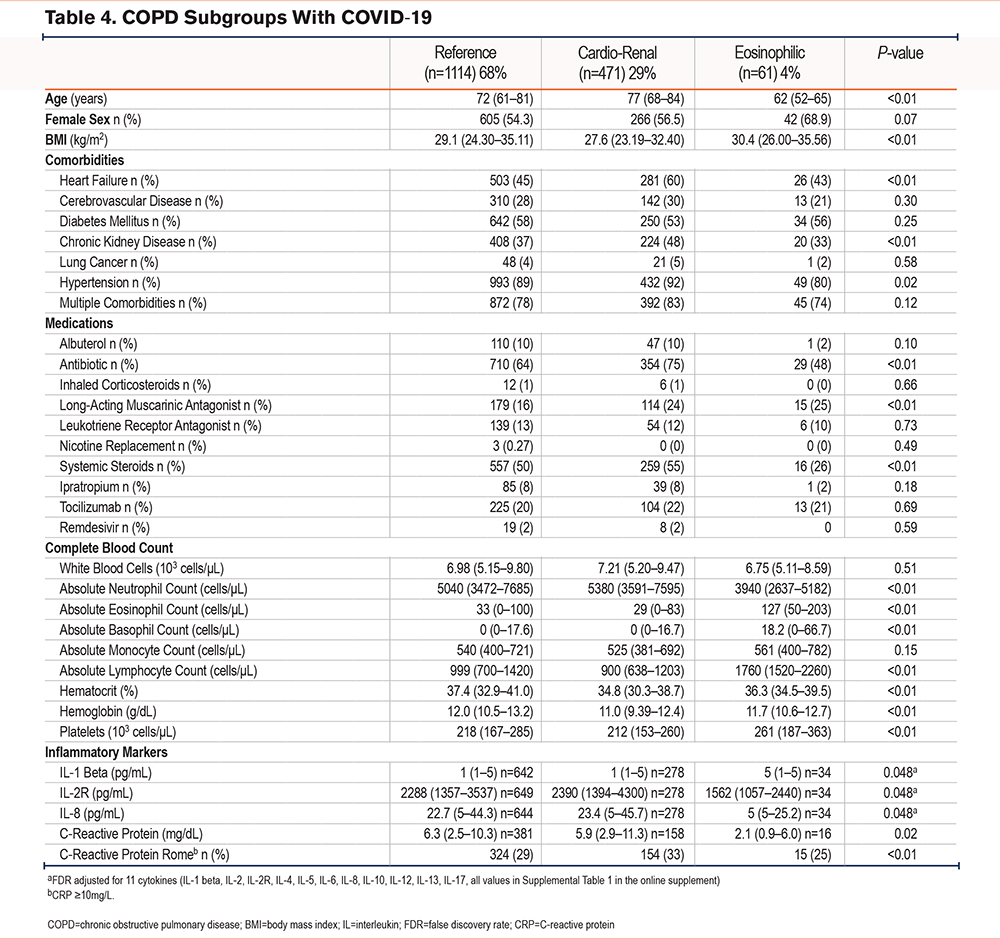
Remarkably, leukocyte counts in the COVID subgroups, also recapitulated the pattern seen in the original cohort, with the highest lymphocyte counts (1760 cells/microliter [1520–2260]) and eosinophil counts (127 cells/microliter [50–203]) in the eosinophilic subgroup. While the cardio-renal subgroup had elevated neutrophil counts (5380 cells/microliter [3591–7595]) and the lowest lymphocyte counts (900 cells/microliter [638–1203]).
Inflammatory Profiles of COVID-19 COPD Subgroups
To determine whether blood leukocyte counts seen in the COVID-19 subgroups were associated with distinct cytokine or inflammatory profiles, we compared the levels of 11 cytokines in the 3 subgroups. Following FDR adjustment, we found that 3 cytokines, interleukin (IL)-1beta, IL-2R, and IL-8, were differentially expressed (Table 4). The eosinophilic subgroup had the highest mean IL-1 beta values (Table 4), in keeping with previous studies describing IL-1beta release by eosinophils23; in contrast, the levels of IL-2R were lowest in the eosinophilic subgroup (Figure 4A).
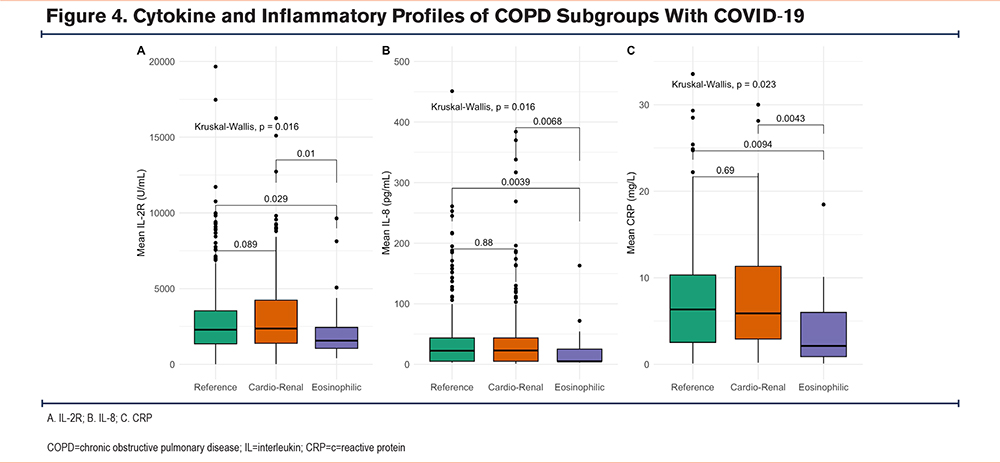
Higher levels of IL-8, a cytokine involved in neutrophil recruitment and activation,24 were associated with higher neutrophil counts in the reference and cardio-renal subgroups, compared to the eosinophilic subgroup (Figure 4B). Serum levels of the type 2 (T2) cytokines, IL-4, IL-5, and IL-13 were similar in the 3 subgroups (Supplementary Table 1 in the online supplement). Furthermore, serum levels of C-reactive protein (CRP) mirrored IL-2R, IL-8, and neutrophil counts in the 3 subgroups (Figure 4C). CRP levels ≥ 10mg/L which were included in the Rome proposal,21 were more common in the reference and cardio-renal subgroups compared to the eosinophilic subgroup (Table 4). This suggests higher levels of inflammation in the COVID-19 reference and cardio-renal subgroups compared to the eosinophilic subgroup.
The Cardio-Renal Subgroup of the COVID-19 Cohort was Characterized by High Mortality
To determine whether associations between outcomes and subgroups were present in the COVID-19 cohort, we examined differences in ICU admission, severe AECOPD by Rome criteria based on their first ABG, 30-day readmission, length of stay, and hospital mortality between COPD subgroups. The rates of admission to the ICU and 30-day readmission were similar to those of the original subgroups (Table 5). Like the original subgroups, we found a shorter length of stay for the eosinophilic subgroup (6.9 days [4.1–12.1]). Although we lacked information beyond the hospitalization for COVID-19, the cardio-renal subgroup showed higher rates of inpatient mortality (26%), comparable to those in the cardio-renal subgroup of the original cohort (30%) within the first year after hospitalization.

Discussion
We found 3 subgroups of severe AECOPDs using ML on EHR data from 3382 hospitalized patients. A total of 2 of the 3 subgroups were characterized by specific comorbidities or leukocyte profiles. First, a cardio-renal subgroup was associated with increased mortality during and after hospitalization for AECOPD. This was followed by an eosinophilic subgroup that had the shortest hospital stay, suggesting a milder pattern of exacerbation. It is notable that the subgroups were evident despite differences between the cohorts, including triggers for hospitalization. In the original cohort, the triggers were not captured by our study design, while the second cohort was restricted to patients hospitalized with COVID-19. Overall, these findings demonstrate that these subgroups are stable and support the use of ML classifiers in EHRs to classify hospitalizations with AECOPDs. Increasing automated recognition of AECOPD subphenotypes in EHRs presents a clinical opportunity to develop precision medicine interventions to improve disease outcomes.
These subgroups are important for their morbidity and mortality, as well as their specific clinical characteristics. The cardio-renal subgroup not only recapitulates what is known about the impact of specific comorbidities on COPD outcomes,8 it also captures other phenotypic traits associated with increased mortality, including a lower BMI.25 The identification of lower lymphocyte counts combined with higher neutrophil counts in this subgroup is also consistent with multiple studies that examined the neutrophil to lymphocyte ratio in AECOPDs as a marker of exacerbation risk and mortality.26 Considering the aging process, the presence of COPD, chronic cardiac and renal disease, and the presence of unique inflammation surrogates in neutrophils and lymphocytes, it is plausible that mechanisms of immunosenescence may be present in this subgroup.27 Recapitulating all these features associated with poor outcomes into a single subgroup strengthens our ability to understand this phenotype and can aid in the identification of AECOPD triggers and therapeutic targets unique to this group of patients.
We identified the eosinophilic subgroup in the original cohort through the integration of comorbidities associated with T2 inflammation and blood counts. Despite the confounding effect of systemic steroid administration on blood eosinophil counts, the ability to identify this subgroup points to the robustness of blood eosinophils as a marker to distinguish this subgroup. This subgroup was also characterized by milder exacerbations characterized by shorter length of stay, consistent with previous studies of AECOPDs requiring hospitalization.17 These differences are likely related to age, among other factors. We speculate that it is possible that this subgroup of exacerbations is more responsive to the administration of systemic steroids. We did not see differences in T2 cytokines in the validation cohort, and this may reflect limited power to identify differences or the influence of concomitant viral infection and COVID therapies. Furthermore, the demonstration of clinical benefit in COPD with increased blood eosinophils after dual blockade of the IL4/IL13 T2 pathway with dupilumab11 confirms this as a distinct endotype based both on molecular mechanism and response to treatment.4
The largest reference cluster had a mix of clinical features and outcomes that fell between the cardio-renal and eosinophilic subgroups. This suggests that there are additional AECOPD phenotypes that are not captured by the current parameters of our analysis. For instance, key differences in the diagnosis of heart failure, including ejection fraction and the mechanisms involved including diastolic and systolic failure, are essential for more accurate classification. Our study was intended as a proof-of-concept for computable subgroups of severe AECOPD, which led to the use of conservative clustering parameters to prevent overclustering of subgroups, which may lead to the identification of very small groups without broad applicability. The results of future studies may identify new subgroups using different parameters.
We recognize the limitations of our model. These include the lack of spirometric values to define COPD, background therapies, and lung imaging patterns in which subgroups were defined. The single hospital system and selected EHR features may contribute to selection bias. The differences between subgroups may also have been driven by specific molecular determinants that EHRs failed to capture. To address some of these limitations, we used strict criteria to define COPD including multiple International Classification of Diseases-Tenth Revision entries, excluding those with dual diagnoses of asthma and COPD, and use of complete, routinely available clinical data rather than imputed values. To make a similar model applicable to other centers, we carefully selected data on inpatient medication administration profiles and structured data when available. Finally, our dataset did not collect all the variables required by the Rome proposal to determine degrees of severity of AECOPDs. We sought to overcome this limitation by focusing on the severe category defined by ABG testing in a subset of patients. It is expected that subsequent iterations of our current approach will refine the role of computable subgroups in COPD classification.
Conclusions
Computable subphenotypes of severe AECOPD identify a cardio-renal subgroup associated with increased mortality. This subgroup includes several known features connected to poor outcomes in COPD. In contrast, a separate eosinophilic subgroup is associated with milder AECOPD requiring hospitalization. ML can be used to improve patient classification using data collected on EHRs and result in new treatment paradigms tailored to specific disease subtypes.
Acknowledgements
Author contributions: HL and JLG contributed to the conception and design, data acquisition, and analysis. All authors contributed to the final article drafting and revision and gave final approval.
Other acknowledgments: The authors wish to acknowledge the assistance and expertise of Richard Hintz and Krishna Daggula at Yale’s Joint Data Analytics Team.
Declaration of Interests
HL and JH have no conflicts of interest related to this work. JZ reports funding from a National Institutes of Health (NIH) training grant (2T32HL007778-26), and personal fees for participation in practice update. SK reports funding from an NIH training grant (2T32HL007778-26). MS reports funding from the NIH/National Heart, Lung, and Blood Institute (NHLBI) (R01 HL155948). JG reports funding from the NIH/NHLBI (R01 HL153604 and R03 HL154275).