Running Head: Predictive Models: Chart vs. Administrative Data
Funding Support: This work was supported by National Institutes of Health grant K24 HL163408 (VP).
Date of Acceptance: December 19, 2024 │Publication Online Date: January 23, 2025
Abbreviations: AECOPD=acute exacerbations of COPD; AHRQ=Agency for Healthcare Research and Quality; AUC=area under the curve; AUROC=area under the receiver operating characteristics; CCS=Clinical Classification Software; CHF=congestive heart failure; CI=confidence interval; COPD=chronic obstructive pulmonary disease; EHR=electronic health record; HRRP=Hospital Readmission Reduction Program; ICD-9-CM=International Classification of Diseases, Ninth Revision, Clinical Modification; ICD-10-CM=International Classification of Diseases, Tenth Revision, Clinical Modification; PPV=positive predictive value; SD=standard deviation
Citation: Chokkara S, Hermsen MG, Bonomo M, et al. Comparison of chart review and administrative data in developing predictive models for readmissions in chronic obstructive pulmonary disease.
Chronic Obstr Pulm Dis. 2025; 12(2): 175-183. doi:
http://doi.org/10.15326/jcopdf.2024.0542
Online Supplemental Material: Read Online Supplemental Material (191KB)
Introduction
Chronic obstructive pulmonary disease (COPD) is a leading cause of mortality and costs the U.S. health care system nearly $50 billion annually.1 Hospital admissions for acute exacerbations of COPD (AECOPDs) drive many of these costs.2 Patients with COPD are frequently readmitted3,4 of which many may be preventable by improving care quality and implementing care transition interventions.5,6 Preventable readmissions are a focus of the Centers for Medicare and Medicaid Services’ Hospital Readmissions Reduction Program (HRRP) which financially penalizes hospitals for excessive 30-day readmissions including for COPD. Despite HRRP galvanizing hospital AECOPD reduction efforts,6-9 more evidence is required on which interventions reduce AECOPD readmissions and how to effectively target interventions to high-risk patients.10-14
One method of reducing preventable AECOPD readmissions is to identify patients with high readmission risk to provide them with targeted readmission prevention interventions. Both general and COPD-specific tools for readmission risk prediction exist.15,16 However, most available prediction tools are derived from datasets using the International Classification of Diseases, Ninth Revision, Clinical Modification (ICD-9-CM), or Tenth Revision, Clinical Modification (ICD-10-CM) billing codes to identify patients with AECOPD.15,17-19 However, billing codes have low sensitivity (12%−25%) for accurately identifying AECOPDs.20 Thus, many patients hospitalized for an AECOPD may not be included in administrative datasets built using ICD codes. It is possible that COPD readmission prediction tools derived from administrative data are limited by the low sensitivity of ICD codes.
To improve the accuracy of identifying admissions for AECOPD, a more rigorous alternative could be to use a manual chart review. Therefore, we aimed to determine if a COPD readmission risk tool derived from a chart-reviewed dataset of patients hospitalized for AECOPD would be more accurate than a previously published 90-day COPD readmission risk tool derived from a large administrative dataset.
Methods
Study Population
Individuals hospitalized at the University of Chicago Medicine from November 7, 2008, to December 31, 2018, who were 18 years or older at admission with 1 or more complete sets of vital signs recorded were eligible from which 5000 patient encounters were randomly selected for manual chart review if patients were aged 40 years or older and either had: (1) a diagnosis code listed under Clinical Classification Software (CCS) category 127, 128, or 131 or (2) the patient had received both nebulizer treatment and oral steroids (>5mg to 100mg prednisone and/or >0mg to 125mg methylprednisolone) during their stay. CCS category 127 includes the following ICD-9-CM codes: 490, 491.0 through 91.22, 491.8, 491.9, 492.0, 492.8, 494, 494.0, 494.1, and 496. CCS category 128 includes the following ICD-9-CM code: 493. CCS category 131 includes the following ICD-9 code: 518. Any encounters originally coded in ICD-10-CM were converted to their ICD-9-CM equivalents to align with the CCS category. We excluded patients who died during the index admission from both the administrative and chart review cohorts to address the competing risk of death and avoid any confounding in the model's prediction of 90-day readmission. The 90-day readmission timeframe was initially selected in our original prediction model study.19 Therefore, to maintain consistency and enable direct comparison between the administrative data cohort and the chart review cohort, we retained this 90-day timeframe in the current study. The University of Chicago Institutional Review Board (IRB#17-0332) approved the study.
Chart Reviews and Data Collection
A retrospective manual chart review was conducted on the 5000 randomly selected patient encounters. Trained personnel (MH, MB) used a standardized extraction guide to assess encounters. The primary purpose of admission was evaluated to determine the likelihood that hospitalization was due to an AECOPD using a 5-point Likert scale: definitely not, unlikely, possibly, probably, or definitely. Scores were assigned based on patients’ primary and secondary diagnoses at admission and the medications administered. To ensure consistency among reviewers, Cohen’s Kappa statistic was calculated to assess inter-reviewer reliability across 30 charts reviewed by both extractors (MH, MB). Clinical data for encounters rated as “probably” or “definitely” AECOPD, were extracted from the University of Chicago Clinical Data Warehouse including the last recorded vital signs and labs prior to discharge and medications, among others. Patient comorbidity burden was assessed using the Agency for Healthcare Research and Quality Elixhauser Comorbidity Index.21
Model Derivation and Validation
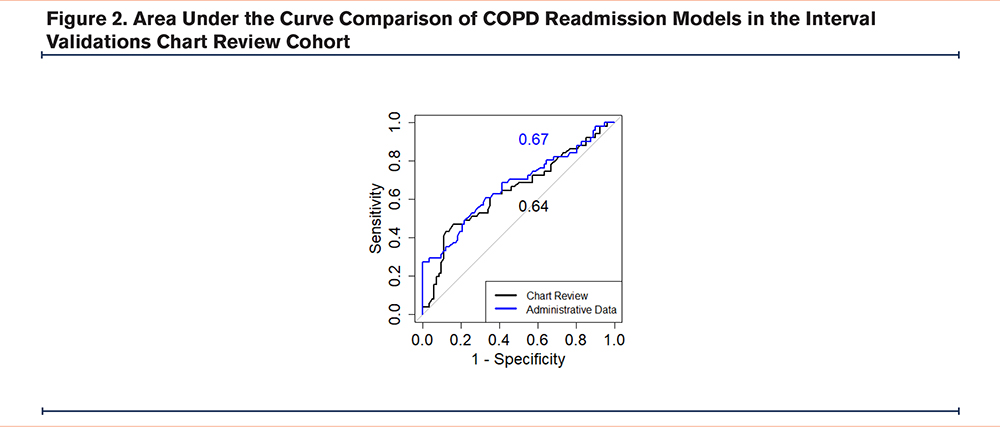
The data were randomly partitioned into training and internal validation sets using a 70%/30% split. A random forest model, a machine learning algorithm that builds an ensemble of decision trees and merges them for more accurate and stable prediction,22 was used to predict all-cause readmission within 90 days of an index AECOPD admission from the chart-reviewed population. Because tree-based machine learning models tend to have decreased accuracy with highly imbalanced data (e.g., when there are significantly more non-readmission than readmission cases), we matched each readmitted patient to a randomly selected non-readmitted patient to create a balanced dataset for model derivation. This 50/50 split helps ensure the model can equally prioritize both outcomes and improve its sensitivity in detecting readmissions. Model predictors included demographic information, length of stay, comorbidities, vitals, and lab results, validated in a previously published paper for an administrative data model19 (Appendix Table 1 in the online supplement). Our analysis revealed missing data for several numeric predictors, including particularly high rates for blood gas measurements (Appendix Table 2 in the online supplement). Because our tree-based machine learning model required a complete dataset for training and prediction, we implemented a median imputation process. For any missing numeric predictor, including blood gases, we calculated the median discharge value across all eligible COPD encounters and imputed this value for encounters with missing data. In the validation dataset, we evaluated the performance of 2 distinct random forest models. One model had been previously developed using administrative data for predicting readmissions after COPD admissions. Our previously published machine learning algorithm reported an area under the receiver operating characteristic (AUROC) curve of 0.69, which compared favorably to other readmission prediction tools.15,17,18,21 This administrative data-derived model and the model developed from chart review data were both assessed on the chart review-based validation dataset to compare their predictive accuracies. The DeLong test was used to compare the performances of the chart review model with the administrative data model when assessed on the same test set of COPD patients identified through chart review.23 Model calibration was assessed using c-statistic and Brier score.
Results
Patient Population
Of the 4327 eligible patient encounters that were manually chart reviewed, 448 were determined to be patients with a true index admission for AECOPD (12%) (Figure 1). Of the first 30 charts reviewed by both reviewers, there was agreement that an encounter should be included for 29 of 30 charts. This resulted in a 2-category Kappa of 0.889. Most of the patients were female (63%) and identified as Black (88%). The mean age for the patients was 63 years, and the patients had a median length of stay of 5 days. The mean Elixhauser Comorbidity Index in our chart review cohort was 11. In our chart review cohort, 39% (174) of the patients experienced 90-day readmission. There were no significant differences in race (readmission: 89% Black versus no readmission: 87% Black, p=0.4) or mean age (readmission: 62 years versus no readmission: 64 years, p=0.1) between patients who experienced 90-day readmission and those who did not. Patients who experienced readmission had a significantly higher Elixhauser Comorbidity Index (readmission: 13 versus no readmission: 10, p=0.03) (Table 1).
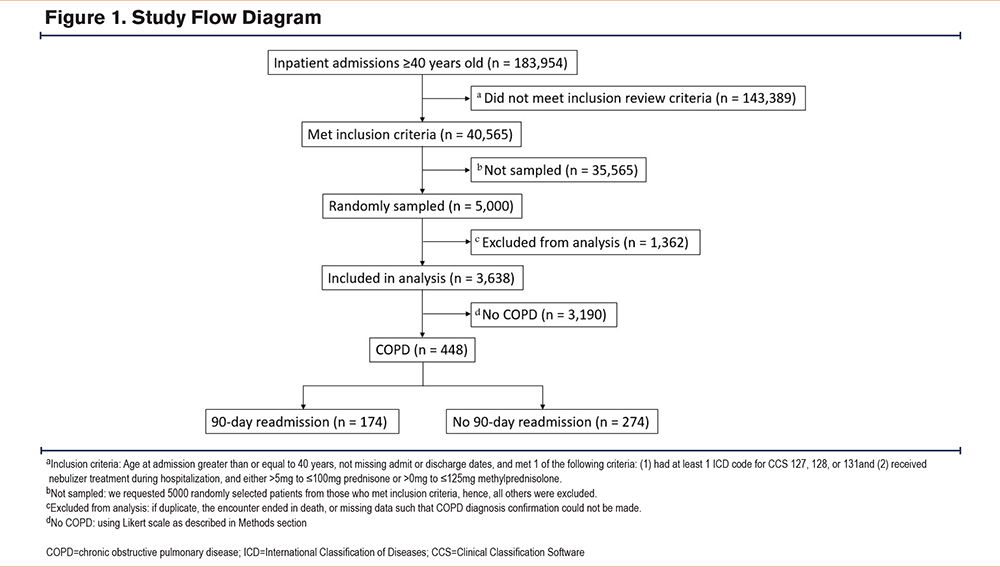
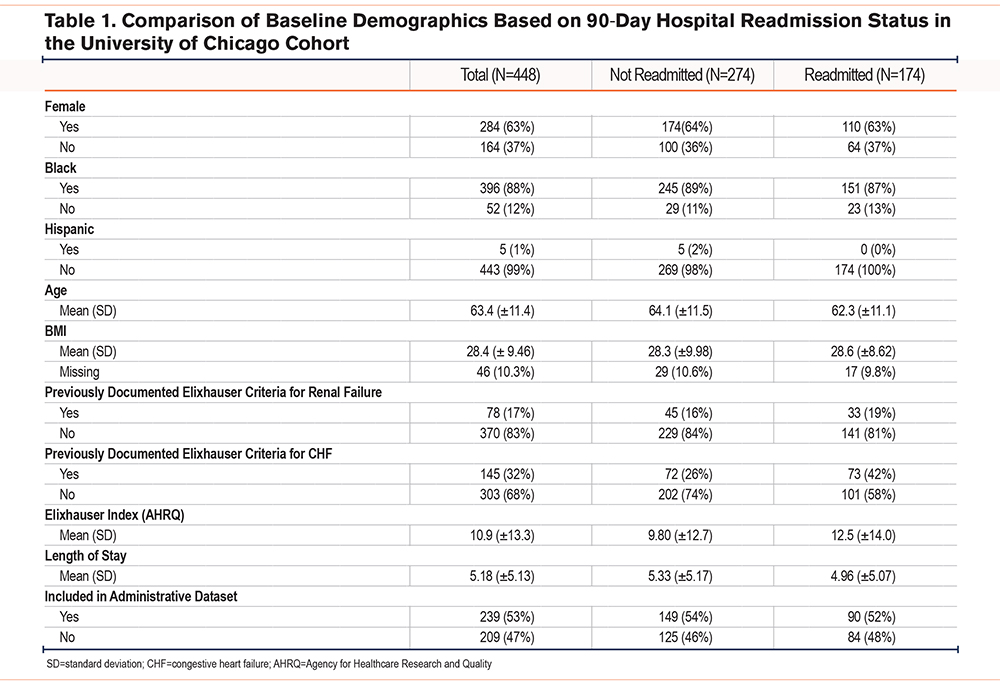
Chart Review Versus Administrative Data Readmission Prediction Model
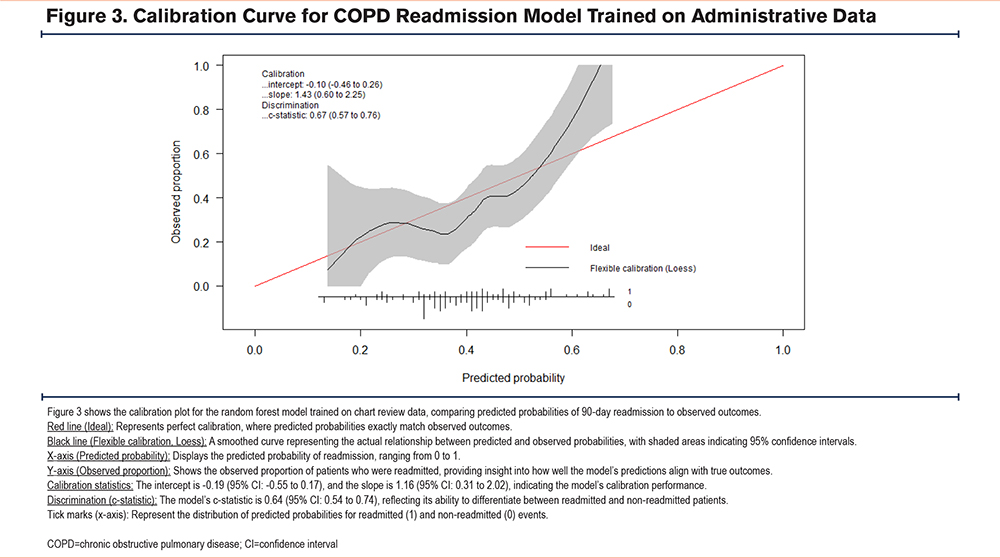
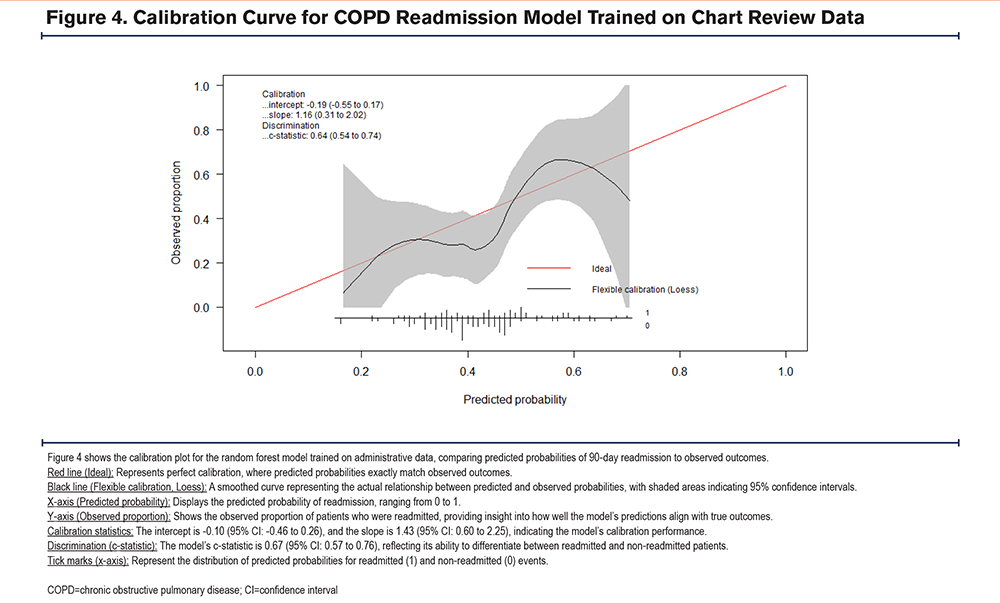
The random forest model trained using administrative data performed comparably to the model trained on chart review identified patients (administrative data AUC =0.67 (95% confidence interval [CI]: 0.57–0.77), chart review AUC =0.64 (95% CI: 0.54–0.75); p=0.7) (Figure 2). The area under the precision-recall curve for the administrative data model was 0.64, while for the chart review model, it was 0.54 in the internal validation cohort. At 93% specificity, the model trained on administrative data demonstrated a sensitivity and positive predictive value (PPV) of 29% and 79% respectively. In contrast, the model trained on chart review data showed a sensitivity and PPV of 16% and 62% respectively. Both models show some degree of miscalibration, with the administrative model performing slightly better in terms of discrimination (higher c-statistic). However, both models exhibit calibration issues, particularly in the higher predicted probability ranges, with the chart review model showing more significant calibration problems in midrange probabilities. The Brier scores for the administrative data and chart review models are 0.21 and 0.22, respectively, indicating that the administrative data model has slightly better calibration and more accurate probabilistic predictions overall compared to the chart review model (Figure 3, Figure 4).
Conclusion
Our analysis demonstrated that using chart review data to identify patients with COPD readmissions was not superior to using administrative data when identifying and training readmission prediction tools for patients with COPD. While the models based on both administrative and chart review data demonstrated moderate performance, with AUC values below the optimal threshold for clinical prediction tools, they still provided valuable insights into readmission risk. Despite the limitations of administrative billing codes in accurately identifying causes of hospital admissions/readmissions, our analysis suggests that billing codes may be sufficient for developing tools to predict future readmission risk for patients with COPD. Given the labor-intensive nature of chart review, our study provides evidence supporting the use of billing codes to develop readmission prediction tools from large administrative databases.
A key limitation of this study is the possibility of missed readmissions if patients were admitted to another health system outside of our dataset. This may have resulted in underreporting of readmission events, potentially impacting the model’s predictive accuracy. Another important limitation of our study is that patients who died after discharge but before a potential readmission were coded as not readmitted, without accounting for death as a competing risk. However, this approach aligns with how readmissions are typically counted in real-world data analyses and hospital penalty programs. Additionally, this study includes restriction of variables used in model development to those acquirable in both administrative and chart-reviewed datasets. While this approach allowed for a simple comparison of readmission prediction models trained on the same variables, it limited the use of other information available in the electronic health record (EHR) that may not have been extractable from administrative data. This includes pulmonary function tests often reported in documents (not discrete data), disease onset, and smoking status, among other potentially relevant clinical data. The absence of these variables, particularly smoking status which is known to be associated with COPD outcomes, may limit our model's accuracy and generalizability. Additionally, the exclusion of social determinants of health —such as socioeconomic status, access to health care, and housing stability—may further limit the predictive power of the model, as these factors are known to influence COPD readmission risk.
The use of this additional data when manually chart reviewing the EHR may allow for the inclusion of clinical data that is more predictive of future readmission. Additionally, there may be synergistic benefits in identifying patients with a high risk of future readmission when combining clinical data from chart review with administrative data that was not observed in our study due to our methodology.24 One additional limitation of our study was the small outcome sample size for the 2 models, which is something that future work with expanded datasets may seek to address. Furthermore, some patients were present in both the training cohort for the model derived using administrative data and the testing cohort in the current study. While the random selection process for chart review helps mitigate bias, this overlap may have influenced model performance comparisons. This limitation highlights the need for external validation in future studies to further assess the generalizability of our findings. Lastly, a significant limitation of our study is its single-center design, which included a patient population that was not diverse as it is predominantly Black (88%) and has a low representation of Hispanic patients (1%). This demographic profile does not reflect the broader population of individuals with COPD in the United States. However, it is important to note that many models do not adequately include heterogeneous populations, such that individuals who identify as Black are often under-represented in predictive models.25 Future multisite studies with representative patient populations are needed to improve the generalizability of our findings.
In conclusion, despite the limitations of administrative data when identifying patients admitted with AECOPD, the use of chart reviews to refine the accuracy of patient identification did not lead to improvements in the accuracy of our AECOPD readmission prediction model over a model trained using administrative data.
Acknowledgements
Author contributions: JCR, LRV, VGP, MGH, MJH, SK, MB, MC, and KAC were responsible for the study concept and design and acquisition of the data. Analysis and interpretation of data were provided by MGH, MJH, SK, MB, KAC, JCR, and MMC. MB, MGH, MJH, SK, SC, and JCR provided a first draft of the manuscript. All authors were responsible for critical revision of the manuscript for important intellectual content. Statistical analysis was provided by KAC, MB, MGH, MJH, SK, SC, and JCR. VGP obtained funding. JCR and VGP provided administrative, technical, and material support and study supervision. SC, KAC, JCR, and VGP had full access to all the data in the study and take responsibility for the integrity of the data and the accuracy of the data analysis. All authors approved the final version of the manuscript for publication.
Declaration of Interests
VGP was supported by a National Institutes of Health (NIH) K24 grant (HL163408) and reports also receiving additional grant funding from the NIH (R01HL146644) and the Agency for Healthcare Research and Quality (R01AS027804). VGP also reports receiving consultation fees from Humana. MMC reports receiving funding from the NIH (National Heart, Lung, and Blood Institute R01-HL157262). He also receives royalties from the University of Chicago for a patent ((#11,410,777) on eCART, which is an in-hospital deterioration risk score. All other authors have no conflicts or funding to report.