Running Head: Proposal of MCID Lung Density in AATD
Funding support: This study was funded by an investigator-initiated, noncommercial grant from Grifols Biotherapeutics.
Date of Acceptance: January 6, 2025 │ Publication Online Date: February 11, 2025
Abbreviations: AATD=alpha-1 antitrypsin deficiency; CI=confidence interval; COPD=chronic obstructive pulmonary disease; CT=computed tomography; FEV1=forced expiratory volume in 1 second; HR=hazard ratio; KCO=carbon monoxide transfer coefficient; MCID=minimum clinically important difference; MDD=minimal detectable difference; PD15=15th percentile lung density; PRO=patient-reported outcome; RCT=randomized controlled trial; SD=standard deviation; SEM=standard error of the mean; SGRQ=St George’s Respiratory Questionnaire
Citation: Ho ESY, Ellis PR, Kavanagh D, Subramanian D, Stockley RA, Turner AM. Proposal and validation of the minimum clinically important difference in emphysema progression. Chronic Obstr Pulm Dis. 2025; 12(2): 109-116. doi: http://doi.org/10.15326/jcopdf.2024.0511
Online Supplemental Material: Read Online Supplemental Material (329KB)
Introduction
Alpha-1 antitrypsin deficiency (AATD) is the only widely recognized genetic risk factor for emphysema.1 Enhancing AAT levels using plasma-derived protein (augmentation therapy) has, therefore, been the standard of care in some countries for many years.2,3 Meta-analysis of randomized controlled trial (RCT) data.4 and a single adequately powered RCT,5 have suggested a consistent benefit on emphysema progression, as defined by quantitative computed tomography (CT) lung densitometry. However, these data remain controversial with drug regulators and clinicians due to the debate on the clinical impact of densitometry changes as the primary outcome measure.
Quantitation of emphysema based on lung density has become a widely used technique in research over the last 20 years. A systematic review has shown that lung density relates to conventional measures of disease severity and outcomes in nondeficient COPD6 and AATD, describing lung density measured by CT as being the best predictor of subsequent survival.7 It is a repeatable,8-10 specific, and highly sensitive measure of emphysema progression. These attributes make it a suitable outcome for drug trials targeting the pathophysiology of emphysema. However, unlike many other measures used in COPD trials, such as forced expiratory volume in 1 second (FEV1) or quality of life, there is not an established minimum clinically important difference (MCID). An accepted MCID could provide better clarity in understanding the impact of quantitative CT imaging of emphysema progression, as well as facilitating power calculations for experimental trial design and its interpretation.
An MCID is defined as “the smallest change in an outcome that a patient would identify as important.”11 It represents a move away from simply being a statistically significant difference in one outcome and instead towards a threshold beyond which patients would notice a benefit. There are 2 recognized methods for proposing an MCID, namely the “anchor” and the “distribution” methods. The anchor method uses an established MCID from a recognized clinical parameter and plots the change of the known anchor against the change in the parameter being explored. For example, if lung density is correlated with FEV1 in the same patient cohort, then the density difference equivalent to the MCID of FEV1 (100mls) can be determined by interpolation. The value obtained would be an appropriate MCID for CT densitometry.12 The distribution method has multiple variations but measures the standard deviation (SD) to determine a threshold that exceeds the margin of measurement error.11 For this reason, the distribution method may also be more correctly regarded as the minimal detectable difference (MDD).
This study was designed to identify a range of potential MCID values for absolute and annual lung density decline in AATD using the anchor method and distribution method. Using AATD cohort data, the MCID values were validated against lung function, health status, and mortality.
Methods
Determination of Minimum Clinically Important Difference Using the Anchor Method
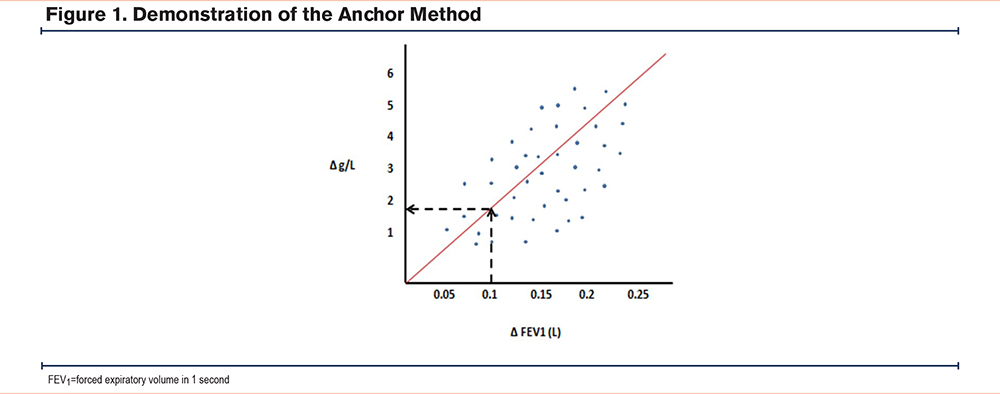
Only one published study13 contained lung density data anchored against FEV1. This was achieved by correlating lung density with FEV1 change. However, the data was presented as a pooled group of placebo and augmentation-treated patients whose disease progression was different. This meant that the effect of augmentation had to be considered in the anchoring process. The placebo and treatment arms from the pooled data were anchored to the change in CT density and the change in FEV1 on both axes, generating a linear regression plot (Figure 1). This slope between time-bound metrics, ∆density and ∆FEV1, was reported as approximately 8.5. By then solving simultaneous equations, the intercept of the placebo and treatment arms would be 6.8 and 10.2 respectively. By inputting the new slope and using 2 known values of x and y into the linear regression equation y=a+bx it was possible to calculate the intercept, and thus, the MCID and its 95% confidence intervals (CIs).
Determination of Minimal Detectable Difference Using Distribution Method
Using our prior systematic review studies in AATD,4 the mean and SD of CT lung density (as measured by the PD15 g/L-1) at baseline and with subsequent annual change were selected. Two statistical methods were used to determine the MDD based on the data obtained at baseline and for the lung density decline/year: standard error of the mean (SEM) and 0.5×SD. Given this is a baseline change, the proposed MDD will be an absolute value rather than an annual change. Similarly, where we have used the annual change in SD, this MDD represents a proposed value for annual lung density decline.
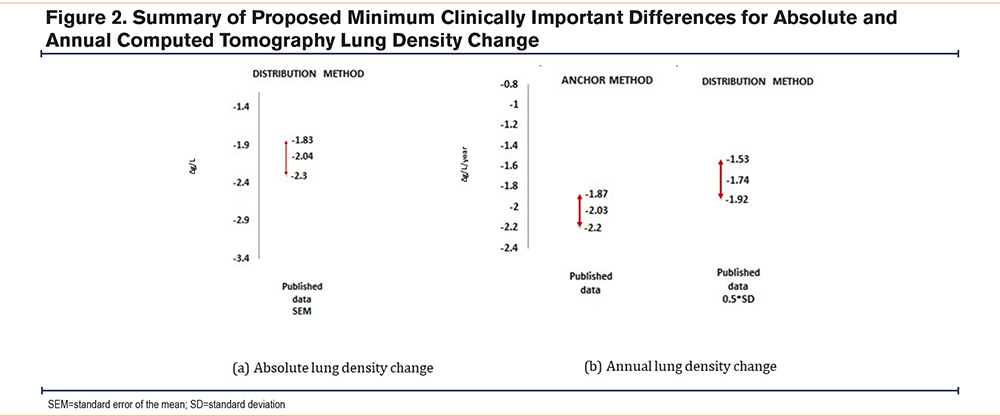
As CT lung density is known to be the most sensitive measure of emphysema progression,14 rather than moderate or large effects, we selected the adjustment for small effects only and calculated 95% CIs for the estimates of MDD. The potential MCID derived by anchoring13 was plotted on a graph alongside the MDD values generated by the distribution method to illustrate the degree of agreement between techniques (Figure 2).
Validation by Comparing Characteristics and Survival of Patients by Minimum Clinically Important Difference or Minimal Detectable Difference
Annual Lung Density Decline
AATD patients were selected from a cohort in Birmingham, United Kingdom who had taken part in either an observational study or in the placebo arm of an RCT.7,13 Only patients who had ≥2 CT scans performed using a smooth reconstruction algorithm (B30f), slice thickness 5mm, and an increment of 2.5mm were selected. CT images were analyzed by PULMO software to derive the 15th percentile density (PD15) as the lung density. The density decline was calculated by comparing the first and last CT scans. This group has been reported previously.7 After obtaining the range of proposed MCID values obtained from the decline distributions (range shown in Figure 2), comparative analyses were conducted by comparing patients with lung density decline above or below the proposed MCID. Rate of death and disease progression as determined by FEV1, gas transfer, or health status decline (St George’s Respiratory Questionnaire [SGRQ]) were compared between groups. Exploratory analyses were also conducted using the full range of plausible MCID and their 95% CI, as determined by the methods above. Data normality was explored prior to the comparison of groups, and appropriate parametric or nonparametric tests were selected; statistical analysis was carried out using SPSS® 29.0 (IBM; Armonk, New York) and statistical significance was assumed at p<0.05. Multivariable regressions were then carried out, adjusting for age and baseline density, as in our prior work.7 Two-tailed tests were used throughout, since the RAPID study showed some patients whose density increased during follow-up, though this was less common than decline.
Absolute Lung Density Change
All patients in a separate, multicenter British study of physiology and lung density were included in this analysis.15 We examined cross-sectional data only for absolute lung density decline; here we used the mean density and then compared patients with baseline density above the median versus median minus the proposed MDD (or more), this being -2.04g/L (range shown in Figure 1) for lung function and quality of life at baseline. Univariate statistics were used for all comparisons.
Results
Anchor Method
Published AATD data provided enough information to correlate FEV1 and CT lung density change over time13 and by solving equations for anchoring, this generated an MCID of -2.03g/L/year (range -1.87 to -2.20).
Distribution Method
Three studies5,13,16 reported the baseline and annual change in CT lung density in placebo arms (Table 1).
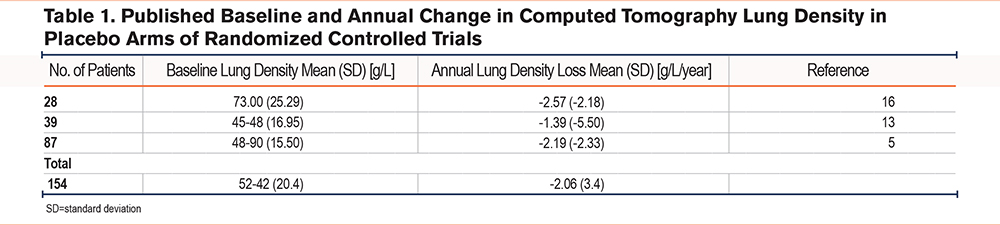
Using the baseline lung density SD and the 2 methods of calculating MCID, the generated values (95% CI) are as follows: SEM= -2.04g/L and 0.5×SD=10.2g/L. When assessing the annual density decline, the values were: SEM -0.34g/L/year and 0.5×SD 1.74g/L/year.
The proposed MCID and ranges are shown in Figure 2.
Validation Against Longitudinal Outcomes
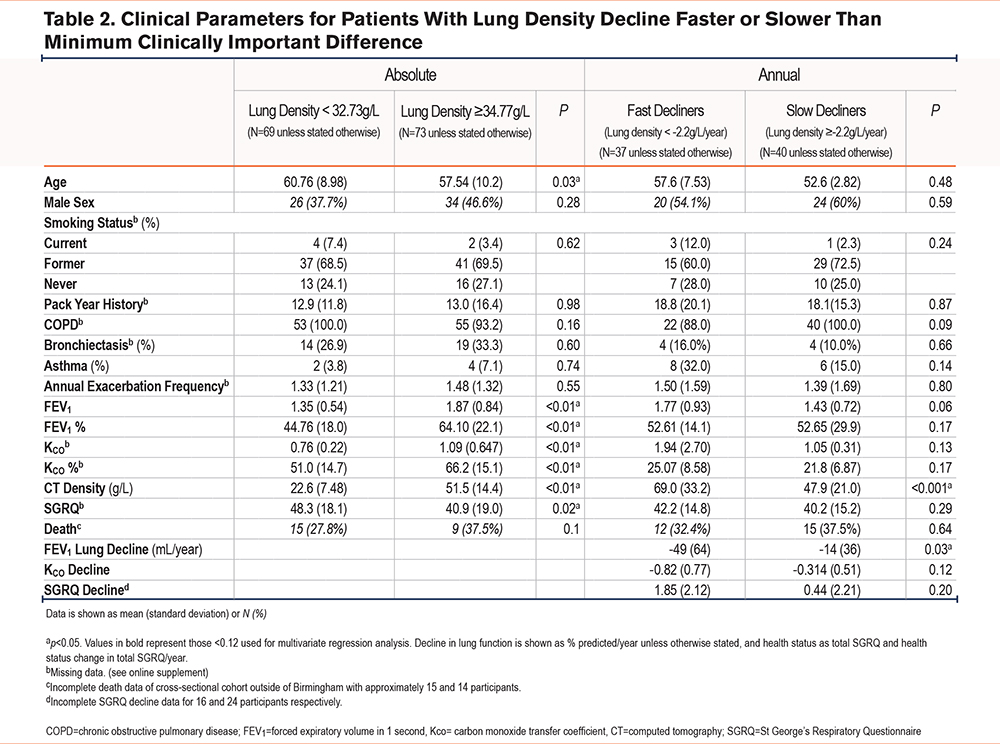
There was cross-sectional data available for 147 AATD patients, and longitudinal data for 77 AATD patients, as reported previously.7,15 Table 2 shows the baseline characteristics of these patients, stratified by absolute and annual decline in CT lung density for cross-sectional and longitudinal cohorts, respectively.
Comparative Analyses
The cross-sectional dataset compared groups with patients with above median lung density (34.77g/L) with patients with a median minus the MDD of -2.04, this being 32.73g/L. In comparative analyses of the longitudinal cohort, the lowest value of the proposed MCID range of the annual CT lung density decline, -2.2g/L/year, demonstrated the greatest differences between groups in lung function measures. Comparative analyses were carried out on all values of MCID, but these did not show significant differences. See the online supplement for comparisons of data at the middle MCID threshold.
Table 2 shows comparisons of outcomes with patients on either side of the proposed absolute and annual change of lung density MCID thresholds, comparing baseline characteristics, mortality rate, and subsequent decline in lung function and health status. This demonstrates that patients with an absolute lung density worse than the proposed MCID have significantly poorer lung function parameters but comparatively similar health status. Those with lung density decline in excess of the proposed MCID, i.e., the fast decliners, exhibited a statistically significant lower baseline CT lung density and greater FEV1 decline.
Survival Analyses
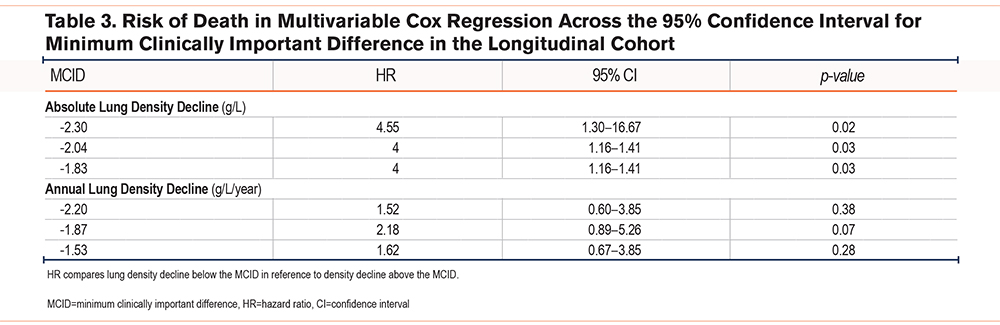
The longitudinal cohort data was used for multivariable Cox regression analyses. The hazard ratios (HR) and 95% CI for death were compared in patients whose decline was below the tested MCID with patients whose decline was above the tested MCID. Baseline covariables were included and adjusted for in the multivariate analysis: age, lung density, FEV1 percentage predicted, and SGRQ. The follow-up period was on average 11.8 years.
Table 3 shows the HR for death in patients with a lower density decline than the listed value, relative to those with a higher density decline. This was statistically significant for absolute decline MCID values only. No significant differences were shown in the risk of death when comparing fast decliners versus slow decliners divided by the annual MCID.
Discussion
Our study demonstrated a plausible MCID for absolute lung density decline of 2.04g/L, on the basis that this value lies within a range that is detectable (MDD; distribution method) in independent groups. Our study is strengthened using a systematic literature review as well as validating in highly characterized AATD cohorts. These results will be important for powering trial design in emphysema, specifically AATD.
Conceptually we felt it was important to generate MCID based not only on the distribution of measures in a population at baseline but also on lung density change over time. The measures at baseline reflect a person’s past disease progression, in that they must have deteriorated from a healthy state to a lower density, however, this does not necessarily reflect subsequent progression, particularly in cases with precipitating factors such as smoking. We have shown this previously in the Birmingham cohort, in which decline in lung function differs according to smoking status.17 Consequently, the distribution of density change may differ from the distribution of baseline density, such that detectable differences in each will also differ. Furthermore, a change in absolute lung density is different from the rate of density decline when it comes to designing clinical trials and interpreting the effects of treatment. Augmentation therapy appears to alter the rate of decline over time5 and powering on an absolute lung density difference equivalent to MCID could give different results and durations compared to lung density change per year. As more targeted therapies for emphysema are developed, trials may well involve focused populations equally difficult to recruit as those in AATD studies, thus, efficient designs might aim for a shorter duration of treatment – to do this an MCID in g/L/year is more desirable than an overall lung density change.
An alternative method to ensure that an MCID is valid would be to test the MCID for a relationship to other outcomes important to patients or generally accepted as clinically relevant. For this reason, we also tested the relationship between absolute and annual change MCID estimates against FEV1, carbon monoxide coefficient (KCO), and SGRQ decline. The FEV1 decline did relate to annual lung density change, but there was no significant relationship to KCO and SGRQ, which likely reflects a combination of sensitivity and small cohort size. The greatest difference between groups was identified when comparing the cohort at the MCID of 2.2g/L/year decline - the upper limit of the MCID annual decline range generated from the anchor method. This potentially suggests this patient cohort represents the rapid end of AATD progression. The KCO was generally greater in the cross-sectional group compared with the longitudinal group and interestingly, in the cross-sectional dataset, a greater KCO was found in the group with a lower lung density. This suggests possibly another factor that may be affecting the KCO other than density such as the disparity in the cohort of patients and/or the equipment used. When assessing mortality, the midrange and 95% CI of our proposed absolute lung density MCID all related significantly to death, with greater lung loss conferring to a higher likelihood of death, although annual density change alone did not relate to mortality.
A true MCID should reflect important issues for the patient, so ideally, we should also have anchored against health status in published literature, although this was not possible (no correlations between SGRQ and density published in RCTs). While we would have been able to do this in this AATD cohort, we felt it was not appropriate to generate an estimate based on anchoring to SGRQ as this data is only from one (probably unique) population. Hence, we limited our anchoring strategy to FEV1. Various studies in COPD and AATD have related FEV1 and SGRQ, and while correlations exist, they are not always strong; a systematic review quoted an r-value between FEV1 and SGRQ of -0.46, though the relationship seemed to strengthen where an increase in FEV1 was associated with improvement in SGRQ.18 It is also debatable whether SGRQ is the most appropriate patient-reported outcome (PRO) to use in an AATD population for anchoring as it was generated for use initially in nondeficient COPD and a PRO developed in an AATD population (which is generally younger) might differ. Having a disease-specific PRO was recognized as a patient priority by the European Respiratory Society working group for AATD.19
We recognize the small cohort size and the low cases of mortality may generate a skewed picture and, therefore, limits the lung densitometry MCID as a sound validation tool. Further, work using a larger sample size and including patients with a range of AATD progression would provide stronger validation. An additional limitation is that the underlying cohorts used to derive the MCIDs do not contain complete data on potentially relevant factors such as smoking status, smoking history, exacerbation history, comorbidities, or socioeconomic status. The lack of these data makes generalization of our MCID to other cohorts unclear. Data on the type of CT scanner and study site, which may also have influenced the results, were not available.
Since our analyses have encompassed both MCID (anchor method) and MDD (distribution method), it is also important to bear in mind why MDD was developed. As MDD identifies a difference that surpasses the instrumental noise, essentially there is greater confidence that the change is not affected by random variability. In most cases, this was so that trials could be designed around MDD for a measure that would actively improve after a therapeutic intervention (e.g., an increase in FEV1 in asthma following bronchodilator therapy). Whether the distribution method is appropriate for baseline measures that improve with therapy rather than dynamic and time-dependant parameters, such as emphysema progression, is debatable, and thus supports the approach of using a time-bound MCID (i.e., our annual change MCID rather than an absolute value in g/L). This will be more relevant for therapies that reduce progression as opposed to reversing a degenerative process rather than for regenerative processes for emphysema in the future.
Since finding a radiographic MDD is of great interest (and has the potential to serve as a surrogate endpoint for clinical interventions), examining a meaningful absolute MDD could also be explored in cohorts with longitudinal data from clinical trials, looking at absolute decline as the primary predictor, though we were unable to execute this in our cohort.
Interpretation
In conclusion, initial evidence suggests an MCID in absolute CT lung density decline of -2.04g/L, and a possible MCID in annual CT lung density decline of -1.87g/L/year in AATD. This demonstrates promise for the use of radiographical MDD and encourages further work to validate our proposal exploring cohort data with absolute and annual lung density decline.
Acknowledgements
Author contributions: EH and PE are cofirst authors. AT is responsible for the conception and design of the project, obtaining funds, and supervising the project. DK acquired the data. DS supervised radiological analyses. DK, PE, and EH contributed to data analysis and writing the article. RS was responsible for obtaining funds and conception of the project. All authors contributed to the review of the article and approval for the publication of the final version.
The authors would like to thank all the staff and patients involved at the contributing sites for the National Institute for Health and Care Research study from which cross-sectional data was obtained, namely Southampton, Leicester, Nottingham, Royal Free, Brompton, and Cambridge hospitals. We also thank Dr. B. Stoel (Leiden) for access to CT scan analysis software in the studies that preceded this work.
Declaration of Interests
EH, DC, and DK declare no conflicts of interest. AT reports financial support was provided by Grifols Inc. AT also reports a relationship with CSL Behring that includes: consulting or advisory, funding grants, and speaking and lecture fees. In addition, she reports honoraria or grants outside this work from GSK, AZ, and Chiesi. RS reports financial support from CSL Behring for investigator funding. PE reports honoraria and consulting fees from GSK, Chiesi, AstraZeneca, and Takeda. All authors declare no conflicts of interest in relation to the present study.