Running Head: Clinical Significance of Reduced FEV3/FEV6
Funding Support: This work was supported by the Foundation of Guangzhou National Laboratory (No. SRPG22-016 and SRPG22-018), the Clinical and Epidemiological Research Project of State Key Laboratory of Respiratory Disease (No. SKLRD-L-202402), the Plan on Enhancing Scientific Research in Guangzhou Medical University (No. GMUCR2024-01012), and the Zhongnanshan Medical Foundation of Guangdong Province (No. ZNSXS-20250019).
Date of Acceptance: March 3,2026 | Published Online Date: March 31, 2026
Abbreviations: BMI=body mass index; BSA=body surface area; CI=confidence interval; COPD=chronic obstructive pulmonary disease; FEV1=forced expiratory volume in 1 second; FEV1 %pred=FEV1 percentage predicted; FEV3=forced expiratory volume in 3 seconds; FEV6=forced expiratory volume in 6 seconds; FVC=forced vital capacity; HR=hazard ratio; LLN=lower limit of normal; NCHS=National Centers for Health Statistics; NHANES=National Health and Nutrition Examination Survey; OR=odds ratio; PIR=poverty-to-income ratio; RCS=restricted cubic spline; SAD=small airway dysfunction; SPIROMICS=SubPopulation and InteRmediate Outcome Measures In COPD Study
Citation: Liao S, Liang J, Ou J, et al. Clinical significance of a reduced forced expiratory volume in 3 seconds to forced expiratory volume in 6 seconds ratio in adults. Chronic Obstr Pulm Dis. 2026; 13(3): 195-205. doi: http://doi.org/10.15326/jcopdf.2025.0649
Online Supplemental Material: Read Online Supplemental Material (665KB)
Introduction
Spirometry is an essential diagnostic tool for identifying obstructive lung disease and monitoring its progression. However, traditional spirometry such as forced expiratory volume in 1 second (FEV1) mainly reflects large airway obstruction and lacks the sensitivity to detect small airway abnormalities in the early stage of chronic airway disease.1-3 Therefore, a spirometry indicator that could accurately reflect early small airway abnormalities is needed.
The forced expiratory volume in 3 seconds (FEV3) to forced expiratory volume in 6 seconds (FEV6) ratio (FEV3/FEV6) is a routinely available and repeatable spirometry index that can detect early airway abnormalities.4,5 A national cross-sectional study conducted in China revealed that the overall predicted prevalence of small airway dysfunction (SAD) was 52.4% using an FEV3/FEV6 ratio less than the lower limit of normal (LLN) as the diagnostic indicator.6 FEV3/FEV6 <LLN in individuals with a normal FEV1 to forced vital capacity (FVC) ratio is significantly associated with impaired computed tomography measurements, shorter 6-minute walking distance, increased dyspnea, and lower quality of life, suggesting that FEV3/FEV6 reflects mild pulmonary structural, functional, and clinical abnormalities.7 The SubPopulation and InteRmediate Outcome Measures In COPD Study (SPIROMICS) study of current and former smokers without chronic obstructive pulmonary disease (COPD) found that an FEV3/FEV6 <LLN was associated with an increased risk of severe respiratory exacerbations and a shorter time to first exacerbation, and these patients were more likely to progress to COPD.5 The UK Biobank Study, which used FEV3/FEV6 <LLN to define SAD, indicated that participants with SAD are at an increased risk of all-cause, cardiovascular, respiratory, and neoplasm mortality.8However, the clinical utility of FEV3/FEV6 in the general population remains limited, particularly its potential nonlinear relationship with all-cause mortality and long-term prognosis require further investigations.
In this study, we aimed to explore the clinical characteristics and long-term prognosis of participants with an FEV3/FEV6 <LLN based on the general population analyzed in the National Health and Nutrition Examination Survey (NHANES). We also aimed to explore whether participants with reduced FEV3/FEV6 had an elevated risk of all-cause death, both overall and after subgroup stratification. This study also sought to explore the potential nonlinear relationship between FEV3/FEV6 and all-cause mortality.
Methods
Study Population
We conducted a secondary analysis of data from the NHANES, a nationally representative study conducted by the Centers for Disease Control and Prevention and the National Centers for Health Statistics (NCHS) in the United States. The NHANES uses a rigorous stratified, multistage probability sampling design to ensure representativeness. The NCHS Research Ethics Review Board approved the NHANES protocols, and written informed consent was obtained from all participants. Data were sourced from the NHANES website.9
This study included 50,492 participants from the NHANES database, encompassing 2 time periods with available spirometry data: 1988–1994 and 2007–2012. The exclusion criteria were: (1) age <20 years, (2) missing spirometry data, (3) spirometry data of unacceptable quality, (4) pregnancy, (5) incomplete physical data, and (6) missing data on smoking status. Of the eligible participants, those with missing mortality data or without FEV3/FEV6 data were further excluded.
Spirometry Testing
The postbronchodilator spirometry data were absent for the majority of participants enrolled in the NHANES cycles 1988–1994 and 2007–2012, whereas prebronchodilator spirometry data were more comprehensive. Therefore, we used prebronchodilator spirometry data. Prebronchodilator spirometry was conducted using Ohio 822/827 dry-rolling volume seal spirometers. For the 1988–1994 cycle, reproducible FEV1 and FVC measurements from ≥2 acceptable trials were required, whereas the 2007–2012 period mandated quality scores of grade B or higher according to the American Thoracic Society standards.10,11
In this study, an FEV3/FEV6 <LLN was defined as reduced FEV3/FEV6. The LLN for prebronchodilator FEV3/FEV6 was calculated according to the linear iterative equation redefined by Hansen et al using age, sex, and ethnicity.4 Owing to limited sample sizes and difficulty in classification, the study by Hansen et al lacked linear iterative equations for other races (including other Hispanics, Asians, and Native Americans). Consequently, we referred to the SPIROMICS cohort study and used the reference equation for the Latin population (Mexican-American) to calculate the LLN of FEV3/FEV6 for the other races included in the dataset.5
Mortality Ascertainment
The study outcome was all-cause mortality (death from any cause). The National Death Index death certificate records provided by the NCHS provided mortality data, with follow-up through December 31, 2019.
Assessment of Covariates
Standardized in-home interviews captured demographic, socioeconomic, health condition, and behavioral data, while mobile examination centers with quality-controlled procedures obtained physical measurements and laboratory test results. Body mass index (BMI) was calculated as weight in kilograms divided by height in meters squared and grouped into 4 categories: underweight (<18.5kg/m2), normal (≥18.5kg/m2 to <25kg/m2), overweight (≥25.0kg/m2 to <30.0kg/m2), and obese (≥30.0kg/m2). The following formula12 was used to calculate body surface area (BSA): BSA (m2) = (body weight [kg])0.425 × (height [cm])0.725 × 0.007184. Race was categorized as non-Hispanic White, non-Hispanic Black, Mexican-American, or other race. The level of education of adults aged ≥20 years was categorized as less than 9th grade, 9th–12th grade, or above 12th grade. Poverty-to-income ratio (PIR) was grouped into low-income (<1.3), middle-income (1.3 to <3.5), and high-income (≥3.5). Smoking status was classified based on self-reported questionnaire responses into 3 categories: never smoker (<100 cigarettes in the entire lifetime), former smoker (≥100 cigarettes but current cessation), and current smoker (≥100 cigarettes with persistent smoking). Data on the presence of comorbidities (congestive heart failure, stroke, asthma, chronic bronchitis, emphysema, cancer, diabetes mellitus, and hypertension) were obtained through a questionnaire in which participants were asked to indicate whether they had ever been informed by a medical practitioner or other health professional that they had been diagnosed with a specific disease. Chronic cough and chronic phlegm were defined as daily coughing or sputum persisting for ≥3 consecutive months per year. Wheezing was defined by audible whistling or wheezing from the chest within the past year. Shortness of breath was defined as an occurrence of awakening caused by trouble breathing or shortness of breath other than when they had a cold.
Statistical Analysis
Continuous variables are presented as the mean ± standard deviation, while categorical variables are expressed as frequency (percentage). Baseline characteristics were compared using the independent-samples t-test for continuous variables and Pearson’s Chi-square test for categorical variables. Logistic regression models adjusted for age, sex, race, BMI, and smoking status were employed to assess the relationship between chronic respiratory symptoms and comorbidities and reduced FEV3/FEV6. Five Cox regression models were constructed to evaluate the association between all-cause mortality and reduced FEV3/FEV6. The crude model was unadjusted, while Model 1 was adjusted for age, sex, BSA, race, and BMI. Model 2 was additionally adjusted for smoking status, PIR, and level of education. Model 3 was additionally adjusted for comorbidities, including congestive heart failure, stroke, asthma, chronic bronchitis, emphysema, cancer, diabetes, and hypertension. Model 4 was adjusted for all previously mentioned covariates, plus FEV1 percentage predicted (FEV1 %pred).
Based on the crude Cox regression model and Model 3, we performed subgroup analyses to assess the association between reduced FEV3/FEV6 and all-cause mortality in different subgroups stratified by sex, age, BMI, race, and smoking status. We included FEV3/FEV6 and subgroup variables as interaction terms in the model analyses to test for potential interaction effects. To investigate whether there was a nonlinear relationship between the ratio of FEV3/FEV6 to LLN and all-cause mortality, we used restricted cubic spline (RCS) analysis with 5 knots in both the univariable model (crude model) and multivariable model (Model 3) using the “plotRCS” package of R software.13,14
Sensitivity analyses were performed to confirm the validity of our findings: (1) participants with an FVC<80% of the predicted value were excluded; (2) age was used as a categorial variable (20–40, 41–60, 61–80); (3) comorbidity including congestive heart failure, asthma, chronic bronchitis, and emphysema were used as a categorial variable; (4) the relationship between FEV3/FEV6as a stand-alone variable and all-cause mortality was examined; and (5) age was used as the time axis in survival analyses.15 Statistical significance was set at P <0.05 (2-tailed). All analyses used R, version 4.3.2, and SPSS, version 27.0.
Results
Participants’ Baseline Characteristics
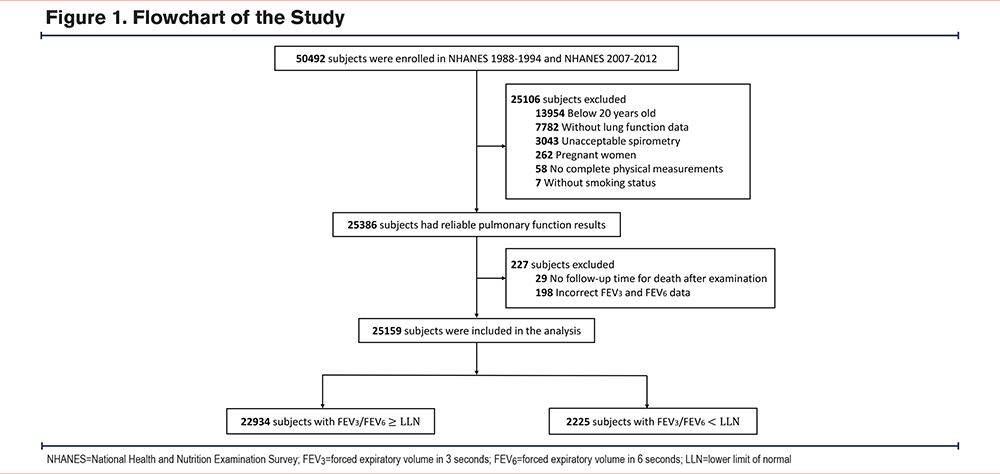
Overall, 50,492 participants were enrolled in the NHANES cycles 1988–1994 and 2007–2012. Participants aged <20 years (n=13,954), without spirometry data (n=7782), with unacceptable spirometry (n=3043), with pregnancy (n=262), without complete physical measurements (n=58), and without data on smoking status (n=7) were excluded. Of the remaining 25,386 participants, 227 were excluded owing to missing follow-up time for death (n=29) or incorrect FEV3 or FEV6data (n=198). Finally, 25,159 participants were enrolled, among whom 8.8% (2225/25,159) exhibited reduced FEV3/FEV6 (Figure 1).
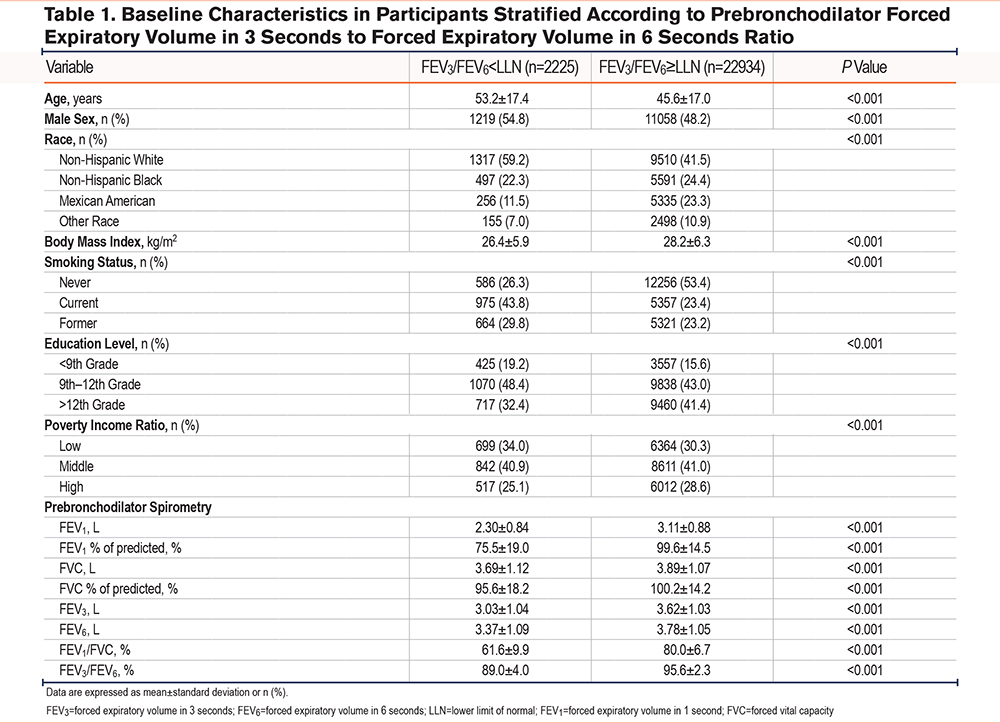
The baseline characteristics of the normal FEV3/FEV6 and reduced FEV3/FEV6 groups are presented in Table 1. The mean age of the participants in the reduced FEV3/FEV6 group was 53.2±17.4 years, and 54.8% were male. Compared with the normal FEV3/FEV6group, the majority of participants with reduced FEV3/FEV6were non-Hispanic White (59.2%), current smokers (43.8%), and had a lower level of education and a lower PIR. The reduced FEV3/FEV6 group also had significantly lower prebronchodilator FEV1, FVC, FEV1 %pred, and FVC percentage predicted values.
Risk of Chronic Respiratory Symptoms and Comorbidities
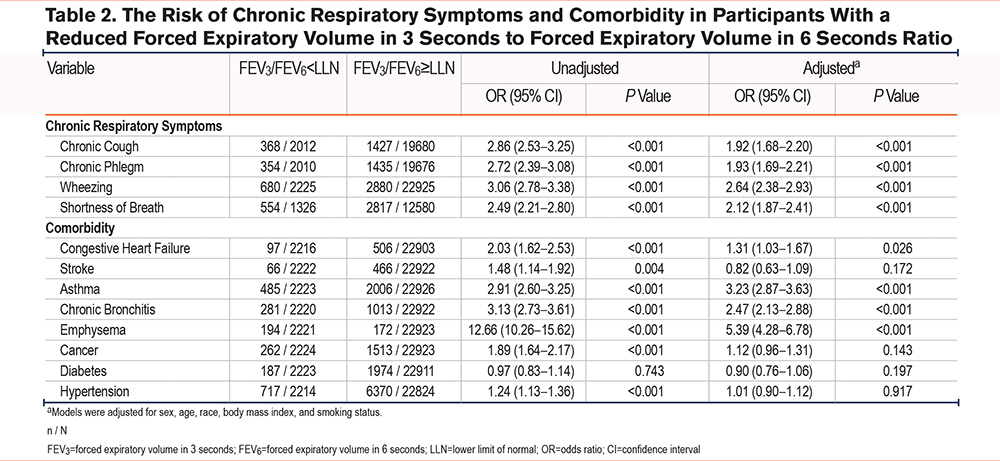
Table 2 shows the association between reduced FEV3/FEV6 and chronic respiratory symptoms and comorbidities. The reduced FEV3/FEV6 group had a higher risk of a self-reported diagnosis of congestive heart failure (adjusted odds ratio [OR] 1.31, 95% confidence interval [CI] 1.03–1.67, P=0.026), asthma (adjusted OR 3.23, 95% CI 2.87–3.63, P<0.001), chronic bronchitis (adjusted OR 2.47, 95% CI 2.13–2.88, P<0.001), and emphysema (adjusted OR 5.39, 95% CI 4.28–6.78, P<0.001). Meanwhile, the reduced FEV3/FEV6 group was significantly more likely to suffer from chronic respiratory symptoms, including chronic cough (adjusted OR 1.92, 95% CI 1.68–2.20, P<0.001), chronic phlegm (adjusted OR 1.93, 95% CI 1.69–2.21, P<0.001), wheezing (adjusted OR 2.64, 95% CI 2.38–2.93, P<0.001), and shortness of breath (adjusted OR 2.12, 95% CI 1.87–2.41, P<0.001) than the normal FEV3/FEV6 group.
Association of Reduced Forced Expiratory Volume in 3 Seconds to Forced Expiratory Volume in 6 Seconds With All-Cause Mortality
During the median follow-up period of 308 months, 6393 participants (25.4%) died, of which 45.3% (1008/2225) had reduced FEV3/FEV6 and 23.0% (5285/22,934) had normal FEV3/FEV6. The all-cause mortality risk curves in the normal and reduced FEV3/FEV6 groups are shown in Figure 2. The analyses demonstrated that participants in the reduced FEV3/FEV6 group exhibited significantly higher all-cause mortality than those in the normal FEV3/FEV6 group (log-rank P<0.001).
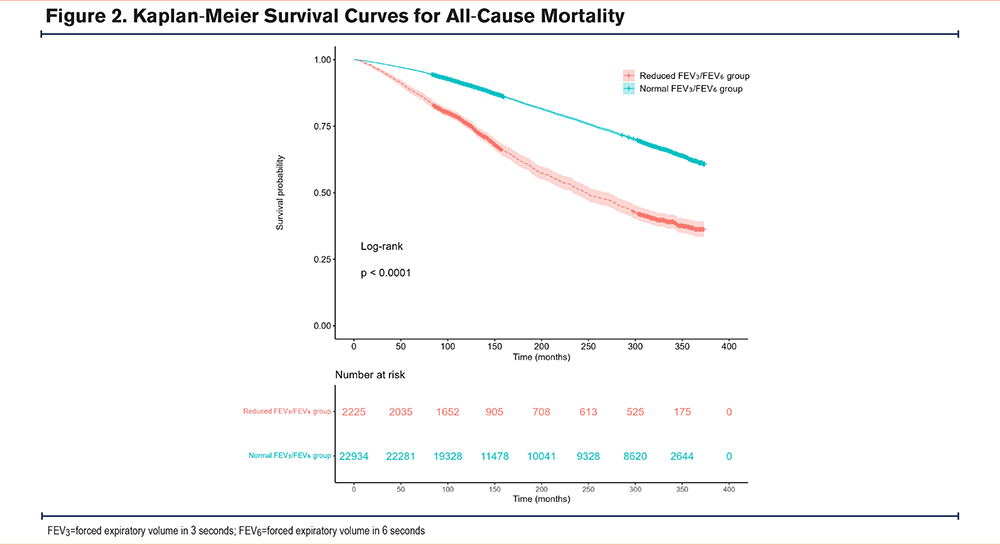
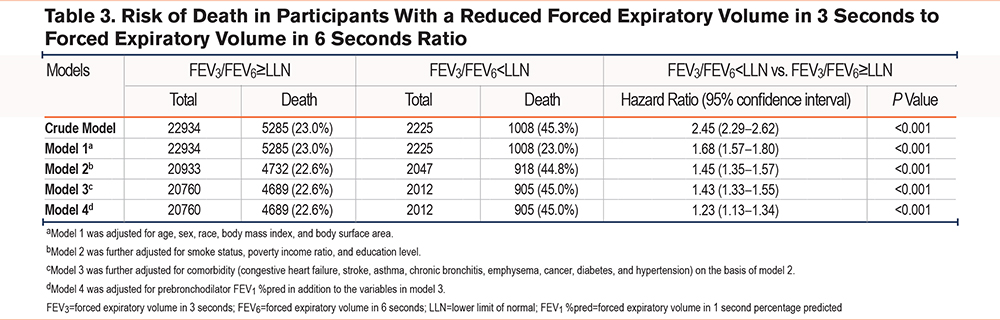
Table 3 shows the 5 Cox regression models. Compared with the normal FEV3/FEV6 group, the reduced FEV3/FEV6 group exhibited a significantly increased risk of all-cause mortality in the crude model (hazard ratio [HR] 2.45, 95% CI 2.29–2.62, P<0.001). The reduced FEV3/FEV6 group still exhibited an increased risk of all-cause mortality in the multivariable analysis controlled for sociodemographic factors (Model 1: HR 1.68, 95% CI 1.57–1.80, P<0.001). The association between reduced FEV3/FEV6 and all-cause mortality was not attenuated by adjustment for smoking status, PIR, and level of education (Model 2: HR 1.45, 95% CI 1.35–1.57, P<0.001). Further adjustment for comorbidities (Model 3: HR 1.43, 95% CI 1.33–1.55, P<0.001) and FEV1 %pred only slightly weakened the association (Model 4: HR 1.23, 95% CI 1.13–1.34, P<0.001).
Subgroup Analyses
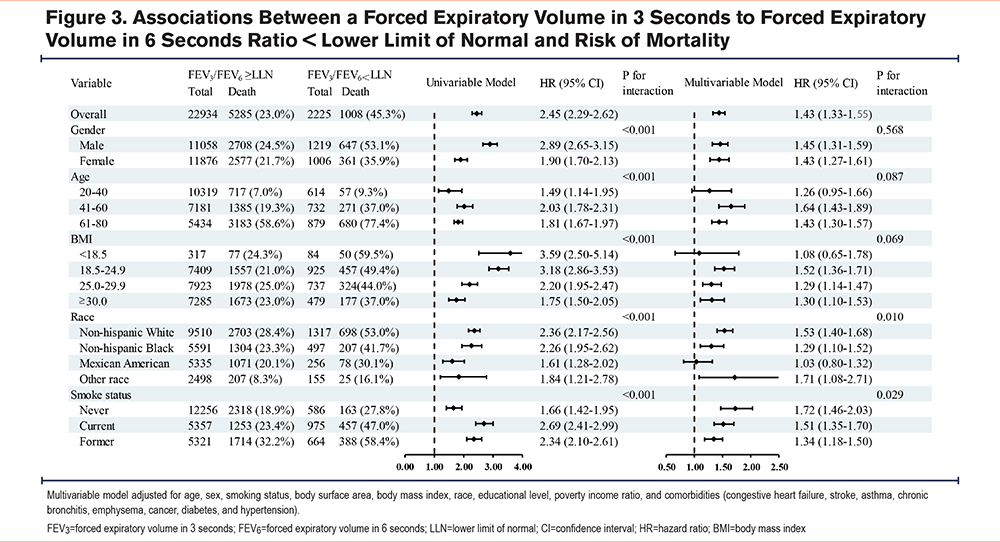
As demonstrated in Figure 3, subgroup analyses were performed to evaluate the association between FEV3/FEV6 and all-cause mortality according to sex, age, BMI, race, and smoking status. In the univariable model, reduced FEV3/FEV6 was associated with higher all-cause mortality in all subgroups, revealing significant interactions between FEV3/FEV6 and each subgroup. In the multivariable model adjusted for sex, age, BSA, BMI, race, smoking status, level of education, PIR, congestive heart failure, stroke, asthma, chronic bronchitis, emphysema, cancer, diabetes, and hypertension, significant interactions were observed between FEV3/FEV6 and race and smoking status only.
Nonlinear Relationship Between the Ratio of Forced Expiratory Volume in 3 Seconds to Forced Expiratory Volume in 6 seconds to Lower Limit of Normal and Mortality
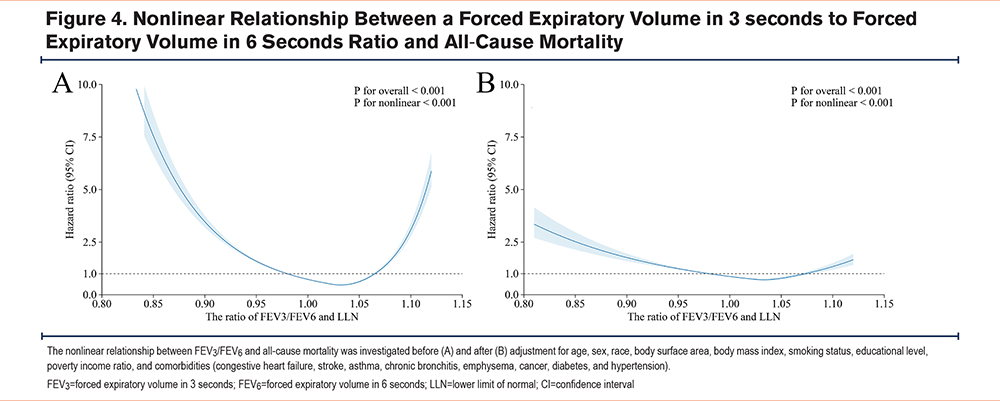
Figure 4 illustrates the RCS analysis curves prior to and following adjustment for the aforementioned covariates, revealing a consistent U-shaped association between the ratio of FEV3/FEV6 to LLN and all-cause mortality with an inflection point at 1.04 (all Pnonlinearity <0.001). Below and above the inflection point, an inverse trend in mortality risk was observed. On the left side of the inflection point, a reduced FEV3/FEV6 ratio was negatively associated with all-cause mortality, while an abnormally elevated ratio on the right was positively associated.
Sensitivity Analyses
Figure S1 and Figure S2 in the online supplement reveal that the U-shaped nonlinear relationship between the ratio of FEV3/FEV6 to LLN and all-cause mortality remained stable in sensitivity analyses, which excluded participants with FVC<80% predicted value or treated comorbidity as a categorical variable. Stratified analysis in Figure S3 in the online supplement shows this robust relationship in the 41–60 and 61–80 age groups, with no significant association observed in the 20–40 age group. An L-shaped nonlinear association was observed between the continuous FEV3/FEV6 ratio and all-cause mortality shown in Figure S4 in the online supplement. When age was used as the survival analysis time scale, the all-cause mortality risk curves in Figure S5 in the online supplement revealed a striking divergence after age 60, with a steep increase in risk specifically for the reduced FEV₃/FEV₆ group. The pattern aligns with the Cox regression models in Table S1 in the online supplement, which remained consistent with the primary analysis.
Discussion
This study revealed that participants with reduced FEV3/FEV6 had an increased risk of comorbidities, chronic respiratory symptoms, and all-cause mortality compared with participants with normal FEV3/FEV6. The above results were consistent across the subgroup analyses. Furthermore, a nonlinear U-shaped relationship between FEV3/FEV6 and all-cause mortality risk was identified.
To our knowledge, this study has the longest follow-up of the current studies that have evaluated the relationship between reduced FEV3/FEV6 and all-cause mortality. Concurrently, it is the first study to explore the nonlinear relationship between FEV3/FEV6 and all-cause mortality risk. These findings suggest that FEV3/FEV6 can serve not only as a marker to evaluate the risk of developing chronic multimorbidity, but also as an independent prognostic marker of lung function in clinical practice.
Reduced FEV3/FEV6 serves as an early indicator of SAD.5 The small airways are defined16 as those with a luminal diameter of <2mm. SAD may develop through multiple pathological mechanisms, including luminal occlusion by mucus, reduction in luminal diameter from inflammatory infiltrates, smooth muscle hypertrophy, or airway wall thickening. Furthermore, loss of structural airway support can increase the collapsibility of the airways.2 Yee et al (SPIROMICS study) and Dilektasli et al (COPD Genetic Epidemiology study cohort) demonstrated associations between FEV3/FEV6 <LLN and respiratory deterioration and dyspnea.5,7 Additionally, Knox-Brown et al found that chronic cough, chronic phlegm, wheezing, and shortness of breath were associated with isolated small airway obstruction, consistent with the results of the present study. Participants with reduced FEV3/FEV6 were more likely to have chronic respiratory symptoms owing to characteristic pathological changes and small airway obstruction.17 In addition, chronic exposure to inhalant irritants that damage the walls of the small airways may also lead to respiratory symptoms in these participants because particles can more easily collide with the narrower small airway surfaces.17,18
A previous study also used the FEV3/FEV6 ratio to define small airway obstruction, showing that participants with small airway obstruction were at an increased risk of all-cause, respiratory, cardiovascular, and neoplasm-related mortality, similar to our findings.8 Our study demonstrated that participants with reduced FEV3/FEV6had an increased risk of chronic bronchitis, asthma, emphysema, and congestive heart failure. The Assessment of Small Airways Involvement in Asthma study demonstrated a SAD prevalence of up to 91% among patients with asthma.19 Furthermore, the severity of small airway dysfunction is markedly associated with an increased risk of asthma exacerbation, and its presence adversely affects asthma symptom control.20 The small airways play a pivotal role in the pathophysiology of obstructive lung diseases, including asthma and COPD. The characteristic of airway inflammation, mucus hypersecretion, and structural remodeling in these conditions contributes to respiratory diseases, cardiometabolic complications, and reduced quality of life.21-23 Also, SAD may be a precursor to emphysema, and loss of alveolar attachments may be the underlying mechanism.18,24 It has also been found that participants with isolated small airway obstruction are more likely to be diagnosed with cardiovascular disease, even without coexisting airflow obstruction, possibly mediated through small airway obstruction upregulated inflammatory processes.16 However, no significant association was observed between participants with reduced FEV3/FEV6 and cancer, which may be related to the insufficiency of the cancer data included.
This study revealed a nonlinear U-shaped relationship between the ratio of FEV3/FEV6 to LLN and all-cause mortality risk. Reduced FEV3/FEV6 may increase all-cause mortality through a combination of mechanisms, including small airway remodeling, mucus plugging, immune cell infiltration, and systemic inflammation.2,25 In patients with comorbid chronic airway disease, reduced FEV3/FEV6 is associated with frequent exacerbations, a heightened symptom burden, and diminished quality of life.5,7,17,26 These findings demonstrate a biologically plausible association between reduced FEV3/FEV6 and increased all-cause mortality. Notably, an excessive FEV3/FEV6 ratio paradoxically predicts a higher risk of all-cause mortality. Sensitivity analyses that excluded participants with FVC <80% predicted or categorized comorbidities (congestive heart failure, asthma, chronic bronchitis, emphysema) consistently demonstrated a robust U-shaped association, suggesting that restrictive ventilatory impairment and comorbidities may not be the primary drivers of the rightward shift in the curve beyond the inflection point. In previous studies, we observed that the nonlinear relationship between FEV1/FVC and all-cause mortality shifted from an L-shaped curve to a U-shaped curve after adjusting for confounders, and Tang et al suggested that age may be a key factor driving this change, though the precise mechanism remains unclear.27 In our study, the U-shaped curve was specific to individuals aged above 41, suggesting that the paradoxical rise in FEV₃/FEV₆ might be related to age-dependent respiratory muscle weakness.28 Furthermore, since respiratory muscle strength is closely tied to nutritional status and cardiac index, participants with respiratory muscle weakness may often present with underlying conditions such as malnutrition or compensatory heart failure. These compounding factors may collectively explain the elevated risk observed on the right side of the curve.29 However, these hypotheses require further validation through targeted investigations.
The association between reduced FEV3/FEV6 and all-cause mortality remained consistent across the subgroup analyses. Despite significant interaction terms being observed only for race and smoking status, the association between reduced FEV₃/FEV₆ and increased mortality showed a consistent effect direction across all subgroups, underscoring the robustness of the finding. Previous cohort studies have been conducted only in the population of smokers, ignoring the role of reduced FEV3/FEV6 in never-smokers.5,7,30 Our study found that reduced FEV3/FEV6 remained significantly associated with increased all-cause mortality among never-smokers, which not only remedies the scarcity of studies involving never-smokers, but it also demonstrates the good generalizability of FEV3/FEV6as a lung function indicator.
This study has several important strengths that merit emphasis. First, the data were obtained from the NHANES, which boasts a substantial sample size and comprehensive data coverage, thereby facilitating more precise generalizations to the general population and enabling a comprehensive assessment of the relationship between FEV3/FEV6 and all-cause mortality. Second, our study used 5 Cox proportional-hazards models and incorporated extensive adjustment for confounders to verify the robustness and credibility of the findings. Furthermore, subgroup analyses were conducted based on the univariable and multivariable models, the results of which were consistent with the main analysis, further enhancing the robustness of the results. Finally, we fitted RCS curves, both unadjusted and adjusted for confounders. The findings revealed an independent relationship between FEV3/FEV6 and all-cause mortality.
Our study also has several limitations. First, even after adjustment for a wide range of potential confounding factors through the multivariable models, the relationship between FEV3/FEV6 and all-cause mortality might have still been affected by unmeasured factors, such as occupational exposure and air pollution due to limitations in data availability. Second, prebronchodilator spirometry data were used owing to constrained postbronchodilator spirometry data availability. Although previous studies have shown that postbronchodilator spirometry is a more accurate predictor of mortality than prebronchodilator spirometry, the difference is relatively minor.31,32 Third, due to the unavailability of specific all-cause death data for participants during the 1988–1994 period, we were unable to exclude the external causes such as accidents that may have diluted the true association between FEV3/FEV6 and all-cause mortality. Finally, the data comprised 2 components of spirometry that used different quality control criteria and operational standards, which has the potential to influence the accuracy of FEV3/FEV6 measurements.
Conclusion
In summary, this analysis of data from the NHANES showed that participants with reduced FEV3/FEV6 had a higher risk of chronic respiratory symptoms, comorbidities, and all-cause mortality. Moreover, we observed a nonlinear U-shaped relationship between FEV3/FEV6 and all-cause mortality risk. These results suggest that FEV3/FEV6 could be a sensitive prognostic spirometry indicator in the general population.
Acknowledgements
Author contributions: SL and FW had full access to all of the data in the study and take responsibility for the integrity of the data and the accuracy of the data analysis. SL, JL, and FW were responsible for the concept and design. SL, JL, JO, RP, SZ, LT, QZ, YC, XG, JC, QW, ZW, ZD, YZ, and FW were responsible for the acquisition, analysis, or interpretation of data. SL, JL, and FW were in charge of the statistical analysis. SL, JL, and FW drafted the manuscript. SL and FW were the study guarantors. All authors contributed to the critical revision of the manuscript and approved the final version.
Other acknowledgements: We thank all participants who volunteered as part of the National Health and Nutrition Examination Survey. We thank Emily Woodhouse, PhD, from Liwen Bianji (Edanz) (www.liwenbianji.cn) for editing the English text of a draft of this manuscript.
Declaration of Interest
The authors declare that they have no conflicts of interest.