Running Head: Low FEV1/FVC and FEV1 Predict COPD Progression
Funding Support; This work was funded by the Noncommunicable Chronic Diseases-National Science and Technology Major Project (2023ZD0506306, 2023ZD0506003), the Social Development Project of Yunnan Province (202403AC100006), and sponsored by the Beijing Nova Program (20250484849), and the Elite Medical Professionals Project of China-Japan Friendship Hospital (ZRJY2024-GG06).
Date of Acceptance: April 15, 2026 | Published Online Date: May 12, 2026
Abbreviations: BMI=body mass index; CI=confidence interval; COPD=chronic obstructive pulmonary disease; COPD-SQ=COPD screening questionnaire; CT=computed tomography; FEV1=forced expiratory volume in 1 second; FEV1 %pred=FEV1 percentage predicted; FVC=forced vital capacity; FVC %pred=FVC percentage predicted; GLI=Global Lung Function Initiative; GOLD=Global initiative for chronic Obstructive Lung Disease; HR=hazard ratio; OR=odds ratio; PRISm=preserved ratio impaired spirometry; SD=standard deviation; UKB=U.K. Biobank; VO=variable obstruction
Citation: Tang X, Li W, Lei J, et al. Borderline forced expiratory volume in 1 second to forced vital capacity and low forced expiratory volume in 1 second predict disease progression in high-risk populations with COPD. Chronic Obstr Pulm Dis. 2026; 13(4): 1-1. doi: http://doi.org/10.15326/jcopdf.2025.0700
Online Supplemental Material: Read Online Supplemental Material (518KB)
Introduction
Chronic obstructive pulmonary disease (COPD) imposes a significant global disease burden and is a major cause of morbidity and mortality, particularly in China.1,2 Lung damage often occurs before clinical symptoms or spirometry abnormalities are evident.3,4 Therefore, early identification of high-risk individuals is important for timely interventions and potentially slowing disease progression.
The standard diagnostic criterion for COPD is based on spirometry, specifically a forced expiratory volume in 1 second (FEV1) to forced vital capacity (FVC) ratio <0.7 in symptomatic individuals with relevant risk factors.5 Individuals with an FEV1/FVC ratio >0.8 have a low likelihood of progressing to airway obstruction.6 In addition, several studies have proposed using an FEV1/FVC threshold of 0.8 to better identify patients with obstructive abnormalities and reduce misclassification of restrictive pulmonary processes.7-9
The Global initiative for chronic Obstructive Lung Disease (GOLD) recommends staging COPD based on the FEV1 percentage predicted (FEV1 %pred), with GOLD stages 1–4 corresponding to ≥80%, 50%–80%, 30%–50%, and <30%, respectively.10 Decline in FEV1 is considered a marker of disease deterioration, distinct from the diagnostic criterion of FEV1/FVC. However, patients not meeting COPD diagnostic thresholds may still exhibit a decreased FEV1, even below 80% of the FEV1 %pred. This recognition has led to concepts such as preserved ratio impaired spirometry (PRISm). PRISm emphasizes smoking history and reduced FEV1 or FVC despite a normal FEV1/FVC ratio, but encompasses a heterogeneous group of complex lung conditions. By contrast, impaired FVC with a preserved FEV1 to FVC ratio defines a restrictive pattern.11
Spirometry, an objective and validated measurement, serves as a biomarker for disease progression, including measurements of FEV1, FVC, FEV1/FVC, peak expiratory flow, and diffusing capacity for carbon monoxide.12-15 Given the complexity of spirometry, several studies have focused on the diagnostic relevance of a “normal but low” FEV1/FVC ratio, which we called “borderline ratio” in this study. Meanwhile, reduced FEV1 %pred is often considered a feature of PRISm, yet has rarely been studied in combination with borderline FEV1/FVC.
Therefore, the present study focused on a simple spirometry pattern defined by both FEV1/FVC and FEV1 %pred in a population of patients at high risk for COPD. We examined the association between borderline ratio, PRISm (low FEV1) with risk of developing airflow obstruction and FEV₁ decline, using data from the National COPD Screening Program in China. We then validated our findings in the general population using the U.K. Biobank (UKB).
Methods
Study Design
In this study, we analyzed data from a high-risk COPD population in the National COPD Screening Program in China and validated our findings in the general population using the UKB.
We included participants with normal lung function at baseline (FEV1/FVC ≥0.7) who had completed at least one follow-up assessment. For simplicity, we used the term “low FEV1” to represent FEV1 %pred <80%, instead of the PRISm classification. Based on the baseline lung function, participants were categorized into 4 subgroups: normal ratio with normal FEV1 (FEV1/FVC ≥0.8, FEV1 %pred ≥80%), borderline ratio with normal FEV1 (0.7 ≤FEV1/FVC <0.8, FEV1 %pred ≥80%), normal ratio with low FEV1 (FEV1/FVC ≥0.8, FEV1 %pred <80%), and borderline ratio with low FEV1 (0.7≤ FEV1/FVC <0.8, FEV1 %pred ≥80%). The definitions of these subgroups are illustrated in Figure 1.
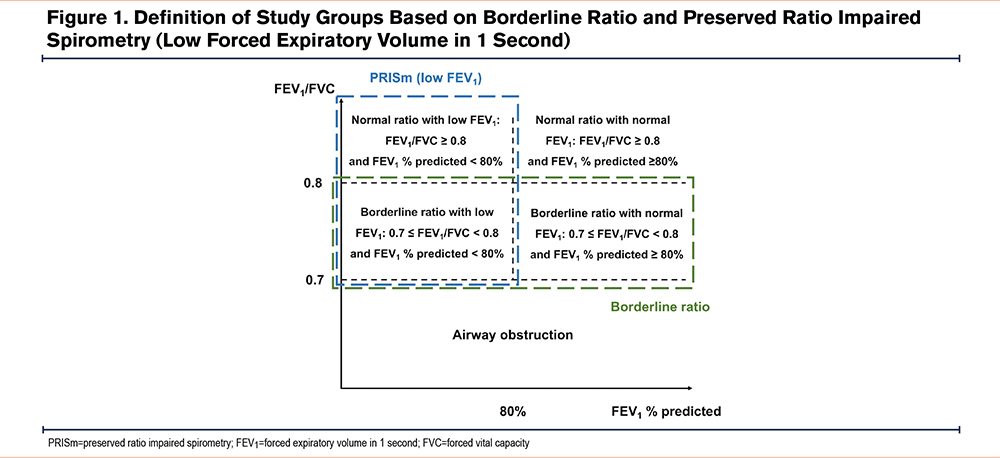
We also analyzed participants according to FEV1/FVC or FEV1 %pred separately: FEV1/FVC was categorized as normal (FEV1/FVC ≥0.8) and borderline (0.7≤ FEV1/FVC <0.8), and FEV1 was categorized as normal (FEV1 %pred ≥80%) or PRISm (also called “low FEV1,” FEV1 %pred <80%).
This study focused on the risk of FEV1 decline and progression to airway obstruction in participants at high risk for COPD. FEV1 decline was treated as both a continuous and categorical variable. For the continuous variable, the value was defined as the follow-up FEV1 minus the baseline FEV1. Categorical of rapid FEV1 decline was defined as an annual decrease of >50mL, based on prior evidence showing a mean annual decline of ~50mL in the general population.16 Airway obstruction during follow-up was defined as postbronchodilation FEV1/FVC <0.7. Analyses were performed separately in the high-risk COPD cohort and the general population cohort to assess the consistency of findings across different populations.
The National COPD Screening Program in China
Data for this study were derived from the National COPD Screening Program in China, details of which have been described previously.17 Briefly, residents aged 35–75 years from 160 districts or counties across 31 provinces in China participated in an online screening using the COPD Screening Questionnaire (COPD-SQ), which captures age, smoking history, body mass index (BMI), respiratory symptoms, biomass exposure, and family history.18 Using a cut-off score of 16 points, the COPD-SQ correctly classifies 82.7% of patients, and is associated with a high area under the curve of 0.829. Participants with a COPD-SQ score >16 were considered high-risk and invited to attend on-site screening, which included a detailed survey questionnaire and pre- and postbronchodilation spirometry, followed by regular follow-ups. Data on relevant risk factors, symptoms, and pulmonary function were repeatedly collected during follow-up visits.
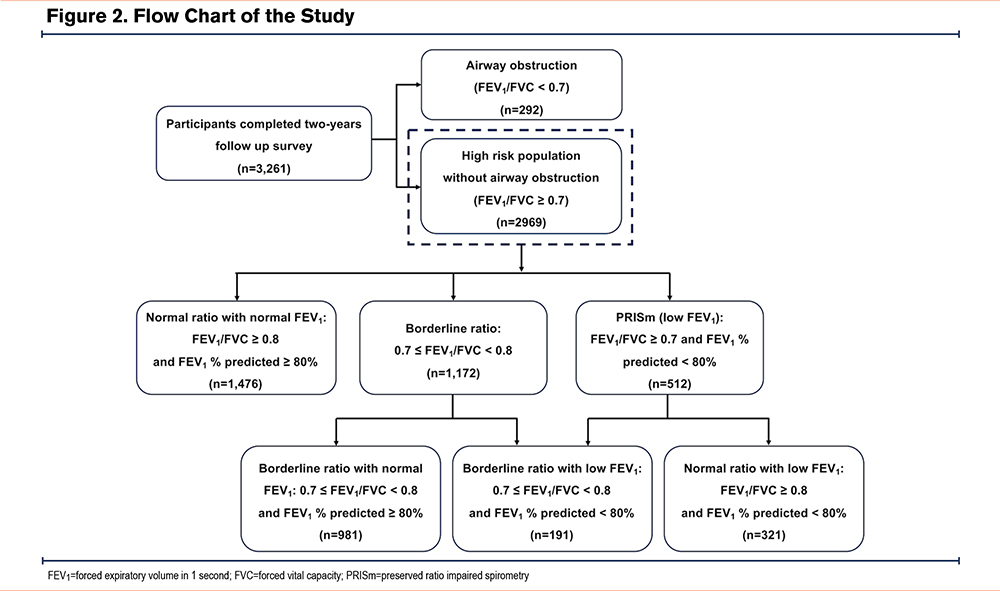
The National COPD Screening Program was officially launched in October 2021. However, due to disruptions caused by the COVID-19 pandemic, 3262 participants completed 2 years of follow-up, including full questionnaire responses and spirometry data, by July 2024. The present analysis included all participants who completed the 2-year follow-up and focused on individuals without COPD at baseline (Figure 2).
The program was approved by the institutional review board of China–Japan Friendship Hospital (approval number: 2021-145-K103). All participants provided written informed consent.
U.K. Biobank
The UKB is a nationwide cohort of 502,394 participants aged 37–73 years, recruited between 2006 and 2010, with detailed baseline data collected via touchscreen questionnaires, nurse interviews, physical measurements, and biological samples, encompassing sociodemographic factors, lifestyle, diet, and reproductive history.
Ethical approval for the UKB study was obtained from the Northwest Multicenter Research Ethics Committee. All methods were performed following the relevant guidelines and regulations. This study was conducted using resources provided by the U.K. Biobank (application number 277441).
Data Collection
The National COPD Screening Program in China used questionnaires to collect baseline information, including sex, age, annual income, education, marital status, employment, job type (indoor or outdoor), clean fuel use, smoking status, secondhand smoke exposure, family history of COPD, comorbidities, and respiratory symptoms. Anthropometric measurements, including height, weight, waist circumference, and hip circumference, were recorded on-site. BMI was calculated as body weight (kg)/height (m²).
From the UKB database, data on participant, age, ethnicity, smoking status, and respiratory symptoms, height, weight, and BMI were collected.
All participants underwent spirometry according to the American Thoracic Society and European Respiratory Society guidelines.19 Trained medical staff performed spirometry using portable pulmonary function measurement devices in primary care settings. The present analysis used prebronchodilator lung function in both datasets. Quality control was conducted by expert teams at provincial and national levels following guideline recommendations.19 The predicted values of FEV1 and FVC were calculated using the reference equations derived from the general Chinese population20 for the National COPD Screening Program. The UKB used the race-neutral equations from the Global Lung Function Initiative (GLI).21
Statistics
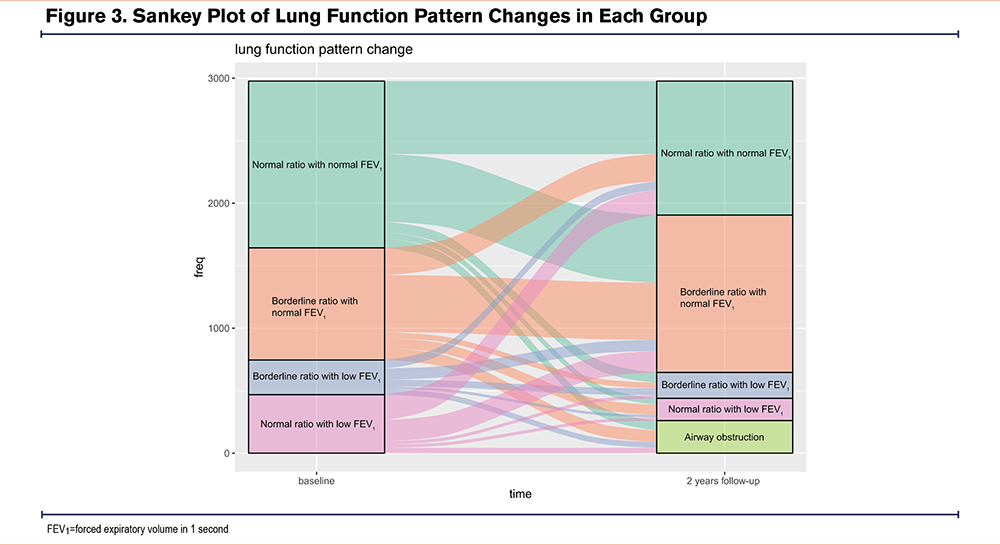
Descriptive data are presented as means ± standard deviation for continuous variables and frequencies for categorical variables. Differences between groups were assessed using Student’s t-test, Mann–Whitney U test, or one-way analysis of variance for continuous variables, and χ² test for categorical variables. Comparisons were made between the borderline ratio and normal spirometry groups, as well as between the PRISm (low FEV1) and normal spirometry groups. Changes in spirometry patterns from baseline to the 2-year follow-up were visualized using Sankey plots. Changes in lung function were measured as the difference between follow-up and baseline values, including FEV1 change and FEV1 %pred change. In the National COPD Screening Program, lung function change over 2 years was directly calculated, whereas in the UKB, annual lung function changes were calculated instead due to variable follow-up times.
In the National COPD Screening Program, the follow-up times were consistent. Thus, logistic regression models were applied to analyze the risk of developing airflow obstruction and rapid FEV1 decline, reported as odds ratios (ORs) and 95% confidence intervals (CIs). In the UKB, as the follow-up times differed, Cox regression models were used to measure the risk of disease progression, reported as hazard ratios (HRs) and 95% CIs. Sensitivity analyses were performed separately for the borderline ratio and PRISm (low FEV1) groups. Model 1 was adjusted for age and sex. Model 2 was additionally adjusted for education level, income, ethnicity, BMI, smoking status, smoking pack years and other relevant factors. Further analysis of National COPD Screening Program data using univariable and multivariable logistic regression models identified risk factors for airway obstruction and rapid FEV1 decline within the borderline ratio and PRISm (low FEV1) groups. Sensitivity analyses were also performed using the GLI equations to calculate predicted FEV1 and FVC in the National COPD Screening Program.
Statistical significance was defined as 2-sided p <0.05. All analyses were performed using R software (version 4.3.0).
Results
Baseline Characteristics of the Enrolled High-Risk Population of COPD
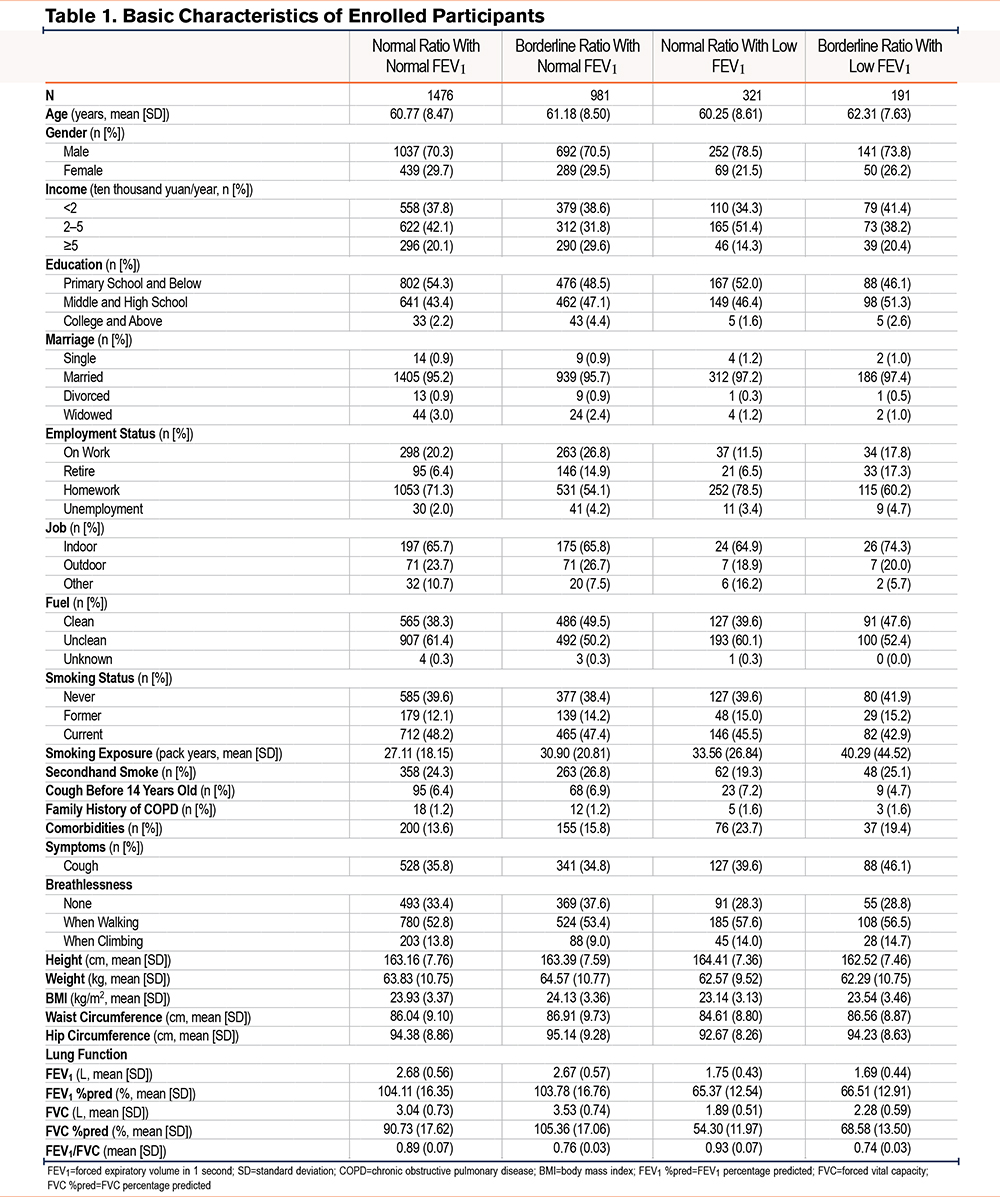
This study analyzed a total of 2969 participants at high risk for COPD, including 1476 in the normal ratio with normal FEV1 group, 981 in the borderline ratio with normal FEV1 group, 321 in the normal ratio with low FEV1 group, and 191 in the borderline ratio with low FEV1 group. Table 1 shows their basic characteristics. The mean ages in the normal ratio with normal FEV1, borderline ratio with normal FEV1, normal ratio with low FEV1, and borderline ratio with low FEV1 groups were 60.77, 61.18, 60.25, and 62.31 years, respectively. The proportion of male participants was highest in the normal ratio with low FEV1 group (78.5%). The normal ratio with low FEV1 group showed the highest proportion of comorbidities (23.7%). The borderline ratio with low FEV1 group showed the highest smoking exposure (40.29 pack years) and the highest proportion of symptoms (46.1%). Supplementary Table 1 in the online supplement shows the characteristics of the participants stratified by borderline ratio and PRISm (low FEV1), separately.
Changes in spirometry measurements over the 2-year follow-up revealed significant lung function decline in the borderline ratio with normal FEV1 group (Supplementary Table 2 in the online supplement). In contrast, lung function improved slightly in the normal spirometry and PRISm (low FEV1) group but remained impaired in the borderline ratio group (Supplementary Table 3 in the online supplement).
We also calculated the proportion of participants experiencing rapid FEV1 decline and airway obstruction at the 2-year follow-up. The borderline ratio with normal FEV1 group showed the highest proportion of participants with rapid FEV1 rapid (47.6%), while the borderline ratio with low FEV1 group showed the highest proportion of participants with airway obstruction (15.2%) (Supplementary Table 2 on the online supplement). Figure 3 illustrates the changes in spirometry pattern from baseline to the 2-year follow-up, showing that most newly diagnosed cases of airway obstruction developed in patients in the borderline ratio group (43.1%).
Risk of Progressing to Airway Obstruction
We explored the risk of progressing to airway obstruction in each group. Compared with the normal ratio with normal FEV1 group, the borderline ratio with low FEV1 group (adjusted OR=2.32, 95% CI: 1.46 to 3.69) and the borderline ratio with normal FEV1 (adjusted OR=1.81, 95% CI: 1.34 to 2.44) group had higher risks of developing airway obstruction. By contrast, participants in the normal ratio with low FEV1 group showed no significant risk of developing airway obstruction compared with the normal ratio with normal FEV1 group (adjusted OR=1.31, 95% CI: 0.83 to 2.07). Further, compared with individuals with normal spirometry, those with borderline ratio (adjusted OR=1.97, 95% CI: 1.47 to 2.62) and PRISm (low FEV1) (adjusted OR=1.69, 95% CI: 1.17 to 2.44) had higher risks of developing airway obstruction (Table 2).
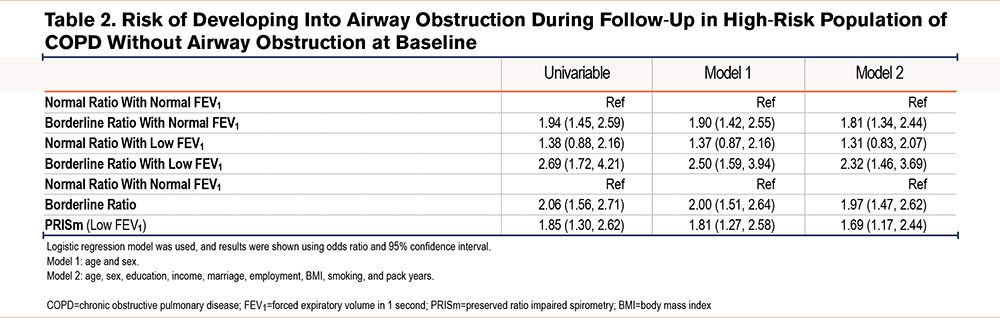
We further explored potential risk factors for airway obstruction within the borderline ratio group. Older age (adjusted OR=1.07, 95% CI: 1.02 to 1.12) and secondhand smoke (adjusted OR=2.38, 95% CI: 1.18 to 4.80) were identified as significant predictors, while females had a lower risk than males (adjusted OR=0.23, 95% CI: 0.07 to 0.85) (Supplementary Table 4 in the online supplement). In the PRISm (FEV1) group, multivariable logistic analysis identified no significant risk factors for developing airway obstruction (Supplementary Table 5 in the online supplement).
Risk of Forced Expiratory Volume in 1 Second Decline
For FEV1 decline treated as the continuous variable, the borderline ratio with normal FEV1 group showed higher FEV1 decline than the normal ratio with normal FEV1 group (adjusted β=-0.15, 95% CI: -0.21 to -0.10), while the borderline ratio with low FEV1 (adjusted β=0.62, 95% CI: 0.52 to 0.72) and normal ratio with low FEV1 (adjusted β=1.01, 95% CI: 0.93 to 1.09) groups showed less decline of FEV1. Analysis of single spirometry parameter showed that the borderline ratio group exhibited more decline of FEV1 than the normal spirometry group after adjusting for age and sex (adjusted β=-0.07, 95% CI: -0.13 to -0.02), but the results turned nonsignificant after adjusting for other factors (adjusted β=-0.03, 95% CI: -0.09 to 0.02). The PRISm (low FEV₁) group showed less decline of FEV1 than the normal group (adjusted β=0.86, 95% CI: 0.79 to 0.93) (Table 3).
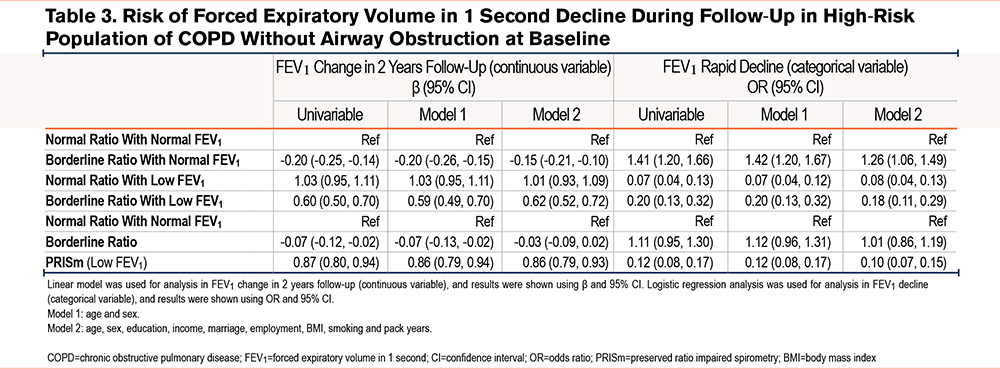
The borderline ratio with normal FEV1 group showed an increased risk of rapid FEV1 decline (adjusted OR=1.26, 95% CI: 1.06 to 1.49). Conversely, the borderline ratio with low FEV1 (adjusted OR=0.18, 95% CI: 0.11 to 0.29) and the normal ratio with low FEV1 (adjusted OR=0.08, 95% CI: 0.04 to 0.13) groups showed lower risks of rapid FEV1 decline compared with the normal ratio with normal FEV1 group. Analysis by single spirometry patterns showed that participants in the borderline ratio group had a similar risk of rapid FEV1 decline as the normal ratio group (adjusted OR=1.01, 95% CI: 0.86 to 1.19), whereas participants with PRISm (low FEV1) had a markedly lower risk (adjusted OR=0.10, 95% CI: 0.07 to 0.15) (Table 3).
We further investigated the potential risk factors for FEV1 rapid decline in the borderline ratio and PRISm (low FEV₁) groups. In the borderline ratio group, multivariable logistic analysis indicated work indoors was the protective factor (adjusted OR=0.45, 95% CI: 0.26 to 0.78). Current smokers also showed the lower risk of rapid FEV1 decline (adjusted OR=0.45, 95% CI: 0.21 to 0.96), which may be explained by the worse baseline condition (Supplementary Table 6 in the online supplement). In the PRISm (low FEV₁) group, no significant factors were found related to rapid FEV1 decline (Supplementary Table 7 in the online supplement).
Analysis in the General Population Based on U.K. Biobank Data
The analysis of the general population used data from 35,585 participants in the UKB without airway obstruction (FEV1/FVC ≥0.7), including 10,684 in the normal ratio with normal FEV1 group, 23,108 in the borderline ratio with normal FEV1 group, 313 in the normal ratio with low FEV1 group, and 1480 in the borderline ratio with low FEV1 group (Supplementary Figure 1 in the online supplement). The basic characteristics of the general population were similar to those for the high-risk population (Supplementary Tables 8 and 9 in the online supplement).
Lung function changes over follow-up in each group were consistent with the findings in the high-risk COPD cohort (Supplementary Tables 10 and 11 in the online supplement).
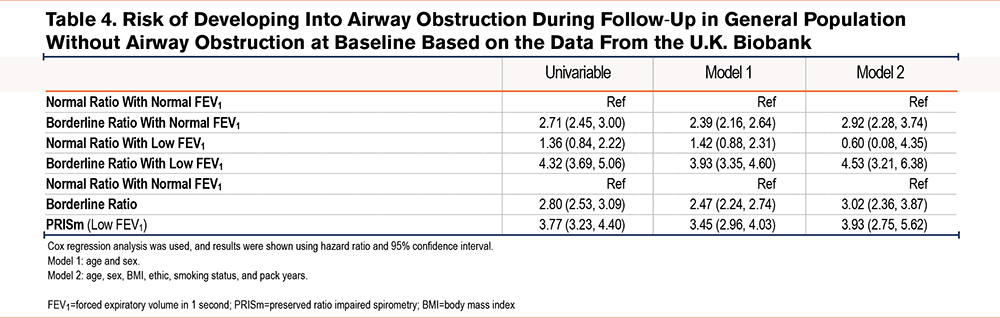
Regarding the risk of developing airway obstruction, the borderline ratio with normal FEV1 (adjusted HR=2.92, 95% CI: 2.28 to 3.74) and borderline ratio with low FEV1 (adjusted HR=4.53, 95% CI: 3.21 to 6.38) groups had significantly higher risks compared with the normal ratio with normal FEV1 group. In contrast, the normal ratio with low FEV1 group showed a nonsignificant increase in risk (adjusted HR=0.60, 95% CI: 0.08 to 4.35) (Table 4).
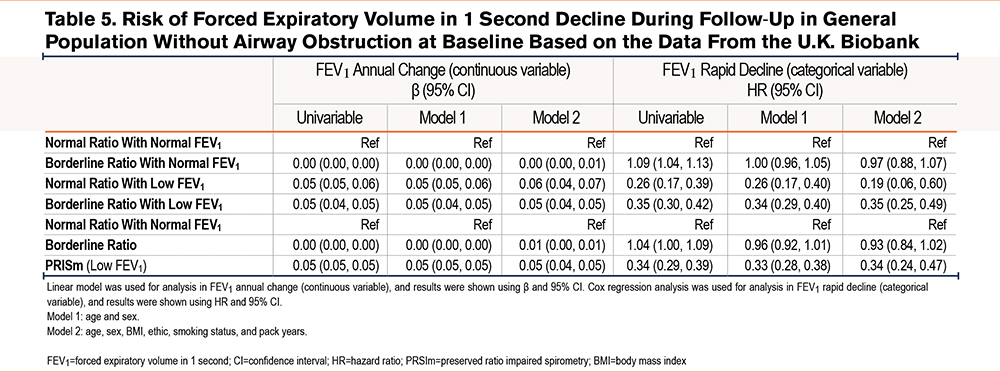
The borderline ratio with normal FEV1 group had a similar annual FEV1 change with normal ratio as the normal FEV1 group (adjusted β=0.00, 95% CI: 0.00 to 0.01), while the normal ratio with low FEV1 group (adjusted β=0.06, 95% CI: 0.04 to 0.07) and borderline ratio with low FEV1 (adjusted β=0.05, 95% CI: 0.04 to 0.05) group showed less decline. Regarding rapid FEV1 decline, the borderline ratio with low FEV1 group showed a higher risk than the normal ratio with normal FEV1 group in the unadjusted model (HR=1.09, 95%CI: 1.04–1.13). However, this association was not significant after adjusting for covariates (adjusted HR=0.97, 95%CI: 0.88–1.07) (Table 5).
Sensitivity Analysis Using the Global Lung Function Initiative Reference Equations
We performed sensitivity analyses using the GLI reference equations to calculate predicted lung function values in the National COPD Screening Program. Among the 2969 high-risk COPD participants, baseline characteristics were similar to those obtained using the Chinese reference equations (Supplementary Tables 12 and 13 in the online supplement).
Lung function changes showed some differences. The highest proportion of rapid FEV1 decline was observed in the borderline ratio with normal FEV1 group (47.1%) (Supplementary Table 14 in the online supplement). The normal and borderline FEV1/FVC groups showed similar proportions of participants with rapid FEV1 decline (39.2% versus 40.7%, p=0.462) (Supplementary Table 15 in the online supplement).
Regarding the risk of developing airway obstruction, the borderline ratio with low FEV1 groups showed the highest risk among the 3 subgroups (adjusted OR=2.66, 95% CI: 1.74 to 4.08) (Supplementary Table 16) in the online supplement.
The findings regarding the FEV1 decline were consistent with those using the Chinese reference equations. The borderline ratio with normal FEV1 group showed more decline in FEV1 (adjusted β=-0.15, 95% CI: -0.21 to -0.10) and higher risk of rapid FEV1 decline (adjusted OR=1.23, 95% CI: 1.04–1.46) than the normal spirometry groups (Supplementary Table 17 in the online supplement).
Discussion
This study evaluated the risk of disease progression in a high-risk population for COPD, considering both borderline FEV1/FVC (defined as 0.7 ≤ FEV1/FVC <0.8) and low FEV1 (defined as FEV1 %pred ≤80%). Our results demonstrated that both measures are risk factors for disease progression, especially among participants with a borderline ratio with low FEV1 and a borderline ratio with normal FEV1. The findings were also observed among the general population.
In the high-risk cohort, participants with a borderline ratio with normal FEV1 had the highest risk of rapid FEV1 decline, while in the UKB, the results turned nonsignificant. The UKB cohort had a substantially longer follow-up period (median 8 years) compared with the Chinese high-risk cohort (2 years). Longer follow-up inevitably captures more incident COPD events, yet the overall trends across subgroups remained directionally consistent. Importantly, lung function decline is not strictly linear; the rate of decline tends to diminish over time. This nonlinear pattern may explain why the association between borderline ratio and FEV1 decline was more pronounced in the Chinese high-risk cohort than the UKB cohort. We should not overlook the fact that in high-risk populations, accelerated decline occurs predominantly in the early years—a clinically meaningful phenomenon that shorter-term studies are better positioned to capture.
Previous studies have emphasized the role of PRISm (low FEV1) in early adulthood and suggested that accelerated FEV1 decline is not a universal feature of COPD.22,23 Our findings also support the importance of PRISm (low FEV1), but not necessarily rapid FEV1 decline, in predicting the risk of airway obstruction. The PRISm (low FEV1) group in the present study showed increases in FEV1, suggesting that the ratio decreased partly due to increased FVC. Some individuals in this group even reverted to normal lung function, consistent with earlier reports.24,25 Baseline analysis also showed that individuals in the borderline ratio group had higher spirometry values, which may partially explain the observed “rapid decline,” reflecting a "more to lose" phenomenon described in different stages of COPD.26,27 However, despite similar baseline lung function, individuals in the borderline ratio with normal FEV1 group had a significantly higher risk of FEV1 decline compared with those with normal spirometry, highlighting the need for greater clinical attention to this subgroup.
The concept of a preclinical stage of COPD, like prediabetes and prehypertension, has gained attention in recent years. Han et al28 proposed in 2021 that preclinical COPD should be defined by abnormalities in symptoms, structure, and function, with at least 2 criteria required.28 However, this approach is limited: symptoms rely on subjective reporting, structural assessment usually requires computed tomography (CT) imaging, which is not widely available in primary care, and functional assessment depends on lung function trajectories. Thus, identifying pre-COPD individuals in the general population remains challenging. GOLD now recommends case-finding in high-risk populations using simple questionnaires such as the COPD Assessment in Primary care To identify Undiagnosed Respiratory disease and Exacerbation (CAPTURE) risk.29
Recent efforts have also highlighted the limitations of a spirometry-only diagnostic approach. In a large cohort study, a multidimensional diagnostic schema incorporating respiratory symptoms, quality of life, spirometry, and structural lung abnormalities assessed on chest CT reclassified a subset of individuals without airflow obstruction as having COPD.30 While multidimensional approaches offer comprehensive risk assessment, their implementation in primary care is limited by the need for imaging and detailed questionnaires. In this context, simple objective spirometry-based markers such as borderline FEV1/FVC may serve as a practical first-step screening tool to identify high-risk individuals who warrant further multidimensional evaluation.
Several spirometry-based definitions of “at-risk” for COPD have been proposed. One of the most well-known of these, PRISm, is characterized by a normal FEV1/FVC ratio but reduced predicted FEV1 or FVC among current or former smokers and is associated with a higher risk of developing COPD and increased mortality.13,15,24,25,31 However, PRISm classification depends on predicted values, and therefore, on reference equations. Similarly, defining high-risk status based on prebronchodilator FEV1/FVC below the 10th percentile has been shown to predict COPD, but requires reference standards.32 Buhr et al introduced the concept of variable obstruction (VO), defined as prebronchodilation FEV1/FVC <0.7 and postbronchodilation FEV1/FVC ≥0.7 to identify individuals at increased risk for developing COPD.33 However, VO requires bronchodilation testing, which limits its applicability. In contrast, the current study showed that borderline FEV1/FVC is a robust and easily applicable risk factor for airway obstruction, independent of reference equations or bronchodilation. Moreover, individuals in the borderline FEV₁/FVC but normal FEV₁ group were at risk of both obstruction and rapid decline—an at-risk subgroup not highlighted in prior studies. We suggest that an FEV1/FVC ratio between 0.7 and 0.8 may represent a clinically meaningful threshold for risk stratification in primary care settings.
We also identified clinical factors that may further increase risk among individuals with borderline FEV1/FVC or low FEV1. However, most of these were self-reported and subject to bias. Previous studies have investigated biomarkers for identifying individuals at risk of rapid lung function decline, particularly in patients with asthma,34,35 bronchiectasis,36 and COPD.37 A recent multicohort study38 of 6722 participants identified 15 proteins associated with FEV1 decline, including elafin, leukocyte elastase inhibitor, and mucin-associated trefoil factor 2.
Future research should involve larger cohorts with a longer follow-up period to validate the prognostic value of borderline FEV1/FVC in China. Beyond spirometry, integrating clinical, imaging, and biomarker data may improve identification of individuals at the highest risk for COPD progression. Importantly, no effective interventions currently exist for individuals in the early stages to delay disease progression. Potential available strategies are predominantly nonpharmacological, including smoking cessation and pulmonary rehabilitation. One previous study on bronchodilator therapy in symptomatic smokers with preserved lung function has not demonstrated efficacy.39 Several novel pharmacological agents have emerged, including ensifentrine40 and dupilumab.41 Therefore, further interventional research focusing on the early stages of the disease is warranted to identify more effective approaches to slow disease progression.
This study has several limitations. First, the follow-up period was limited to 2 years. Future studies with longer follow-up are needed to confirm the findings. Second, participants were selected from a high-risk population with positive COPD-SQ results, and those with normal spirometry were used as the reference. This design may underestimate risks among asymptomatic borderline FEV₁/FVC individuals with negative COPD-SQ scores. Third, not all high-risk individuals underwent lung function testing; thus, selection bias was possible. To address this, we validated the findings in the general population using UKB data, which showed similar results. Finally, imaging data were not available in the National COPD Screening Program. Future studies should evaluate the interplay between borderline FEV₁/FVC and structural abnormalities.
Conclusion
Individuals with borderline FEV1/FVC were at increased risk of developing airway obstruction. Importantly, among high-risk populations for COPD, those with borderline FEV1/FVC but preserved FEV1 were most vulnerable to rapid FEV1 decline, underscoring the need for close monitoring and timely intervention in this subgroup. Taken together, these findings demonstrate that this simple spirometry marker may be a practical tool for early risk stratification in primary care.
Acknowledgements
Author contributions: XT designed the study, conducted the statistical analyses, and drafted the manuscript. WL, HN, MS, JY, YP, YC, TH, YL, JP, CZ, and CJ contributed to the data collection and program implementation. XC, TY, and KH supervised the study. KH is the guarantor of the current analysis. All authors approved the final version of the manuscript.
Data availability statement: The raw and individual data are available upon reasonable request from the corresponding author (huangke_zryy@163.com)
Other acknowledgements: The authors thank all the investigators who participated in the National COPD Screening Program.
Declaration of Interest
All authors declare no competing interests.