Running Head: Short-Term Pollen and Lung Function in COPD
Funding Support: None
Date of Acceptance: April 23, 2026 | Published Online Date: May 9, 2026
Abbreviations: BMI=body mass index; CI=confidence interval; COPD=chronic obstructive pulmonary disease; CRP=C-reactive protein; CVD=cardiovascular disease; DLNM=distributed lag nonlinear models; FEV1=forced expiratory volume in 1 second; FVC=forced vital capacity; GAMM=generalized additive mixed model; GED=general education development; GOLD=Global initiative for chronic Obstructive Lung Disease; ICS=inhaled corticosteroid; IQR=interquartile range; NO₂=nitrogen dioxide; O3=ozone; PM2.5=particulate matter diameter of 2.5 micrometers or less; SD=standard deviation; SPACE=Study of Air Pollution and COPD Exacerbation
Citation: Healy JP, Ni W, Coull B, et al. Association of short-term pollen exposure with lung function in COPD patients. Chronic Obstr Pulm Dis. 2026; 13(4): 284-292. doi: http://doi.org/10.15326/jcopdf.2025.0735
Online Supplemental Material: Read Online Supplemental Material (189KB)
Introduction
Chronic obstructive pulmonary disease (COPD) is an inflammatory lung disease that is characterized by progressive persistent airflow limitation and recurring exacerbations. Over 390 million individuals are affected by COPD globally,1 and it is the third leading cause of death worldwide.2 COPD cases and related exacerbations are predicted to rise due to an aging global population and worsening climatic and environmental conditions.3,4 Acute exacerbations from various factors such as infections, air pollutants, and environmental triggers can rapidly worsen lung function and contribute to morbidity, hospitalization, and even mortality.5,6 Previous studies, including our own work in the Study of Pollution and COPD Exacerbation (SPACE) study, have found that exposure to air pollutants is associated with a lower forced expiratory volume in 1 second (FEV1), worse respiratory symptoms, and increased health care reliance in COPD sufferers.7-11 While the impact of air pollution on COPD is well-studied, less is understood about the effect of aeroallergens on the respiratory health of people with COPD.
Most research on the respiratory effect of pollen exposure has concentrated on allergic rhinitis or asthma. Pollen is a known trigger of airway inflammation, bronchoconstriction, and symptom exacerbation in allergic asthma.12,13 However, a notable proportion of COPD patients exhibit allergic sensitization or atopy, with studies indicating that COPD patients who are sensitized to environmental allergens may experience more frequent symptoms and poorer lung function.14,15 Mechanistically, pollen exposure can induce neutrophilic and eosinophilic inflammation, mucous hypersecretion, and increased airway reactivity, processes that could worsen airflow obstruction in COPD.10,16 Further, pollen is an increasingly important exposure in the context of climate change, with higher temperatures and variable precipitation leading to extended pollen seasons, higher concentrations within the season, and more potent allergenic particles, elevating population-level respiratory risk.17-20 As previous ecological studies have linked aeroallergen exposure to increased COPD hospitalizations,21 and a time-series analysis in Beijing showed associations between ambient pollen and COPD-related clinical visits.22 However, few studies have examined objective lung function as a measure of airway response to pollen exposure in COPD.
To address this gap, we investigated the association between short-term pollen exposure over the preceding days and differences in FEV1 and forced vital capacity (FVC) among former smokers with moderate-to severe COPD.
Methods
Study Population
The study population comprised 30 participants diagnosed with COPD who were former smokers.
These participants were recruited as part of SPACE, conducted at the Beth Israel Deaconess Medical Center in Boston, Massachusetts.11,23 Eligibility criteria for participation included a clinical diagnosis of COPD, former smoking status with at least 6 months smoke-free, and moderate airflow obstruction. Specifically, participants required an FEV1/FVC ratio <0.70 and an FEV1 between 50% and 80% of the predicted value, consistent with Global initiative for chronic Obstructive Lung Disease (GOLD)24 Grade 2. A distinctive eligibility requirement was that participants’ home addresses be within 50km of the Harvard Supersite air pollution monitor at Harvard Medical School. The study was approved by the Committee on Clinical Investigations at Beth Israel Deaconess Medical Center. Written informed consent was obtained from all participants prior to their inclusion in the study.
Data Collection
Data collection for the study spanned from February 24, 2017 to January 17, 2019. Upon entry into the study, comprehensive baseline information was collected for each participant, including demographic details, height, weight, past medical history, and initial measures of lung function. Participants were subsequently observed for up to 4 nonconsecutive 30-day periods, distributed across 4 different seasons over a 12-month duration.
Exposure Assessment
Total pollen count was obtained as a regional daily average from Asthma and Allergy Affiliates, Inc., based in Salem, Massachusetts. A Rotorod sampler was used to record daily pollen concentrations, measured in grains per cubic meter (grains/m3). Total pollen included tree, grass, and weed pollen, along with “other” or unclassified pollen particles.25 Our measured pollen season was defined as March through October, coinciding with the pollen season in the Northeastern United States. Observations outside the pollen season were excluded. Pollen collected over weekends and holidays was counted on the following weekday; therefore, weekend and holiday values reflect the pollen concentrations averaged across the days of collection (e.g., Saturday, Sunday, and Monday pollen concentrations are the average across those 3 days). Moving averages are defined as the average exposure over the period of days preceding the lung function measurement (e.g., a 3-day moving average is the sum of pollen over 3 days divided by 3). Temperature was defined as the daily mean temperature. Daily ambient air pollution data were obtained from state-owned stationary monitors in the Boston area. For particulate matter diameter of 2.5 micrometers or less (PM2.5) and nitrogen dioxide (NO2), we averaged daily concentrations from multiple Boston monitors; for ozone (O3), we used data from the Boston (Roxbury neighborhood) state monitor as previously described.11
Outcome Assessment
Participants performed daily lung function measurements each morning, prior to taking any medications or inhalers, utilizing a portable EasyOneTM Plus Diagnostic Spirometer (ndd Medical Technologies; Andover, Massachusetts). This device meets the guidelines established by the American Thoracic Society and incorporates built-in quality assurance and incentive software to ensure data reliability. By the conclusion of the follow-up period, the 30 participants collectively contributed a total of 1808 observations during the pollen season (March to October).
Statistical Analysis
To assess the relationship between short-term total pollen exposure at lag 1 to 7 days and lung function in COPD, as well as the cumulative association over lag 1–3 days, we used distributed lag nonlinear models (DLNM) combined with a generalized additive mixed model (GAMM). We adjusted for potential confounders including age, sex, height, weight, education, seasonality (sine and cosine terms of date), and 3-day moving averages of temperature (lag 1–3 days) prior to the spirometry assessment.
We assessed potential effect modification by markers of type 2 inflammation (blood absolute eosinophils ≥150 versus <150cells/µL), systemic inflammation (C-reactive protein [CRP] >3 versus ≤3mg/L), history of cardiovascular disease (CVD), history of asthma, and baseline use of maintenance medications (inhaled corticosteroids [ICSs], long-acting beta2-agonists, long-acting muscarinic antagonists, and beta-blockers). Moreover, we assessed effect modification by ambient air pollutants (PM2.5, NO2, and O3), categorized as high versus low based on the median 3-day moving average of each pollutant prior to the spirometry assessment. Differences in the estimated effects between subgroup strata were formally evaluated for statistical significance using a Z-test.
Sensitivity analyses were performed by adding other environmental exposures (humidity, NO2, O3, and PM2.5) to the primary model. Additionally, we performed sensitivity analyses: excluding Sundays through Tuesdays to account for weekend/holiday pollen averaging; and removing all covariates from our model. All analyses were conducted in R version 4.3.1.
Results
Study Population and Exposure
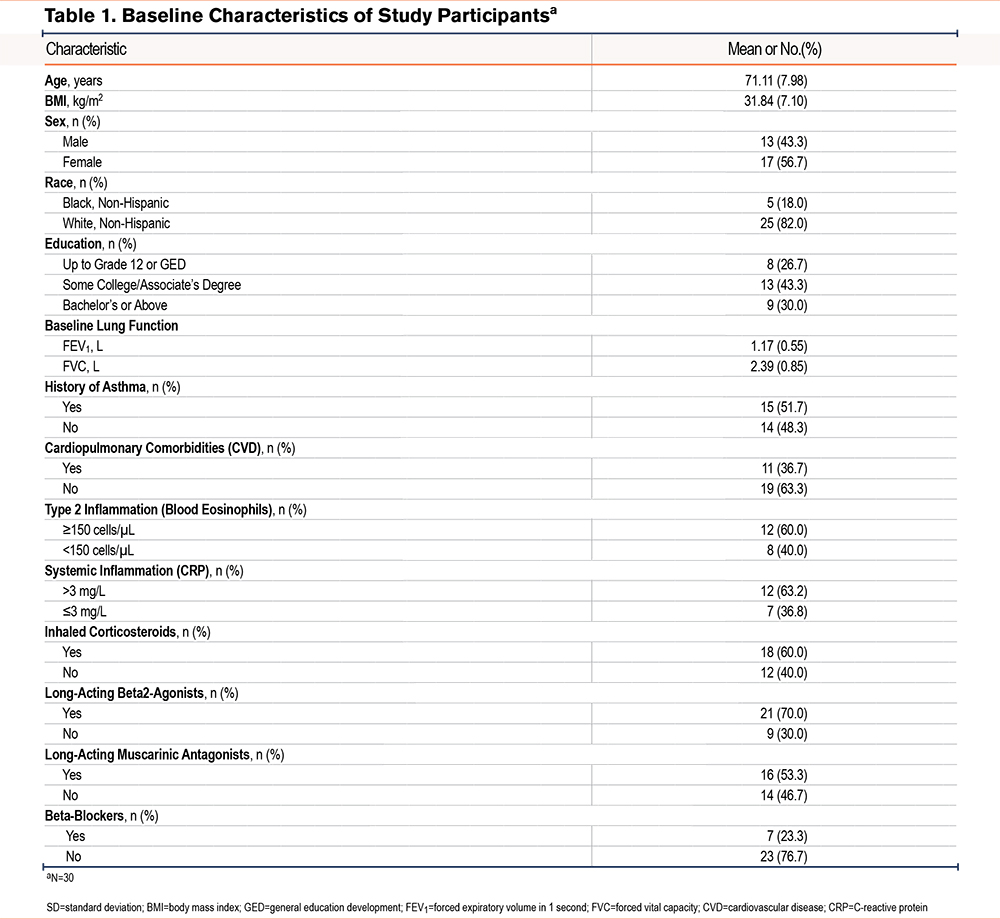
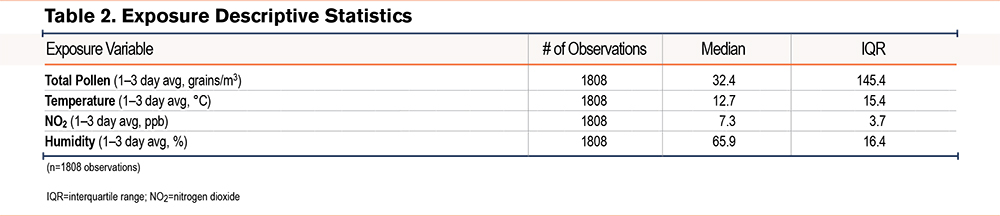
In this longitudinal study, we included 30 COPD participants with 1808 observations. Table 1 summarizes baseline population characteristics. Participants had a mean age of 71.1 years (standard deviation 8.4), those as female from birth were the majority (56.7%), were predominantly White (82%), and most had at least some postsecondary education. Across all study visits, the mean FEV1 was 1.2L, and FVC was 2.4L. The average within-participant variation was 0.13L for FEV1 and 0.24L for FVC. Table 2 outlines the distribution of exposures encountered by the study participants. Median exposure to pollen was 32.4 grains/m3 with an interquartile range (IQR) of 145.4 grains/m3.
Pollen Exposure and Lung Function Associations
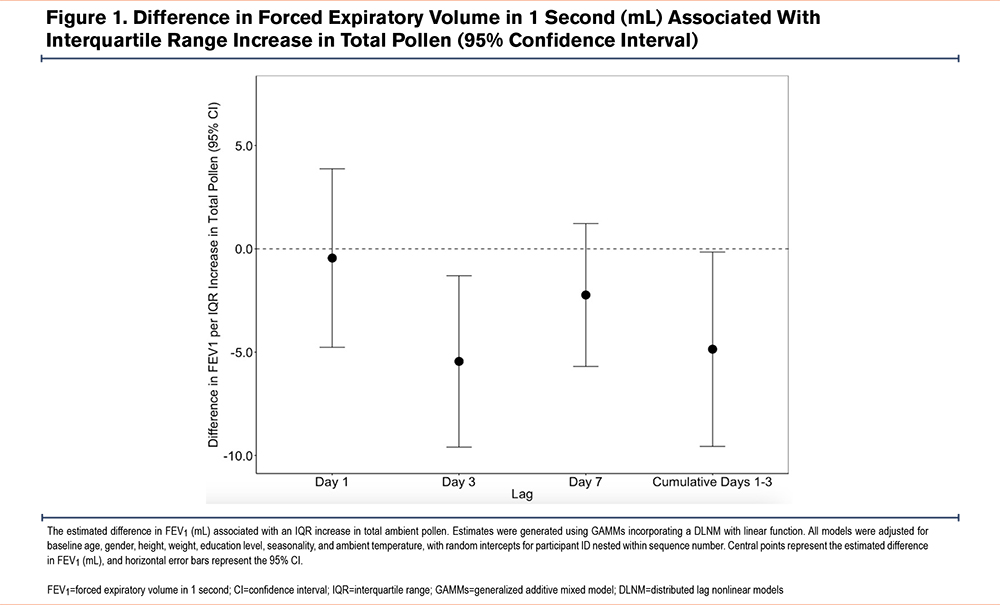
We observed an association between higher total pollen exposure at lag 3-day and lower FEV1 (Figure 1). Each IQR (145.4 grains/m3) difference in total pollen exposure was associated with a 5.5mL lower FEV1 (95% confidence interval [CI]: -9.7, -1.3). There was a cumulative association between higher total pollen exposure at lag 1–3 days with a lower FEV1 of 4.9mL (95% CI: - 9.6, -0.2). There was a similar pattern but nonsignificant cumulative association between higher total pollen exposure at lag 1–3 days and lower FVC of 7.9 (-15.9, 0.1) (Supplemental Table 1 in the online supplement). For the subtypes of pollen, we observed a negative pattern between higher tree and other pollen exposure at a 7-day lag and lower FEV1, although this association did not reach statistical significance, nor did we see similar negative patterns at Lag 1 or 3 days (Supplemental Table 2 in the online supplement).
Effect Modification
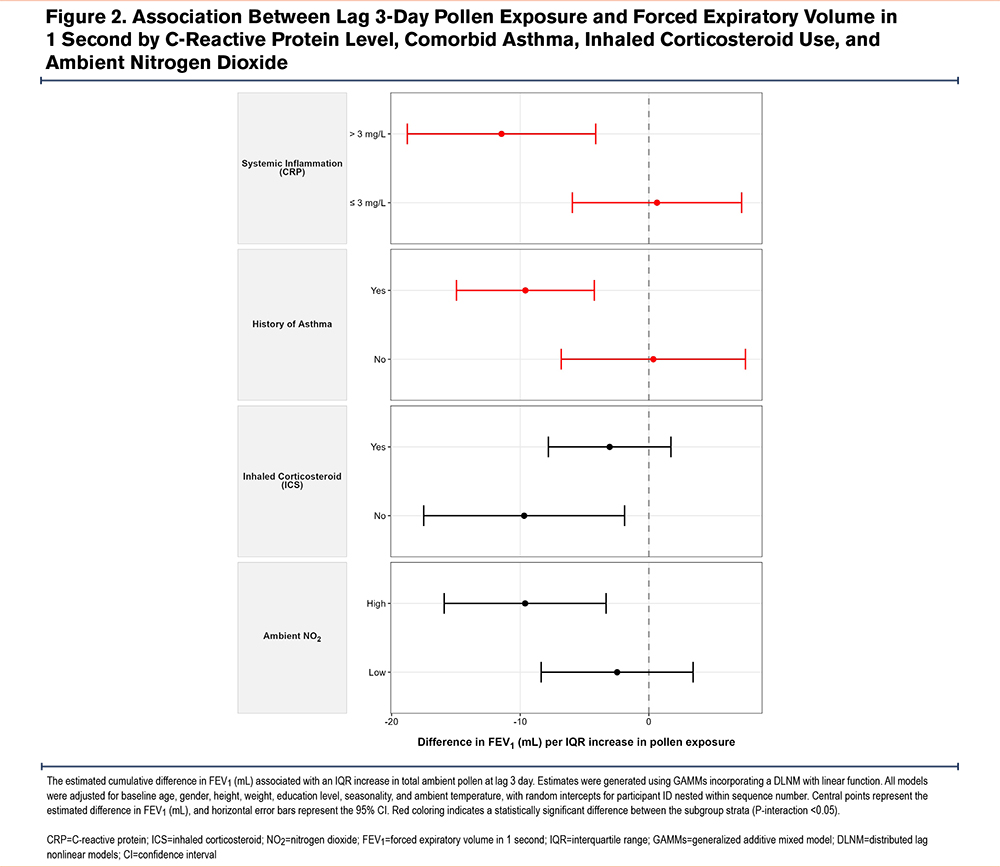
We observed that the association between total pollen exposure at lag 3 day and lower FEV1 was more pronounced among individuals with elevated baseline systemic inflammation (CRP>3mg/L) and a history of asthma (Figure 2, P-interactive<0.05 for both tests of effect modification). Similarly, the use of maintenance inhaler therapies (ICSs) appeared to slightly attenuate the association between pollen and lower FEV1 compared to nonuse, but this modifying effect was not statistically significant (P-interactive: 0.15). Furthermore, the negative association between pollen and 1 appeared slightly more pronounced on days characterized by high ambient NO2 exposure compared to low NO2 days, although this difference was not significant (P-interactive: 0.11). We found no evidence of interactive effects regarding eosinophils, CVD, other inhalers, and concurrent exposure to other ambient air pollutants (PM2.5 and O3) on FEV1.
For FVC the patterns of effect modification were similar to FEV1. However, no tests of effect modification were statistically significant, except for NO2 exposure. We found a stronger negative association with pollen exposure and FVC on days characterized by high concurrent ambient NO2 (-19.1mL; 95% CI: -30.9 to -7.3) compared to low NO2 exposure (-0.8mL; 95% CI: -12.4 to 10.8) per IQR increase in pollen (P-interaction<0.05).
Sensitivity Analyses
The cumulative association between pollen exposure at lag 1–3 days and FEV1 remained robust across multiple sensitivity analyses (Supplemental Table 3 in the online supplement). Upon adjusting for humidity, NO2, O3, and PM2.5, a significant negative association between total pollen and FEV1 was still observed. Our results also remained robust upon removing all covariates from our distributive model. Further, we performed a sensitivity analysis excluding Sundays through Tuesdays to account for weekend/holiday pollen averaging. We found that the direction and effect size of FEV1 (cumulative associations with lag 1–3 days) remained similar (-4.6mL 95% CI: -10.6mL, 1.3mL).
Discussion
In this longitudinal study of 30 COPD patients with 1808 observations, we found that higher short-term pollen exposure was associated with a lower FEV1. Short-term exposure to pollen at lag 3 days was associated with a 5.5mL lower FEV1, and the cumulative lag 1-3 day association yielded a similar effect size. This finding suggests that pollen may impair expiratory airflow in patients with COPD, with a possible cumulative effect that takes more than a day to develop.
While we found associations of pollen and lung function in our study of COPD patients overall, associations predominated among those with asthma-COPD overlap. Studies in asthmatic populations demonstrate that pollen can increase bronchial hyperresponsiveness in individuals, not classically "allergic."10,22,26 Our results are consistent with such past asthma literature, especially that of Erbas et al whose meta-analysis showed that acute pollen exposure is associated with reduced lung function and increased hospitalizations for emergency presentations due to asthma exacerbations.17 Previous evidence has also suggested that nonasthmatic people are susceptible to airway inflammation and respiratory effects of pollen exposure. A study of acute pollen exposure and respiratory hospital admissions found an association with COPD patients but not people with asthma.18
Throughout this study, we saw that the association of pollen on lower FEV1 appeared at lag 3 but not lag 1. This is consistent with asthma and atopy studies showing delayed airway responses to pollen. For example, Idrose et al found that grass pollen exposure was associated with airway obstruction 2–3 days after exposure in a cohort with atopy.27 Further, grass pollen was shown to have a lagged inflammatory response suggesting that pollen related inflammation may peak after a short lag.28
We saw that the association between pollen and lower FEV1 was modified by elevated systemic inflammation (CRP) and history of asthma. Systemic inflammation measures such as CRP have been found to be a raised in COPD patients and demonstrate an inverse correlation with FEV1.29,30 It is, therefore, plausible that higher CRP could modify and even exacerbate the pollen-reduced FEV1 relationship through augmented inflammatory pathways. While not statistically significant, we found that those who used steroid inhalers had a less pronounced association between pollen and FEV1, suggesting that palliation of inflammatory pathways in the airways may help prevent some of these effects.
We also explored potential modification by air pollutants, as prior studies have found that pollutants can synergistically enhance allergenicity and respiratory effects of pollen.31-33 We observed that the negative association between pollen and FVC was more pronounced on high-NO2 days for FVC with a similar pattern for FEV1. Previous experimental studies have shown that traffic-related air pollution can enhance the allergenic potency of pollen through nitration, synergistic oxidative stress, fragmentation, or a combination of all previously mentioned.31,34 Further, studies of diesel adjuvants have also shown that exhaust particles can increase immunoglobulin E production and airway inflammation upon allergen co-exposure.31,35 These findings indicate that individuals in urban residences with a multiple exposure profile of aeroallergens and pollutants may face compounded respiratory risks.
The study’s strengths include its longitudinal design with daily repeated spirometry using standardized home equipment. Further, the daily regional data on temperature and air pollutants allowed us to control environmental confounders. However, this study has limitations worth acknowledging. Despite multiple daily lung function measurements, the modest sample size of only 30 individuals limits statistical power and generalizability. Our use of a single regional pollen monitor may have introduced some exposure misclassification,36 although pollen levels tend to be consistent across urban environments.37 Further, exposure error may be related to the averaging of weekend values. While Sunday to Tuesday sensitivity tests showed no change in direction or effect size, such averaging may have introduced noise. Clinically, the low magnitude of FEV1 changes observed may be of limited concern in well managed patients but could become more consequential in those with advanced COPD with severely impaired lung function or multitrigger exacerbations. Finally, our reliance on a single regional monitoring station to estimate ambient pollen exposure may introduce spatial exposure misclassification. High-resolution spatiotemporal pollen models (e.g., 3km by 3km grids) were unfortunately not available for our specific study period (2017–2019). Importantly, however, our analysis focuses on acute, short-term health effects, which rely on day-to-day temporal variations in exposure rather than long-term spatial differences. Therefore, a central monitor may adequately capture the day-to-day temporal exposure variability required to assess acute respiratory effects.
Our findings have significance in the context of climate change. Pollen seasons are lengthening and pollen concentrations are higher as a result of climate change.7,8,19,20 For people with COPD and asthma-COPD overlap whose lung function is already impaired, any further obstruction or inflammation caused by pollen exposure could have clinical consequences. Patients with COPD may benefit from awareness of potential aeroallergen risks, particularly during high-pollen days and high pollen days in combination with urban air pollution. For individual patients, preventive interventions such as indoor air filtration and possible pharmacological therapies may be beneficial.38
Conclusion
Short-term increases in ambient pollen exposure were associated with lower FEV1 among COPD patients. As pollen seasons are lengthening and levels are increasing due to climate change, greater attention to the respiratory effects of pollen on COPD and the evaluation of potential prevention strategies are warranted.
Acknowledgements
Author contributions: MBR oversaw the SPACE study and primary data collection. JH and WN conducted primary statistical analysis with statistical guidance from BC. NN and PK oversaw collection and interpretation of pollen and pollution data. JH wrote most of the initial manuscript draft and MBR, AS, and NN wrote portions of the discussion. All authors contributed to interpretation of the results and contributed to the review and editing of the scientific manuscript.
Declaration of Interest
The authors declare that they have no competing interests.