Running Head: Airway Microbiota-Immune Axis in COPD
Funding Support: This work was supported by Hangzhou Xixi Hospital.
Date of Acceptance: July 16, 2026 | Published Online Date: July 28, 2026
Abbreviations: AECOPD=acute exacerbation of COPD; BMI=body mass index; CAT=COPD Assessment Test; CI=confidence interval; COPD=chronic obstructive pulmonary disease; ELISA=enzyme-linked immunosorbent assay; FEV1 %pred=forced expiratory volume in 1 second percentage predicted; GOLD=Global initiative for chronic Obstructive Lung Disease; IL=interleukin; IQR=interquartile range; LDA=linear discriminant analysis; LEfSe=linear discriminant analysis effect size; LL-37=cathelicidin; mMRC=modified Medical Research Council dyspnea scale; PCoA=principal coordinates analysis; PCR=polymerase chain reaction; PERMANOVA= permutational multivariate analysis of variance; QoL=quality of life; rRNA=ribosomal RNA; SD=standard deviation; SGRQ=St George’s Respiratory Questionnaire; SLPI=secretory leukocyte protease inhibitor; TNF-α=tumour necrosis factor alpha
Citation: Zhong Y, Wang M, Zhu Q. Dynamic changes in airway microbiota and immune homeostasis in patients with COPD and the implications for nursing management. Chronic Obstr Pulm Dis. 2026; 13(5): 373-385. doi: http://doi.org/10.15326/jcopdf.2026.0799
Online Supplemental Material: Read Online Supplemental Material (383KB)
Introduction
Chronic obstructive pulmonary disease (COPD) is a global public health problem because of its high prevalence, disability, and death rates, which together place a heavy burden on health.1 Acute exacerbations of COPD (AECOPDs) are a key stage of the disease. They bring a faster loss of lung function and worse breathing symptoms—cough, sputum, and dyspnea—as well as more hospital visits and readmissions. Together, these lead to a worse quality of life for patients. Therefore, a better knowledge of AECOPD mechanisms and better nursing care strategies are very important to improve COPD outcomes. Although traditional concepts about infection and inflammation still prevail, new microbiome studies show that the lungs are not sterile. The microbes living there have a key role in keeping immune balance and in disease progression.2,3
Recent microbiome research has revealed that the lungs harbor a resident microbiota that plays a key role in maintaining immune homeostasis.2,3 In healthy conditions, a dynamic balance exists between the airway microbiota and the host immune system. However, this balance is disrupted in COPD patients. Studies show that even during stable periods, COPD patients exhibit reduced airway microbial diversity and altered community structure.4 This dysbiosis worsens during AECOPDs, often manifesting as an ecological disturbance with increased relative abundance of Proteobacteria.5,6 Such microbial imbalance actively drives airway inflammation. For example, Haemophilus influenzae, Moraxella catarrhalis, and Pseudomonas aeruginosa can activate pattern recognition receptors on epithelial cells, leading to NF κB pathway activation and release of pro-inflammatory cytokines such as interleukin (IL)-8, IL-1β, and tumor necrosis factor alpha (TNF α).7,8 At the same time, immunomodulatory molecules like secretory leukocyte peptidase inhibitor (SLPI) may be suppressed, weakening host defenses.9,10 This bidirectional interaction network is called the "microbiota immune axis," and its imbalance is a core mechanism in COPD.11
Current COPD nursing practice relies mainly on general guidelines, lacking precision guidance tailored to individual biological states.12,13 Significant interindividual differences exist in microbiota composition and immune function, and therefore, the same nursing interventions may produce different responses.14 Predicting AECOPDs using only clinical symptoms has limited accuracy, and biomarkers are needed to improve prediction.15-17
Consequently, this study aims, through a large‑scale prospective cohort design, to systematically characterize the dynamic trajectories of airway microbiota structure and key immune markers across different disease stages in COPD patients and to explore their associations with clinical symptoms, quality of life, and nursing behaviors. While this observational design groups patients by disease stage rather than providing individualized treatment, the identification of stage‑specific biomarker profiles provides a foundational step toward future individualized risk stratification. The findings are expected to provide clinical nurses with novel assessment perspectives and intervention targets, promoting the evolution of COPD nursing toward an individualized, biomarker‑based precision management model (for a graphical abstract, click here).
Methods
Study Design and Ethical Approval
This research used a prospective observational cohort strategy. It was conducted in Hangzhou Xixi Hospital, Hangzhou City, China, a tertiary referral hospital with an established Department of Respiratory Medicine. The protocol was approved by the Ethics Committee of Hangzhou Xixi Hospital (approval number: HXH-EC-2025-011). Each participant provided written informed consent.
Study Participants
Participants were recruited from the respiratory outpatient clinics and inpatient departments of our hospital. A total of 284 eligible COPD patients were enrolled based on the conditions listed below.
Inclusion criteria included: (1) diagnosis of stable COPD meeting the Global initiative for chronic Obstructive Lung Disease (GOLD) criteria (GOLD grade 2–3).13 Clinical stability was defined as the absence of an acute exacerbation for at least 6 weeks before enrollment, no systemic corticosteroids or antibiotics in the preceding 2 weeks, and stable symptoms with only normal daily fluctuations13; (2) age 40–80 years; (3) good communication skills and ability to cooperate with sample collection, questionnaire completion, and follow-up procedures; and (4) willingness to provide written informed consent.
Exclusion criteria included: (1) use of systemic antibiotics or immunosuppressants within the past 4 weeks; (2) comorbidities with other major respiratory diseases (e.g., lung cancer, bronchiectasis, asthma), immunodeficiency disorders, or active infections; (3) cognitive impairment, psychiatric disorders, or other conditions precluding study cooperation; and (4) severe dysfunction of the heart, liver, kidneys, or other vital organs.
Study Procedure and Data Collection
Data collection was conducted at 3 time points: T0 (stable baseline), T1 (acute exacerbation, within 48 hours of symptom worsening), and T2 (postrecovery stable period, 8–12 weeks after exacerbation). Acute exacerbation (T1 sampling) was defined as an acute worsening of respiratory symptoms beyond normal day‑to‑day variation—comprising increased dyspnea, cough, and/or sputum volume or purulence—requiring a change in the patient's regular medication, consistent with the Anthonisen criteria and GOLD 2023 guidelines.13
Clinical Baseline Data
Demographic information (age, sex, ethnicity, educational level, occupation, marital status, body mass index [BMI], residence status), smoking history (pack years, smoking status), medical history, family history, pulmonary function indices (forced expiratory volume in 1 second percentage predicted [FEV1 %pred]), and frequency of acute exacerbations in the past year were collected.
Antibiotic Use and Smoking Confounders
Antibiotic use during the 4 weeks prior to each time point was recorded and categorized as none, oral, or intravenous. Smoking status was classified as current, former (quit >6 months), or never. Pack years were calculated. These variables were included as covariates in all multivariable models.
Sample Collection
Sputum samples were collected using a standardized hypertonic saline induction method. Briefly, participants inhaled 3% hypertonic saline via an ultrasonic nebulizer for up to 15 minutes. Expectorated sputum was visually separated from saliva using forceps under sterile conditions. Samples were processed within 2 hours: homogenization followed by centrifugation at 3000rpm for 10 minutes to separate supernatant and cell pellets. An additional high‑speed centrifugation at 12,000 × g for 10 minutes at 4°C was performed to ensure complete bacterial cell recovery. Cell pellets were collected as pellets after centrifugation and immediately stored at -80°C without any DNA preservative. All samples were thawed only once prior to DNA extraction.
Nursing Assessment Data
The COPD Assessment Test (CAT) was used to evaluate the impact of COPD on daily life. The modified Medical Research Council (mMRC) dyspnea scale assessed dyspnea severity. The St George's Respiratory Questionnaire (SGRQ) assessed quality of life. Inhaler adherence was assessed by dose counter and self‑report; patients with ≥80% of prescribed actuations were classified as high adherers. Adherence to nonpharmacological interventions was defined as consistent practice of breathing exercises (pursed‑lip or diaphragmatic breathing for ≥30 minutes/day, ≥5 days/week) combined with a balanced nutritional plan verified by a dietitian (protein intake ≥1.0g/kg/day and BMI maintenance ≥20kg/m2, assessed by a 3‑day food record and nurse verification). Patients meeting all 3 criteria were called “high nursing adherence” (n=148, 52.11%). Those meeting ≤2 criteria were “moderate/low adherence” (n=136, 47.89%).
Antibiotic Data
At T1, antibiotic treatment data were recorded. Of 284 patients, 198 (69.7%) received antibiotics: amoxicillin clavulanate (n=89, 44.9%), levofloxacin (n=56, 28.3%), and azithromycin (n=53, 26.8%). Duration was 5–7 days for 167 patients (84.3%).
Laboratory Analyses
Microbiota Analysis
DNA extraction: DNA was extracted from cell pellets using QIAamp DNA Microbiome Kit (Cat. #51704, QIAGEN; Hilden, Germany). Mechanical lysis was performed using bead beating with 0.1mm glass beads in a TissueLyser II (QIAGEN) at 30Hz for 5 minutes, followed by enzymatic digestion with proteinase K at 56°C for 10 minutes, as specified in the kit protocol. The integrity and purity of the DNA were then evaluated by spectrophotometric measurement, wherein an A260/A280 ratio falling within 1.8 to 2.0 was required to proceed to sequencing. For each sequencing run, negative controls included: (1) a blank DNA extraction control (sterile water processed through the entire DNA extraction protocol), (2) a no template polymerase chain reaction (PCR) control, and (3) a mock community positive control (ZymoBIOMICS Microbial Community Standard, Zymo Research, Cat. #D6300; Irvine, California). Negative controls (extraction blanks) and positive controls (ZymoBIOMICS Microbial Community Standard) were included in each batch.
PCR amplification: Amplification of the 16S ribosomal RNA (rRNA) gene V3-V4 region was performed with primers 515F (5′-GTGYCAGCMGCCGCGGTAA-3′) and 806R (5′-GGACTACNVGGGTWTCTAAT-3′). The thermal cycling program included an initial denaturation step (95°C for 5 min), 30 cycles of denaturation (95°C, 30 s), annealing (55°C, 30 s), and extension (72°C, 45 s), culminating in a final extension at 72°C for 10 min.
Sequencing and bioinformatics analysis: The PCR amplicons were size-verified by 1.5% agarose gel electrophoresis, then purified with AMPure XP beads (Beckman Coulter, Cat. #A63880; Brea, California) and quantified with Quanti‑iT PicoGreen (Invitrogen, Cat. #P7589; Carlsbad, California). Libraries were prepared with Nextera XT DNA Library Prep Kit (Illumina, Cat. #FC‑131‑1024; San Diego, California) and Nextera XT Index Kit v2 (Illumina, Cat. #FC‑131‑2001), then sequenced on the Illumina MiSeq platform using a v2 500‑cycle kit (Cat. #MS‑102‑2003). Samples were randomized across 4 MiSeq runs (≈70 samples per run). Batch effect was assessed by permutational multivariate analysis of variance (PERMANOVA) (R2=0.02, p=0.18). Bioinformatics analysis was performed using QIIME2 (v2023.7). Taxonomic assignment used the SILVA 138 99% OTU reference database trimmed to the 515F/806R region. Contaminant OTUs were removed using decontam (v1.10.0) with a prevalence threshold of 0.1. To define taxonomic units, sequences were clustered into OTUs at 97% sequence similarity. To obtain taxonomic profiles, OTUs were annotated using the SILVA database. Alpha diversity (Shannon, Chao1) and beta diversity (Bray‑Curtis) were calculated using the q2‑diversity plugin (QIIME2 v2023.7). Principal coordinates analysis (PCoA) was generated using scikit‑bio (v0.5.8). linear discriminant analysis effect size (LEfSe) analysis was performed using the galaxyhutlab online tool (LEfSe version 1.0). A STORMS checklist is provided as Supplementary File 1 in the online supplement.
Immune Marker Detection
Levels of IL-8, IL-1β, TNF-α, SLPI, and cathelicidin (LL-37) in sputum supernatants were measured using enzyme-linked immunosorbent assay (ELISA) kits (R&D Systems; Minneapolis, Minnesota) strictly according to the manufacturer's protocols. Absorbance was read at 450nm using a microplate reader, and concentrations were calculated based on standard curves.
Statistical Analysis
Statistical analyses were performed using SPSS (IBM; Armonk, New York) 26.0 and R 4.0.3 software (R Foundation; Vienna, Austria). Continuous variables were described as mean±standard deviation or median (interquartile range [IQR]) based on distribution. Group comparisons were conducted using t-tests, Mann-Whitney U tests, or repeated-measures analysis of variance. Categorical variables were described as frequency (percentage), with group comparisons using the χ2 test. Correlations between microbial indices, immune markers, and clinical scores were analyzed using Spearman's correlation. Multivariable linear mixed effects models were constructed to assess the independent association between microbiota indices (Shannon index, Haemophilus relative abundance) and immune markers, adjusting for age, sex, smoking status (current/former/never), FEV₁ %pred, and antibiotic use during exacerbation. Random intercepts were included for each patient to account for repeated measures. Models were fitted using lme4 (v1.1 35) in R. Haemophilus, Prevotella, and Veillonella were selected for correlation analysis based on LEfSe (linear discriminant analysis >4.0) and prior literature.5 For cross-sectional correlations, only one time point per patient was used (T1 for disease state, T2 for recovery). For longitudinal analyses, mixed effects models with patient random intercepts were used. Sensitivity analyses were performed: (1) excluding patients who received antibiotics within 2 weeks prior to T0 or T2 sampling; (2) stratifying analyses by smoking status; and (3) including pack years, current smoking status, and antibiotic use as fixed effects in mixed effects models. A p-value < 0.05 was considered statistically significant.
Results
Baseline Characteristics of Study Participants
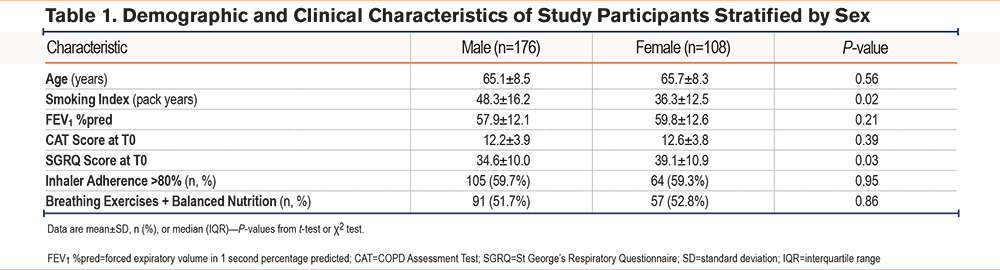
The study ultimately included 284 COPD patients (GOLD grades 2–3). All patients completed follow-up at T0, T1, and T2 without serious adverse events. Participants were predominantly male (61.97%), with a mean age of 65.3±8.4 years, a smoking history of 43.7±15.8 pack years, and a median (IQR) of 2 (1–3) acute exacerbations in the past year. Pulmonary function assessment showed a mean FEV₁ %pred of 58.6±12.3%, consistent with GOLD grades 2–3 severity. Clinical evaluation at T0 revealed a mean CAT score of 12.4±3.9, mMRC grades primarily distributed as 2–3 (54.93%), and a mean SGRQ score of 36.3±10.6. Table 1 presents data stratified by sex with p-values (t-test or χ2). No significant differences were found for age, FEV₁ %pred, or baseline CAT scores (all p>0.05). Males had significantly higher smoking pack years (48.3±16.2 versus 36.3±12.5, p=0.02). Females had higher SGRQ scores (39.1±10.9 versus 34.6±10.0, p=0.03). Inhaler adherence (>80%) was similar between sexes (59.3% in females versus 59.7% in males, p=0.95). Adherence to breathing exercises and balanced nutrition was also similar between sexes (51.7% in males versus 52.8% in females, p=0.86). These differences are adjusted for in all multivariable models. Detailed demographic and clinical characteristics are presented in Table 1.
Longitudinal Dynamic Changes in Airway Microbiota
Alpha-Diversity Changes
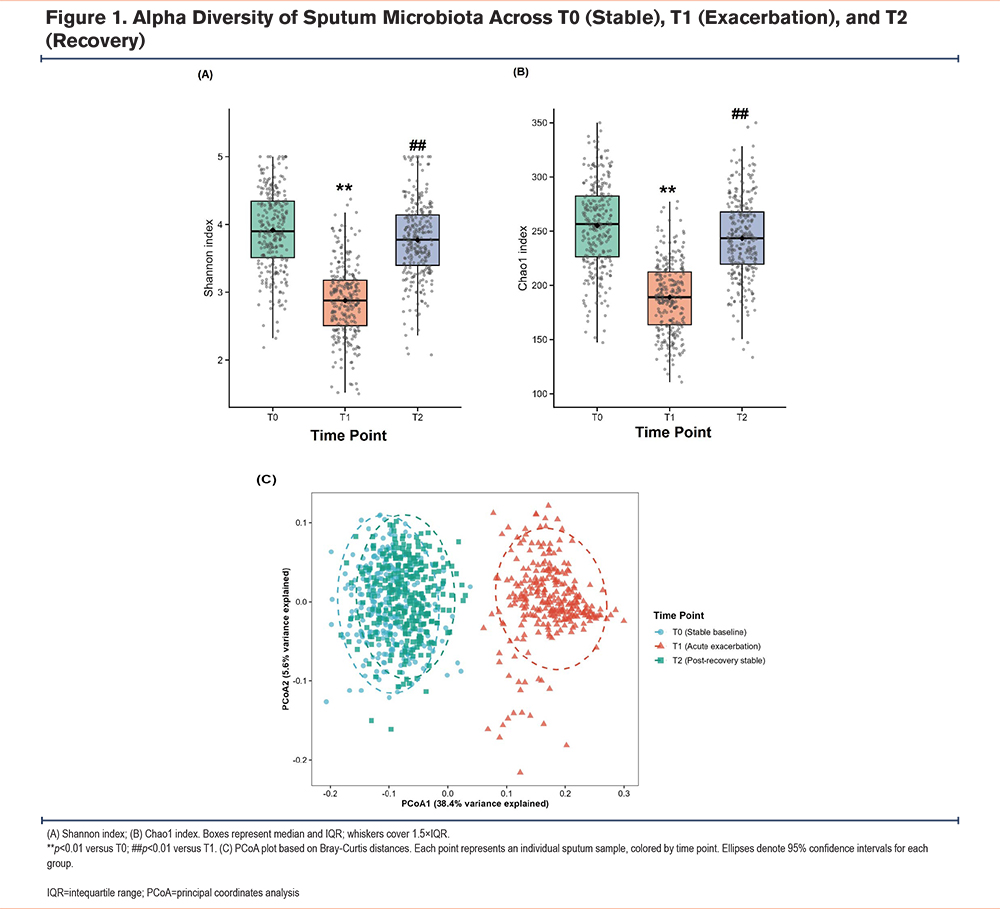
Alpha-diversity analysis revealed significant differences in microbial richness and diversity across the 3 time points. At T1 (acute exacerbation), both the Shannon index (2.87±0.53) and Chao1 index (189.62±31.45) were markedly lower than at T0 (3.92±0.61, 256.37±38.72) and T2 (3.78±0.58, 245.91±36.28) (F=89.62, 95.37, respectively; both p<0.01). No significant difference was observed between T0 and T2 for either index (t=1.89 and 1.76, respectively; both p>0.05), indicating a pronounced reduction in microbial diversity during exacerbation that tended to recover subsequently. The dynamic changes in α-diversity are shown in Figure 1(A, B).
Beta-Diversity Changes
PCoA based on Bray-Curtis distance demonstrated that the microbial community structure of sputum samples at T1 was significantly separated from those at T0 and T2 (PERMANOVA, R2=0.28, p<0.001). In contrast, no significant separation was found between T0 and T2 (R2=0.03, p>0.05). This indicates substantial remodeling of the airway microbiota community structure during acute exacerbation, with recovery to a state similar to the stable period. Beta-diversity analysis is shown in Figure 1C.
Changes in Relative Abundance of Key Microbial Genera
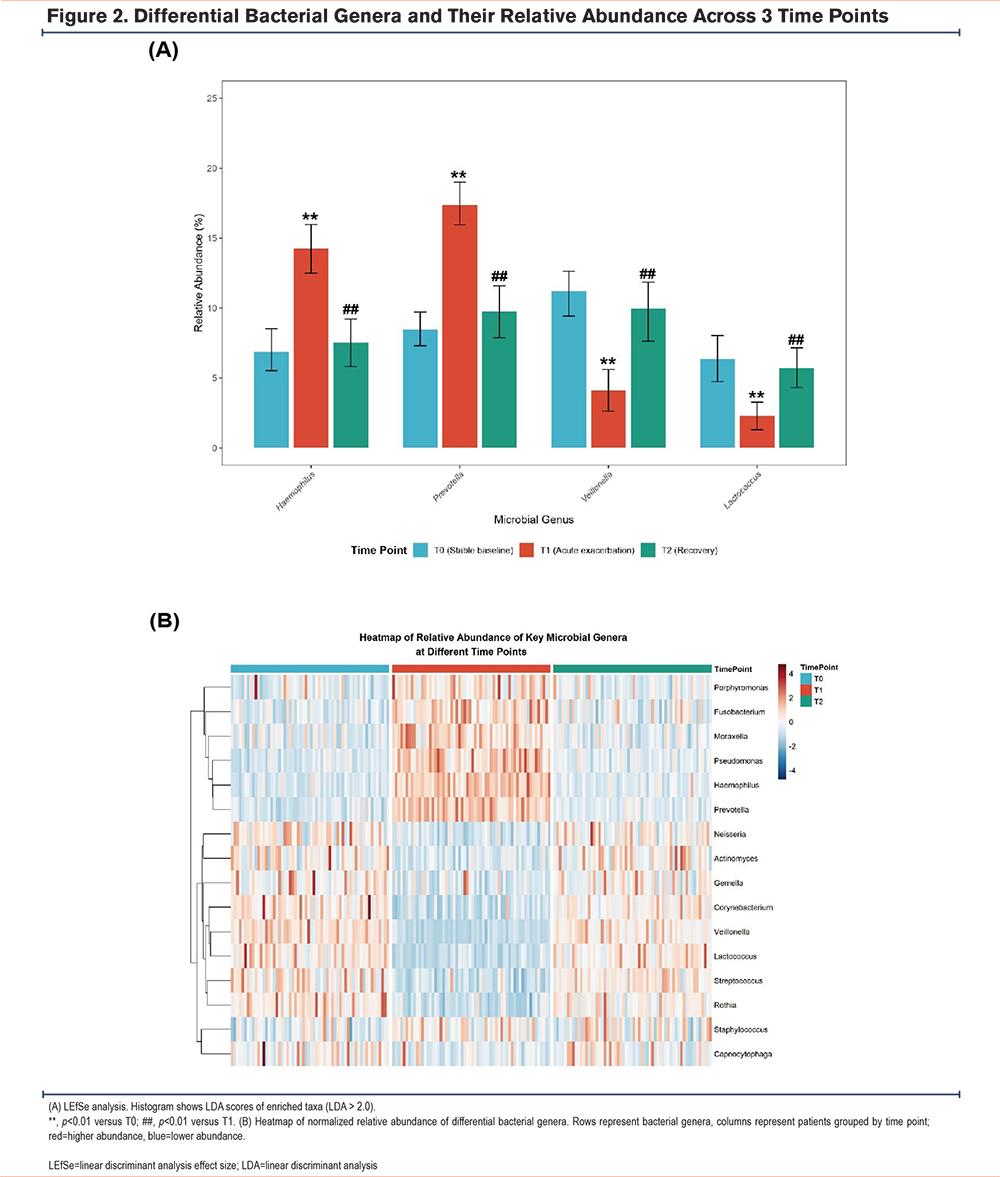
LEfSe analysis identified several microbial genera with significant differences across time points. At the genus level, the relative abundances of Haemophilus (15.32%±3.89%) and Prevotella (18.76%±4.23%) at T1 were significantly higher than at T0 (5.89%±1.96%, 7.21%±2.15%) and T2 (6.74%±2.08%, 8.53%±2.47%) (F=102.56, 118.73, respectively; both p<0.01). Conversely, the relative abundances of Veillonella (4.23%±1.56%) and Lactococcus (2.15%±0.87%) at T1 were significantly lower than at T0 (9.87%±2.89%, 5.32%±1.64%) and T2 (8.96%±2.64%, 4.89%±1.52%) (F=78.92, 65.37, respectively; both p<0.01). Details are shown in Figure 2A. The relative abundances of key differential microbial genera across the T0, T1, and T2 time points were computed and compared. To intuitively visualize these differences, a heatmap was generated. This comparative visualization is presented in Figure 2B.
Longitudinal Dynamic Changes in Immune Markers
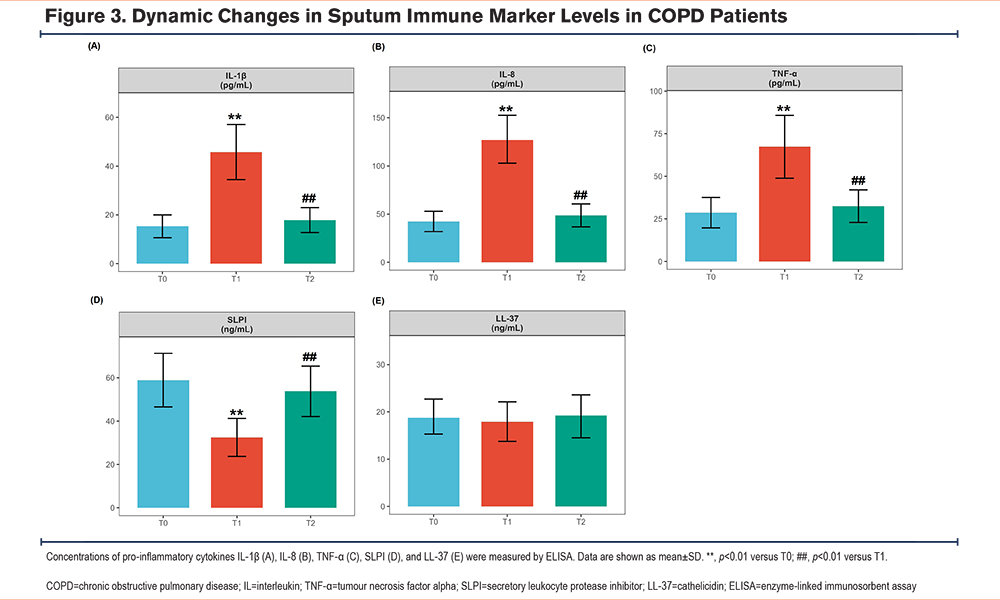
ELISA results showed significant dynamic changes in immune marker levels across disease stages. At T1, levels of pro-inflammatory cytokines IL-1β (45.76±11.28pg/mL), IL-8 (126.83±32.45pg/mL), and TNF-α (67.35±18.46pg/mL) were substantially higher than at T0 and T2 (p<0.01). In contrast, the level of the immunomodulatory protein SLPI (32.45±8.76ng/mL) at T1 was notably lower than at T0 (58.16±12.80ng/mL) and T2 (53.78±11.64ng/mL) (F=98.76, p<0.01). No statistically significant difference was observed for LL-37 levels across the 3 time points (F=2.37, p>0.05). These results are presented in Figure 3.
Impact of Antibiotic Therapy on Microbiome Recovery
To assess whether antibiotic use at T1 influenced microbiome recovery at T2, we compared patients who received antibiotics (n=198) with those who did not (n=86). Patients receiving antibiotics showed a similar degree of Shannon index recovery from T1 to T2 (ΔShannon=+0.91±0.42) compared to nonantibiotic patients (ΔShannon=+0.87±0.38, p=0.52). However, antibiotic treated patients had lower Veillonella relative abundance at T2 (7.12%±2.34%) than nonantibiotic patients (9.87%±2.91%, p=0.03), suggesting a modest delayed recovery of this commensal genus.
Sensitivity Analyses
When excluding patients with recent antibiotic exposure (n=42 excluded), the Shannon index differences between T0, T1, and T2 remained significant (p<0.01). Smoking status stratified analyses showed similar microbiota patterns across current, former, and never smokers, though current smokers had lower baseline Shannon indices (3.42±0.58 versus 3.89±0.61 in never smokers, p=0.04).
Associations Among Microbiota, Immune Markers, and Clinical Phenotypes
Correlations Between Microbiota and Immune Markers
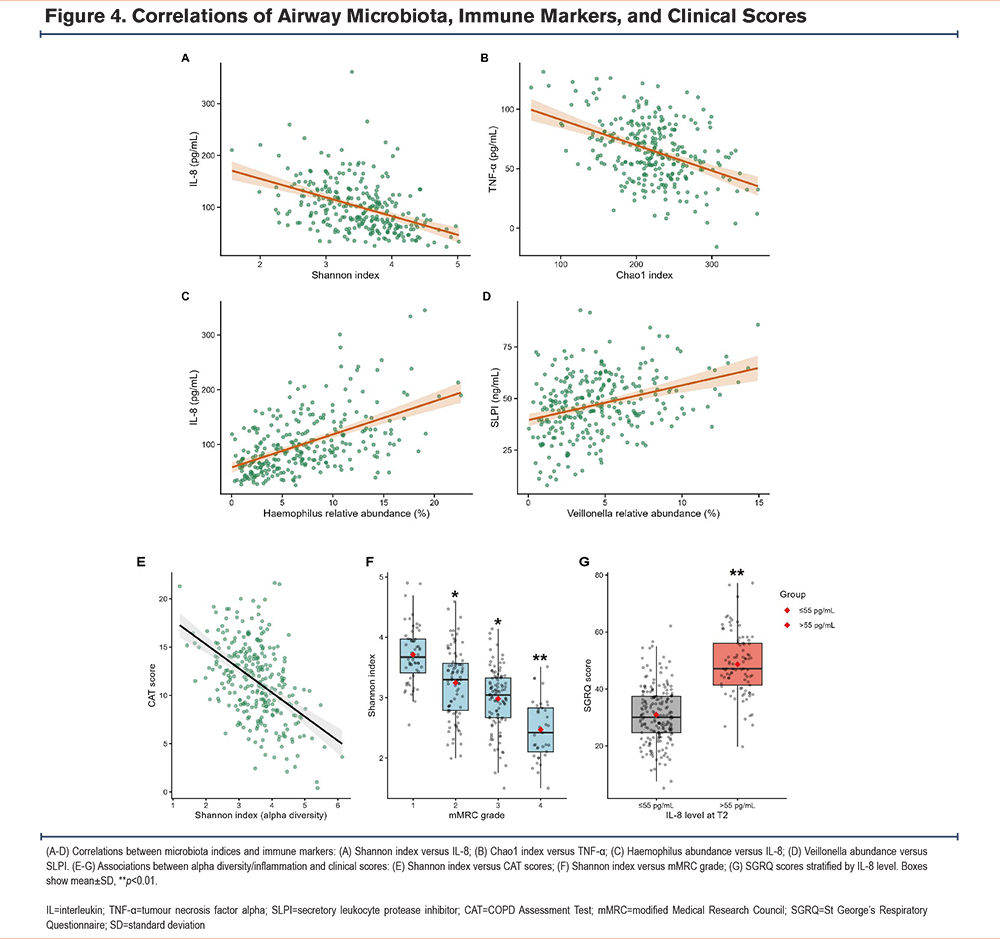
Spearman correlation analysis revealed a moderate positive correlation between the relative abundance of Haemophilus and IL‑8 levels (r=0.52, p<0.01), and a moderate positive correlation between Veillonella abundance and SLPI levels (r=0.41, p<0.01). Shannon index was negatively correlated with IL‑8 (r=‑0.48, p<0.01), and Chao1 index was negatively correlated with TNF‑α (r=‑0.42, p<0.01). In multivariable mixed effects models adjusting for age, sex, smoking status, FEV₁ %pred, and antibiotic exposure, Haemophilus abundance remained independently associated with IL-8 levels (β=0.38, 95% confidence interval [CI]: 0.21–0.55, p<0.001) and Veillonella abundance was independently associated with SLPI (β=0.33, 95% CI: 0.16–0.50, p=0.001). Scatter plots illustrating these correlations are shown in Figure 4(A-D).
Correlations Between Microbiota-Immune Indices and Clinical Scores
Shannon index showed significant negative correlations with concurrent CAT score (r=-0.45, p<0.05) and mMRC grade (r=-0.38, p<0.05). Patients with IL-8 >55pg/mL (n=89) had significantly higher SGRQ scores (45.37±11.89) compared to those with IL-8 ≤55pg/mL (32.64±9.76) (t=8.92, p<0.01). At T2, IL-8 levels were positively correlated with SGRQ scores (r=0.41, p<0.05). Analysis of microbiota-immune indices and clinical score correlations is shown in Figure 4(E-G).
Impact of Nursing-Related Factors on Microbiota and Immune Indices
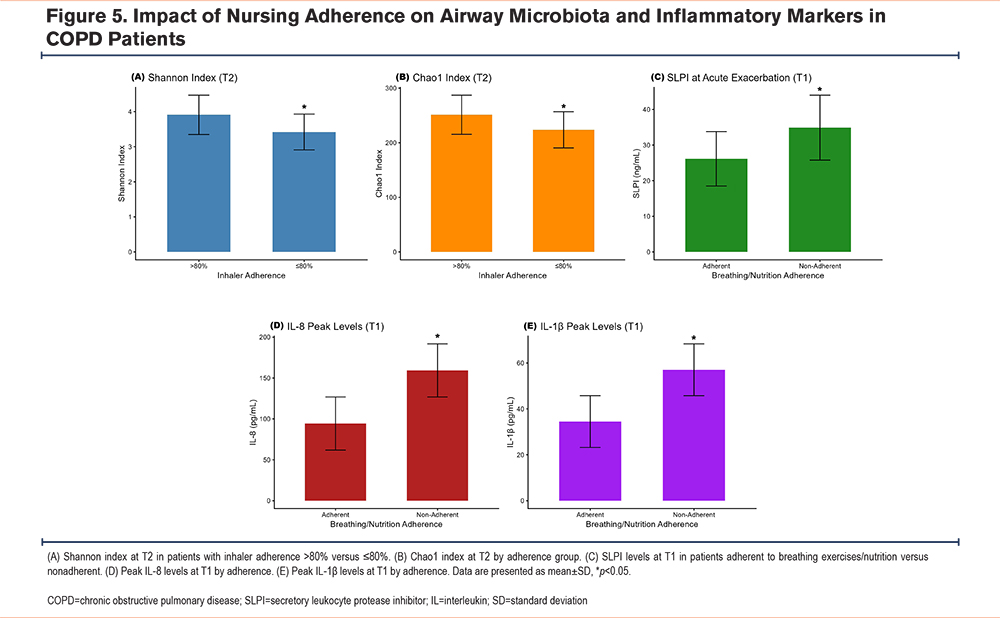
Analysis of nursing intervention adherence showed that patients with inhaler adherence >80% (n=169) exhibited significantly higher Shannon (3.91±0.56) and Chao1 (251.37±35.82) indices at T2 compared to those with adherence ≤80% (3.42±0.51, 223.64±33.15) (t=7.89, 6.74, respectively; both p<0.05). Patients who adhered to regular breathing exercises (≥30 minutes daily) and maintained balanced nutrition (protein ≥1.0g/kg/day, BMI ≥20kg/m2) (n=148) demonstrated a significantly smaller decline in SLPI levels during acute exacerbation (26.15±7.64ng/mL) compared to nonadherent patients (34.89±9.12ng/mL) (t=8.23, p<0.05), along with lower peak levels of IL-8 and IL-1β. These results are depicted in Figure 5.
Discussion
Through longitudinal observation of 284 COPD patients, this study describes the evolving patterns of airway microbiota and immune markers across stable, acute exacerbation, and recovery phases, and preliminarily explores the influence of nursing behaviors on this "microbiota-immune axis." While these correlations do not establish causality, they provide observational support for the concept that microbial dysbiosis and immune activation are linked phenomena in COPD exacerbation.11 Acute exacerbation is characterized by reduced microbial diversity, expansion of Haemophilus and Prevotella, elevated pro-inflammatory cytokines (IL-8, IL-1β, TNF-α), and decreased SLPI.18 Although microbiota partially recovers postexacerbation, persistent inflammation correlates with worse quality of life, confirming dysbiosis as a key pathological feature driving local inflammation.19,20
Within this axis, Haemophilus correlates positively with IL-8, while Veillonella abundance correlates positively with SLPI. Alpha diversity metrics, including Shannon and Chao1 indices, are inversely correlated with IL‑8 and TNF‑α, respectively. Notably, these genus‑level correlations refine earlier transcriptomic and metatranscriptomic reports that implicated broad Proteobacteria expansion in NF‑κB pathway activation.7,8,19 Pathogens may activate epithelial pattern recognition receptors to induce cytokine release,21,22 while commensals likely exert homeostatic effects via metabolites or barrier modulation.23,24 We acknowledge that the role of Prevotella in the airway is complex and context dependent. While our study found Prevotella abundance positively correlated with TNF α during exacerbation, other studies have demonstrated protective roles. Larsen et al reported that Prevotella spp. associated with healthy lungs induces limited neutrophilia and cytokine production compared to pathogenic Proteobacteria, suggesting a disease protective role.24 Segal et al showed that Prevotella enriched lung microbiota in healthy individuals was associated with lower inflammatory cytokine profiles.25 Bertelsen et al demonstrated that Prevotella spp. reduce Pseudomonas aeruginosa induced inflammation in cystic fibrosis bronchial epithelial cells.26 These findings suggest that Prevotella may exert immunomodulatory functions under homeostatic conditions, while its expansion during COPD exacerbation may reflect oral microaspiration or loss of niche competition rather than purely pathogenic colonization. The imbalance in this bidirectional interaction, particularly the co-occurrence of "pro-inflammatory flora" expansion and "beneficial flora" reduction during exacerbation, may collectively drive uncontrolled airway inflammation and tissue damage, thereby aggravating symptoms and accelerating lung function decline.20 Notably, the significant reduction of SLPI during exacerbation in this study, with its level positively correlated with Veillonella abundance, suggests that this protease inhibitor may serve not only as an inflammatory marker but also as a key mediator in microbial modulation of host defense. These findings offer important new perspectives and implications for COPD nursing management.
Traditional nursing assessment relies on clinical symptoms, pulmonary function, and questionnaires,27 lacking objective biological indicators. This study shows airway microbiota (e.g., Haemophilus/Veillonella ratio), alpha diversity measures (Shannon index), and inflammatory markers (IL-8, SLPI) dynamically reflect disease severity and correlate with CAT, mMRC, and SGRQ scores.28 This supports integrating these biomarkers into nursing assessment. Simple, rapid detection methods (e.g., sputum or exhaled breath condensate) could identify high-risk patients for early warning and stratified management.29,30 For example, patients with persistently high IL-8 or low SLPI require intensified anti-inflammatory education, symptom monitoring, and inhaler adherence optimization.
Notably, this study offers a novel observational framework linking nursing adherence to microbiota-immune recovery. High inhaler adherence correlated with better microbial recovery, while regular breathing exercises and balanced nutrition attenuated SLPI decline and pro-inflammatory peaks during exacerbation. Furthermore, while previous work has focused on pharmacological or purely clinical determinants of exacerbation risk, our data uniquely demonstrate that nonpharmacological nursing adherence (inhaler use, structured breathing exercises, and nutritional support) is independently associated with attenuated inflammatory peaks and faster microbial recovery. This aligns with emerging evidence that pulmonary rehabilitation and immunometabolic optimization can modulate airway ecology,31 but extends it by directly correlating nursing compliance metrics with microbiota‑immune axis homeostasis. Standardized pharmacotherapy may improve microbiota via baseline inflammation control,31 while nonpharmacological interventions enhance airway clearance and immunometabolism to reduce dysbiosis-induced inflammation.32 Thus, nursing practice should prioritize integrated, continuous interventions: correct inhaler technique, individualized respiratory training, and nutritional screening to maintain airway microecological and immune homeostasis.33 Together, these comparisons position our study not merely as a confirmation of dysbiosis in AECOPDs, but as a dynamic, behaviorally‑informed model that bridges microbial ecology, immune regulation, and precision nursing practice.
These findings also support future targeted microbial modulation therapies. Given the links between specific genera (Haemophilus, Prevotella, Veillonella) and inflammation, inhaled probiotics, prebiotics, or phages could be investigated to reshape airway microbiota and mitigate inflammation.
This study has limitations, such as its single-center design and the exclusion of gut microbiota, which should be addressed in future research through multicenter collaboration and multi-omics integration. In addition, this study relied on 16S rRNA amplicon sequencing, which yields relative rather than absolute abundance estimates. Relative abundance data are subject to compositionality constraints and cannot directly reflect changes in total bacterial burden across disease states.34 Future investigations should incorporate quantitative PCR targeting total bacterial 16S rRNA gene copy number alongside taxon‑specific assays for key pathobionts such as Haemophilus influenzae and Pseudomonas aeruginosa,35 to provide absolute abundance data and more precise quantification of pathobiont load during exacerbation and recovery. Given that species and strain‑level differences within genera such as Haemophilus and Prevotella carry distinct clinical and immunological implications, future work using shotgun metagenomics, which also provides functional pathway annotation, will be necessary to resolve genus‑level findings at the species level. Future research directions based on this study include developing microbiota-immune-based nursing risk assessment tools, validating personalized nursing interventions via randomized controlled trials, and exploring molecular pathways linking nursing measures to the microbiota-immune axis.
In summary, by revealing the dynamic interplay between airway microbiota and immune homeostasis in COPD patients, this study clarifies the pivotal role of the "microbiota-immune axis" in disease progression and closely links this biological insight to nursing practice. The findings support incorporating microbial and immune markers as a new dimension in nursing assessment and reinforce the importance of comprehensive nursing interventions in maintaining airway homeostasis and improving patient prognosis. This provides empirical evidence and a theoretical framework for advancing COPD nursing towards a more precise, individualized, and mechanism-informed direction.
Acknowledgements
Author contributions: YZ and QZ were responsible for the conceptualization of the manuscript. QZ supervised, provided project administration, and acquired funding. YZ was responsible for the methodology, and MW was responsible for data curation. YZ and MW were in charge of the investigation. YZ provided the formal analysis and MW provided the laboratory analysis. YZ wrote the original draft, and MW and QZ reviewed and edited the manuscript. All authors read and approved the final manuscript.
Data sharing statement: The 16S rRNA sequencing data generated during this study are not publicly available due to privacy restrictions but are available from the corresponding author on reasonable request. Other datasets used and analyzed during the current study are available from the corresponding author upon reasonable request.
Declaration of Interest
The authors declare that they have no competing interests.