Running Head: Quantitative Computed Tomography and Pulmonary Nodules
Funding support: This work was supported in part by a National Cancer Institute Core grant (P30CA086862) to the University of Iowa Holden Comprehensive Cancer Center, an American Lung Association Dissertation Award (LH-574107), and an American Lung Association Cancer Discovery Award (grant LCD-220717-N). The COPDGene Study was supported by National Heart, Lung, and Blood Institute grant U01 HL089897 and U01 HL089856. The COPDGene study (NCT00608764) is also supported by the COPD Foundation through contributions made to an Industry Advisory Committee comprised of AstraZeneca, Boehringer-Ingelheim, GlaxoSmithKline, Novartis, Pfizer, Siemens and Sunovion. The INHALE study was supported by Award Number R01CA141769 and P30CA022453 from the National Cancer Institute, Health and Human Services Award HHSN26120130011I and the Herrick Foundation.
Date of Acceptance: January 12, 2022 │ Published Online: January 12, 2022
Abbreviations: chronic obstructive pulmonary disease, COPD; quantitative computed tomography, qCT; least absolute shrinkage and selection operator, LASSO; ensemble of neural networks, ENN; area under the curve, AUC; computed tomography, CT; COPD Genetic Epidemiology, COPDGene®; Inflammation, Health, and Lung Epidemiology study, INHALE; National Lung Screening Trial, NLST; Global initiative for chronic Obstructive Lung Disease, GOLD; pulmonary function tests, PFTs; forced vital capacity, FVC; forced expiratory volume in 1 second, FEV1; segmental airway paths, sAP; coefficient of variation, CV; Hounsfield unit, HU; area under the receiver operating characteristic curve, AUC-ROC; information optimization, IO; Response Evaluation Criteria in Solid Tumors, RECIST
Citation: Uthoff JM, Mott SL, Larson J, et al; the COPDGene Investigators. Computed tomography features of lung structure have utility for differentiating malignant and benign pulmonary nodules. Chronic Obstr Pulm Dis. 2022; 9(2): 154-164. doi: http://doi.org/10.15326/jcopdf.2021.0271
Introduction
Chronic obstructive pulmonary disease (COPD) is characterized by obstructive lung function. Evaluated with medical imaging, COPD is heterogenous with varying presentations of structural changes in the lung parenchyma and airways. COPD is a risk factor for lung cancer development, independent of smoking history.1,2 Prior studies that included pulmonary function testing and qualitative imaging assessment using computed tomography (CT)2-4 have shown links between COPD features and risk of lung cancer. There has been limited published research into the overlap of the COPD-related quantitative-CT (qCT) measures and pulmonary nodules and risk of lung cancer. Most studies have compared individuals with a lung cancer diagnosis to individuals without pulmonary nodules.2,5-10 Extent of emphysema in the lungs has been shown to be a positive predictor of lung cancer5-7,9-11; qCT airway measures have also been assessed for potential predictive benefit, yet no significant discriminatory ability has been demonstrated.7,11 However, many of these studies have not focused on controls with nodules. Here, we investigate a population with identified nodules that present a significant post-CT imaging challenge in the selection of the appropriate follow-up procedure.
We investigate the utility of objective and automatically obtained qCT metrics in predicting individuals with lung cancer on a cohort of scans all of which include solitary pulmonary nodules ≥4mm. Here, the nodule was not extracted or segmented from the scans prior to qCT feature extraction. We hypothesize that qCT features from the lung, lobe, and airway tree related to the location of the pulmonary nodule can be used to provide informative malignancy risk assessment, without requiring segmentation of the pulmonary nodule. Ultimately, for a risk assessment pipeline to be most clinically helpful, there should be the requirement for as little human effort as possible. The performance of the least absolute shrinkage and selection operator (LASSO) regression analysis and an ensemble of neural networks (ENN) were compared for feature set selection and classification on qCT features and demographical/clinical characteristics.
Materials and Methods
Study Population
The study cohort was comprised of individuals retrospectively collected with institutional review board approval from 3 prospective research studies: the COPD Genetic Epidemiology Study (COPDGene®),12 the Inflammation, Health, and Lung Epidemiology Study (INHALE),2 and the National Lung Screening Trial (NLST).13 Inspiratory CT data was collected from multiple institutions following a standardized protocol. Demographic and basic clinical features were obtained from parent studies (Table 1).
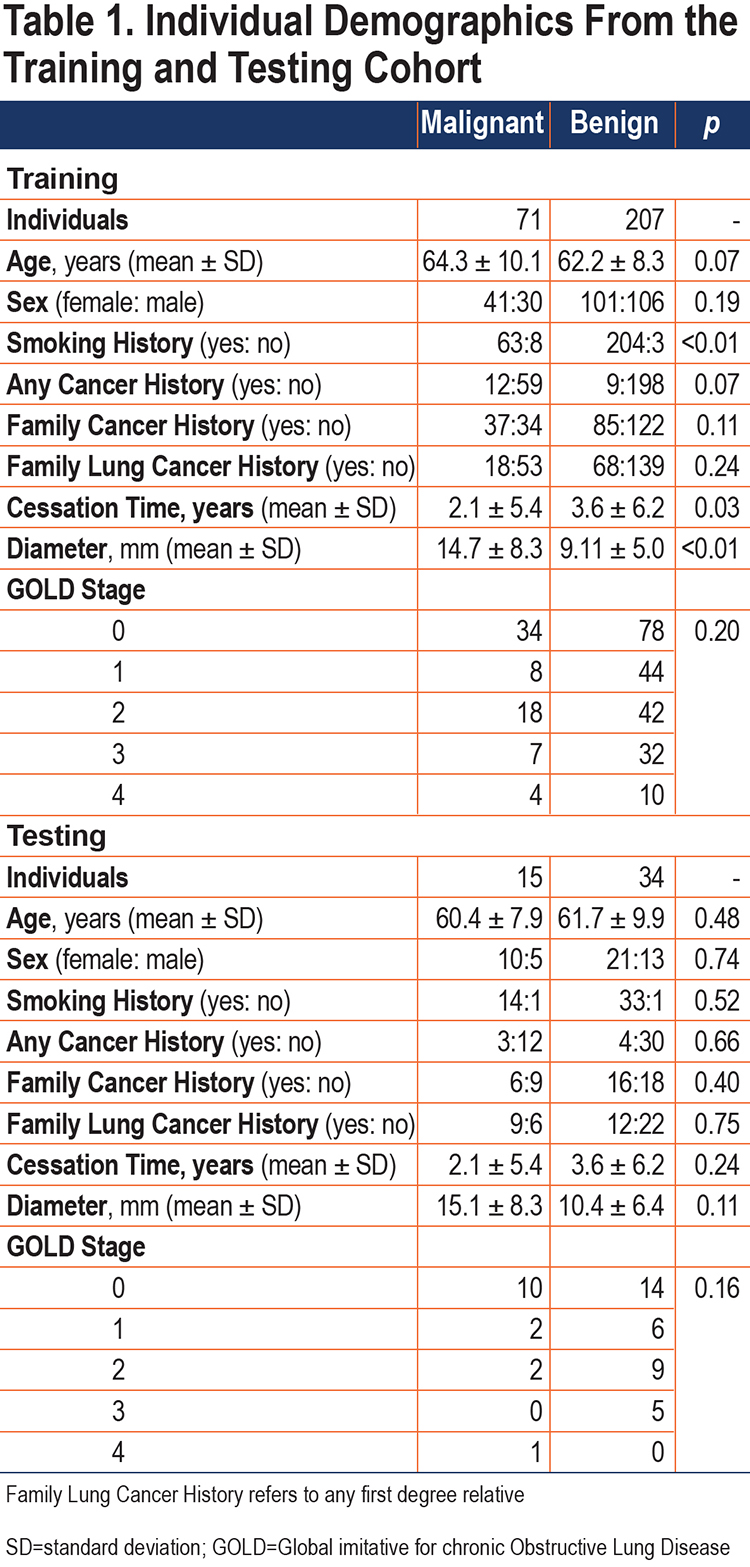
The established study cohort included 327 individuals with solitary pulmonary nodules (86 with primary lung cancer diagnosis) who underwent CT prior to diagnosis. The criterion for inclusion in this study was based on the availability of diagnostic information: malignant nodules were confirmed on histopathology, and benign nodules were diagnosed by histopathology and/or stability/resolution on more than 24 months follow-up. Diagnosis of COPD was not an inclusion criterion of the study, with 42% of the cohort having no COPD (Global initiative for chronic Obstructive Lung Disease14 [GOLD] 0) and 58% having COPD (GOLD 1–4). The individuals were sectioned into a training cohort (n=278) and a testing cohort (n=49), using class-persevering random selection.
Feature Groups
Two feature groups were collected and analysed for predictive capabilities: (1) Clinical and (2) Imaging qCT. Clinical features required input from a human based on recollection of the patient, clinical testing, or image reader assessment. Imaging qCT features were automatically extracted from the CT datasets using Apollo software suite (VIDA Diagnostics).
Clinical Features:
A subset of this study’s cohort was previously used to investigate the utility and consistency of post-imaging mathematical prediction models for the differentiation between malignant and benign lung nodules.15 The clinical predictive values collected were included as clinical features including: 7 measures of individual-provided historical information (age, sex, smoking history, cessation time, history of cancer, family history cancer, family history lung cancer), radiologist-reported maximum in-plane diameter, and 4 pulmonary function tests (PFTs) including forced vital capacity (FVC) percent predicted, forced expiratory volume at 1 second (FEV1) percent predicted, FEV1/FVC, and GOLD stage.
Imaging Features:
In total, 183 qCT measures were available for model development. qCT characteristics of the parenchyma and airways (segmental branches) were extracted (Apollo, VIDA Diagnostics). Parenchyma measurements were calculated across the whole lung (Lung) or isolated from the lobe containing the pulmonary nodule (Lobe). Measures from the segmental bronchi were incorporated across the whole lung (Lung), from 5 selected airway pathways passing through RB1, RB4, RB10, LB1 and LB10 (segmental airway paths [sAP]) and limited only to the bronchi in the lung lobe containing the pulmonary nodule (Lobe). The diversity in measurements throughout the lung was captured by incorporating the coefficient of variation (CV) in the measurements across all lobes, calculated using the “raster” package in the R statistical programming language.16
Parenchymal characteristics were captured through Hounsfield unit (HU) intensity, from the lung tissue including HU histogram mean, standard deviation, and skew. Areas of low tissue density were captured as the percentage of lung volume less than -910 HU (percentage below -910 HU), and high tissue density regions were represented as the percentage of lung volume above 0 HU (percentage above 0 HU). Total, tissue, and air volumes were also included.
Airway characteristics included wall thickness, diameters, perimeters, areas, and wall area fraction. Another commonly utilized airway metric of wall thickness at a standardized internal airway perimeter of 10mm (Pi10) was included.
Application of Statistical and Machine Learning Techniques
Chi-squared or Fisher’s exact test (if >20% of cells had expected frequencies <5) were used to compare categorical variables, and Wilcoxon rank sum tests were used to compare continuous variables between patients based on diagnosis each for the training and testing sets. The models were developed using 3 feature pools: qCT (imaging features only), Clinical (clinical features only), and qCT+Clinical (qCT features alongside the clinical features). Model performance was estimated with area under the receiver operating characteristic curve (AUC-ROC) and compared with the method of Delong. AUC-ROC is also known as the c-statistic and represents the probability that a higher risk will be assigned to a randomly chosen true high-risk case (here, cancer) than a randomly chosen low risk case (here, non-cancer).17-19
Multivariable Model Development:
Using the training dataset, LASSO models were applied to identify prognostic predictors of nodule malignancy status. LASSO model performance on the training set was estimated with 100 repeats of 10-fold cross-validation. The model derived in the building phase was applied to the testing dataset. AUC-ROC was used as the measure of model performance.
Ensemble Neural Network Model Application:
The machine learning pipeline described in Uthoff et al was implemented with the following modifications.15 Lung parenchyma and airway image segmentation and feature extraction was implemented using the Apollo software. No segmentation or feature extraction of the pulmonary nodule(s) was required. Highly correlated features were reduced to a single representative feature through k-medoid clustering and mutual information optimization (IO) was used to rank informative predictors for feature selection. The selected feature set is used to train an ensemble of neural networks (ENN). We apply the techniques developed for feature set reduction, selection, and classification to feature groups qCT and qCT+Clinical. The final trained models (development) were applied to the independent testing cohort.
Results
Statistical and Machine Learning Technique Results
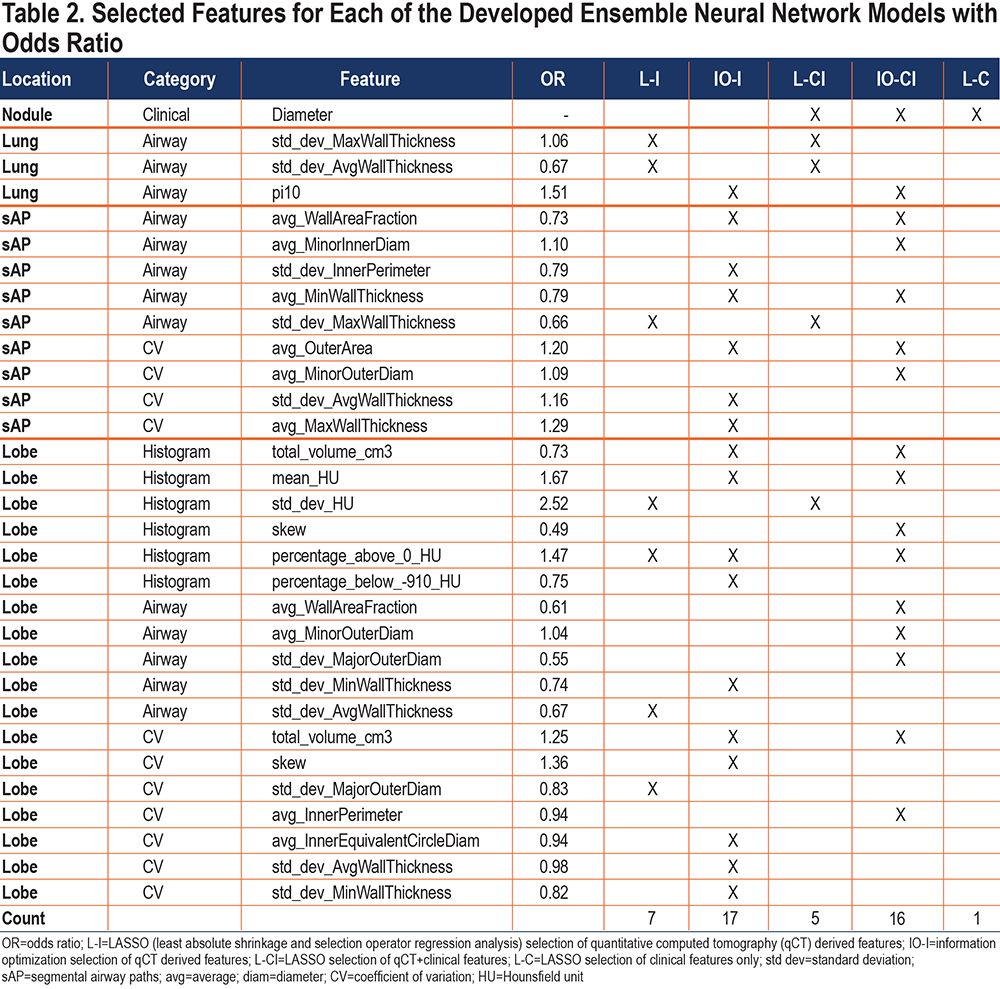
The set selection methods (multivariable and IO) were applied to the feature pools qCT and qCT+Clinical. Table 2 indicates the features selected in each of the models. In total, 30 features were selected as predictors in 1 or more of the models. There was minimal overlap between the features selected by multivariable and IO methods (2 features overlap – lobe percentage above 0 HU and diameter). Table 3 shows the performance of the feature set selection methods (LASSO, IO) and classification methods (LASSO, ENN).
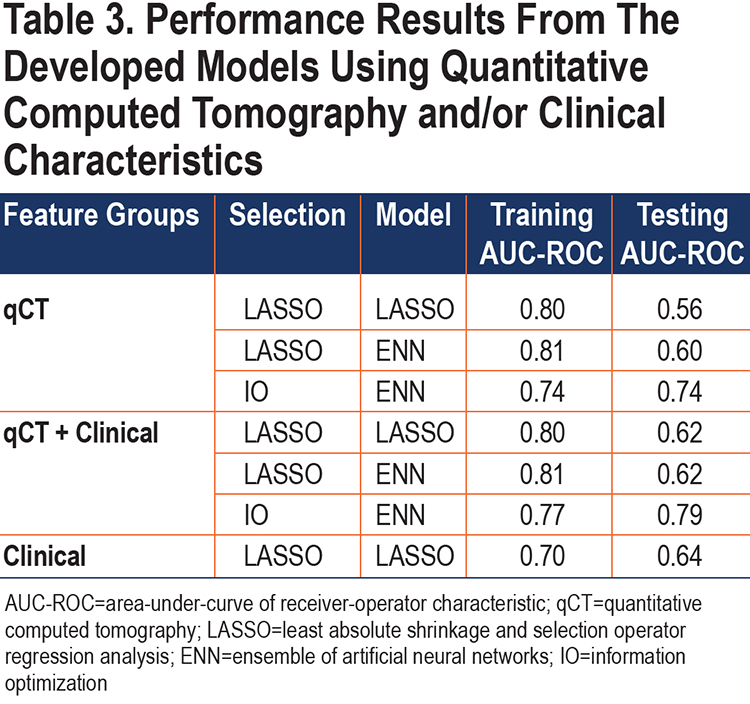
Multivariable Analysis Selects Diameter and qCT Features for Highest Training Performance:
The multivariable analysis yielded a model that incorporated qCT features from the airway tree, whole lung, and lobe (Table 2). Selecting only automatically extracted imaging features for model development included 7 measures, with a training AUC-ROC of 0.80 and a testing AUC-ROC of 0.56 – indicating overfitting of the training dataset (Table 3). Allowing the model to select clinically ascribed features from radiologist or participant input produced a model that included diameter and 4 qCT features, with a training AUC-ROC of 0.80 and testing AUC-ROC of 0.62; the improvement in testing AUC-ROC could point to size bias within our cohort. A model developed using only clinical/demographical features included only the diameter, with a training AUC-ROC of 0.70 and testing AUC-ROC of 0.64.
Ensemble Neural Network Schema Improves Testing Performance of Multivariable Selected Imaging Features:
The features selected through multivariable model development were used to train ENN models. The resulting training performance was similar to the multivariable model training performance, however, the resulting testing performance from the ENN model was higher (AUC-ROC of 0.60) for the qCT-only features model compared to the multivariable testing (AUC-ROC of 0.56). This indicates the ENN classification performance is more stable on new cases.
Combination Medoids-Information Optimization and Ensemble Neural Network Less Likely to Over-train than Multivariable Approach:
While the multivariable selection method for features obtained higher training AUC-ROCs for both feature pools (qCT+Clinical and qCT-only), the testing AUCs for these models implied potential overfitting, particularly with the qCT-only features (Table 3). This overfitting persisted in the ENN trained sample with the multivariable selected features indicating the overfitting is occurring during feature set selection. In contrast, the Medoids-IO selection followed by ENN model development obtained testing AUCs that were more consistent with the training AUCs. Delong’s analysis of the testing AUCs demonstrated that the qCT+Clinical Medoids-IO selected ENN model (testing AUC-ROC of 0.79) was significantly better on new cases than the qCT+Clinical Multivariable selected ENN model (p≤ 0.01) and the qCT-only Multivariable selected ENN model (p=0.01). While the qCT-only IO selected ENN model also had a high testing AUC-ROC of 0.74, it was not statistically better than the qCT+Clinical Multivariable selected ENN model (p=0.14) or the qCT-only Multivariable selected ENN model (p=0.08).
Quantitative Imaging Feature Importance
Nodule Diameter is the Only Clinical Feature Selected by Both Multivariable and Information Optimization Approaches:
The nodule diameter, measured as the Response Evaluation Criteria In Solid Tumor (RECIST) diameter, was the only clinical characteristic selected by the models. This could be due to the size bias that is seen in the cohort of pulmonary nodules –with cancerous nodules tending on average to be larger than their benign counterparts. The LASSO model using diameter achieved a training AUC-ROC of 0.70 and testing AUC-ROC of 0.64. Diameter was selected in both LASSO and IO selection methods. The addition of clinical characteristics did not significantly improve the performance of either LASSO or IO set selection in ENN development (p > 0.05). The addition of clinical characteristics in IO set selection did significantly improve the testing AUC-ROC over LASSO set selection without clinical features (p=0.02).
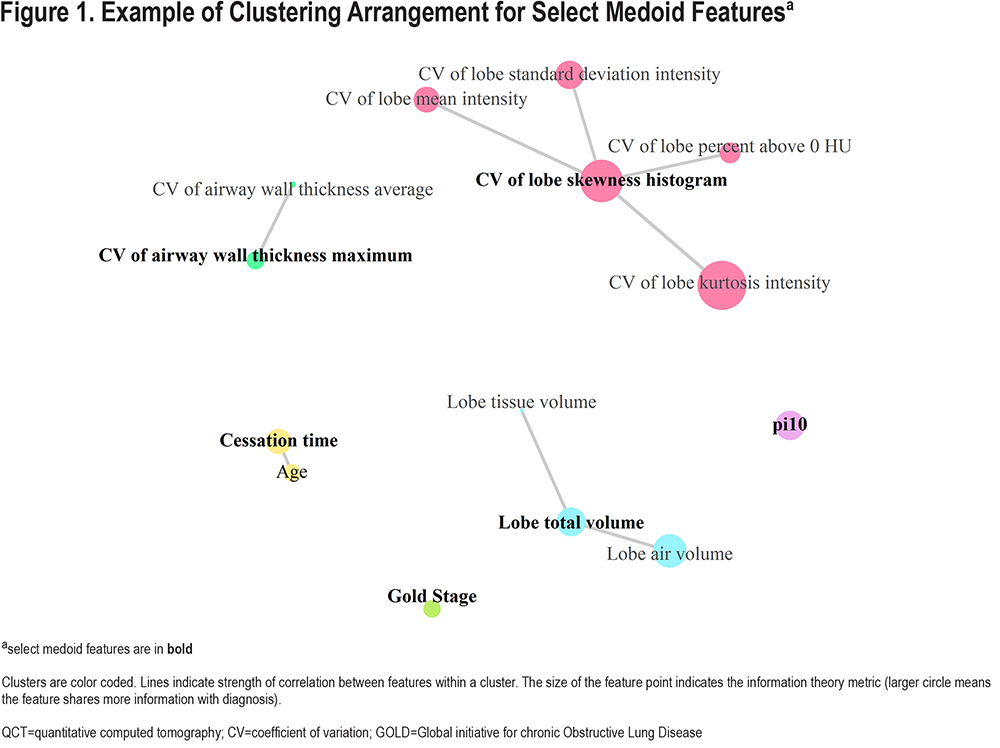
K-medoids Clustering Interrogates Feature Correlations:
For the full training dataset, k-medoid clustering with the optimal k produced 37 clusters. Example clustering of qCT features and clinical features is shown in Figure 1. Across 10-fold cross validation, clustering of the qCT features using k-medoids method showed that 21 were stable (medoids in all 10 folds) and an additional 6 (27 total) were semi-stable (medoids in at least 8 of the 10 folds). Of note, the lobe standard_deviation HU qCT feature, which was selected in both the multivariable models, was not selected as a medoid in any of the 10-folds; instead, it was either a member of the cluster with representative lobe mean HU (8 folds) or lobe skew (2 folds).
Multivariable and Information Optimization Select Vastly Different qCT Features:
Comparing the features selected by the 2 methods, only nodule diameter and the lobe percentage above 0 HU were common (Table 2). This is likely largely due to the feature-set reduction by k-medoids performed prior to IO-set selection. Of the features selected by the multivariable model, only 2 (diameter and lobe percentage above 0 HU) were selected as a medoid during 10-fold cross-validation k-medoids clustering. As such, none of the remaining multivariable selected features were available for IO-set selection. The IO method selected more CV features than the LASSO selection method which only selected the CV of the Standard Deviation of the Major Outer Diameter using the qCT feature pool. The selected CV features were predominately from the airways.
Features Related to the Location of the Pulmonary Nodule:
Table 2 illustrates that qCT features derived from the lobe containing the pulmonary nodule are incorporated to differing degrees across the model configurations. The qCT Medoids-IO selected ENN model included the most lobar features (n=10), while the qCT+Clinical Multivariate selected ENN model included the least lobe derived features (n=1). The qCT+Clinical Medoids-IO selected ENN model, which achieved the highest testing performance (AUC-ROC=0.79), included 9 lobar qCT features; 4 features from the parenchyma histogram, 3 features from airways, and 2 CV features.
Discussion
This study has demonstrated the potential richness in extra-nodular, automatically extracted imaging-derived features for the distinction between individuals with malignant and benign pulmonary nodules. It has highlighted the utility of more advanced methods of qCT feature selection for less overtraining. Here, we extracted and included in the analysis many features in an exploratory manner instead of selecting a small subset of specific features as has predominately been reported previously. As such, we have found that the ENN system with IO was advantageous for the exploratory manner of feature selection.
Prior works with qCT have primarily focused on the associations with lung cancer, irrespective of pulmonary nodule presence. These works have reported mixed results in the benefit of whole lung qCT features for lung cancer risk assessment. Studies by Carr et al, Chubachi et al, and Gagnet et al indicated that increased low attenuation area percentages, indicative of CT-characterized emphysema, were higher in individuals who developed lung cancer.5,6 Studies by Gierada et al and Wille et al did not find statistically significant differences but indicated that emphysema was more frequently seen and at a higher grade in individuals with lung cancer.7,8 Bae et al investigated whole lung and lobar qCT emphysema ratios, finding the odds of lung cancer increased in lobes with more severe emphysema.9 However, work from Wilson, Maldonado, and Johannessen showed no statistical evidence in quantitative lung parenchyma and/or airway measures and risk of lung cancer.3,4,11 Schwartz et al found in multivariable modelling only the expiratory qCT measure, percentage below -856 HU, and PFT characteristics were independent predictors of lung cancer risk.2 In contrast to the prior publications, this study consisted only of individuals with a pulmonary nodule (diagnosed malignant or benign tumor), a subset that may be highly relevant in lung cancer screening programs where solid pulmonary nodules require rigorous follow-up. One qCT feature associated with emphysema or low tissue density regions, percentage below -910 HU, was selected as a feature but only in 1 model. However, associated information may have been captured indirectly by the selected features, mean HU, standard deviation of HU, and the skew.
This study did not segment the pulmonary nodule or remove it from the analysis. Previous machine learning works have looked at qCT features extracted solely from the nodule20-24 and from the lung tissue immediately surrounding the nodule15,24,25 with high performance in training (AUC-ROC=0.84-1.0). The features extracted for these tools incorporated intensity, shape, size, border, and texture; a recent multi-institutional study by the quantitative imaging network has demonstrated that quantification of the same image features can vary between groups.26 In this study, we extracted qCT measures using the Apollo proprietary software package (Food and Drug Administration approved, Conformité Européenne certified for clinical use in the United States and Europe); this allows for consistency in the method of quantification of features beyond what can be expected for in-house developed features.
The best performing model from this study, qCT+Clinical Medoids-IO selected ENN model, included many features from the lobe of the lung that contained the pulmonary nodule. This is supportive of the study hypothesis that qCT features from the lung, lobe, and airway tree related to the location of the pulmonary nodule can be used to provide informative malignancy risk assessment, without requiring segmentation of the pulmonary nodule. The high predominance of airway features selected in all the models was somewhat unexpected. This warrants further investigation as it is not clear if these features are differentiated due to the presence of cancer or potentially indicative of structural airway features of populations more at risk for lung cancer development.
It was surprising that diameter was the only clinical feature selected, particularly as the features included have been utilized in previously published lung cancer risk predictions.27-32 There is a known trend towards larger nodules having increased risk of malignancy, so much so that size is a main factor in the work-up recommendations for screening and incidental nodules.27,33 However, with broader implementation of CT-based lung cancer screening, including collection of other contributing demographical and clinical factors could provide more impact for other risk factors. Also, the increased use of lung cancer screening and the associated mechanisms for structured reporting of patient data could standardize these factors further, allowing for potentially more useful information than is currently gathered.
From a clinical workflow standpoint, a fully automated tool which does not require human interaction for nodule identification and segmentation would be advantageous. With the increased use of CT for lung cancer screening and for longitudinal tracking of incidental nodules, the workload of imaging data requiring radiology reads is increased; therefore, for a tool to be useful it must be easy to implement and require as little added effort as possible. Here, we demonstrated the potential improvement in testing AUC-ROC by incorporating automated qCT features (AUC-ROC=0.74, 0.79) over solely clinical characteristics (AUC-ROC=0.64).
The limitations of this study included the retrospective collection, with a focus on solid solitary pulmonary nodules. The cohort used in this study has a size bias between malignant and benign classes, and the nodule was not excluded (segmented) from the analysis. However, the difference between the average malignant nodule diameter (mean 14.7mm) and benign nodule diameter (mean 9.11mm) is considered very small when placed in the context of whole lung structure assessment. We did not run separate analysis based on race which could in the future provide more accurate predictions as was shown previously in an African American population.34 We only included inspiratory scans in the analysis, and there are known expiratory scan measures (percentage below -856HU) which could further assist in the differentiation between malignant and benign cases.
In conclusion, this work presents the potential value of COPD-related qCT features from the lung, combined with information optimization feature selection and ensemble neural net classification for distinguishing malignant from benign lesions. While performance of this developed technique was not perfect in the task of correctly identifying all lung cancer cases, it could have potential utility in reducing the clinical follow-up in individuals with benign CT-identified pulmonary nodules.
Acknowledgments
Author Contributions: JU, SLM, and JCS wrote the main manuscript text, with editing provided by JL, CND, AGS. JU, SLM, CND, AGS, and JCS contributed to data collection. JU, SLM, JL, and JCS performed data analysis and figure creation. All authors reviewed the manuscript.
Data Availability: The CT datasets utilized in this study are available from the originating clinical trials: COPD Genetic Epidemiology Study (COPDGene),12Inflammation, Health, and Lung Epidemiology Study (INHALE),2 and the National Lung Screening Trial (NLST).13 The image feature data generated during the current study are available from the corresponding author on reasonable request.
Declaration of Interest
JCS has a family member that is a shareholder and receives compensation from VIDA Diagnostics. All other authors have nothing to declare.