Running Head: Machine Learning Prediction of Progression in FEV1
Funding Sources: This work was supported by National Heart, Lung, and Blood Institute K08 HL141601, R01 HL124233, R01 HL126596, R01 HL147326, U01 HL089897, and U01 HL089856. The COPDGene® study (NCT00608764) is also supported by the COPD Foundation through contributions made to an Industry Advisory Board that has included AstraZeneca, Bayer Pharmaceuticals, Boehringer-Ingelheim, Genentech, GlaxoSmithKline, Novartis, Pfizer, and Sunovion.
Date of Acceptance: May 18, 2022 │ Published Online Date: May 20, 2022
Abbreviations: chronic obstructive pulmonary disease, COPD; COPD Genetic Epidemiology study, COPDGene®; linear regression, LR; forced expiratory volume in 1 second, FEV1; receiver operator characteristic, ROC; Global initiative for chronic Obstructive Lung Disease, GOLD; computed tomography, CT; annualized 5-year changes in FEV1, ∆FEV1; root mean squared error, RMSE; increase in the mean squared errors, IncMSE; area under the curve, AUC; body mass index, BMI; low attenuation area below -950 Hounsfield units, %LAA-950; forced vital capacity, FVC; modified Medical Research Council, mMRC; St George’s Respiratory Questionnaire, SGRQ; preserved ratio-impaired spirometry, PRISm; interquartile, IQR; forced expiratory flow rate between 25% and 75% of the vital capacity, FEV25%-75%
Citation: Boueiz A, Xu Z, Chang Y, et al. Machine learning prediction of progression in forced expiratory volume in 1 second in the CODPGene® study. Chronic Obstr Pulm Dis. 2022; 9(3): 349-365. doi: http://doi.org/10.15326/jcopdf.2021.0275
Online Supplemental Material: Read Online Supplemental Material (425KB)
Note: The abstract from this work was presented at the American Thoracic Society International Conference in 2018 and published in the American Journal of Respiratory and Critical Care Medicine: Boueiz A, Chang Y, Cho MH, et al. Machine learning prediction of 5-year progression of FEV1 in the COPDGene Study. Am J Respir Criti Care Med. 2018;197(A7430).
Introduction
Chronic obstructive pulmonary disease (COPD) continues to be a major cause of disabilitly and death in the United States and globally.1-4 Novel therapies that slow disease progression could result in an improvement in COPD patients’ health status and have a substantial impact on health care utilization. The development of such therapies will be aided by improved tools for predicting disease progression, enabling the selection of high-risk groups for targeted treatment.
Predictive models incorporate multiple sources of information to make patient-specific predictions and are widely used in multiple areas of medical practice. Existing models of disease progression in COPD have been limited in the scope of variables assessed.5-9 COPD exhibits significant variation in clinical and radiologic presentation as well as disease progression.6,10-12 This disease heterogeneity complicates the identification of the predictors of COPD progression and limits the accuracy of predictive models. Furthermore, COPD often progresses slowly over decades and true disease progression over short time periods can be difficult to detect with existing measurements.
In this study, we aimed to improve the prediction of COPD progression by applying machine learning to a rich dataset of clinical, demographic, patient-reported variables and imaging features in the COPD Genetic Epidemiology (COPDGene®) study. We hypothesized that deep phenotyping at the initial study visit along with random forest modeling, which exploits complex non-linear relationships and interactions among the risk factors, would facilitate the prediction of the rates of disease progression as measured by forced expiratory volume in 1 second (FEV1), a key aspect of COPD.
Materials and Materials
Study Populations
The COPDGene study is an ongoing, multi-institutional, longitudinal study to investigate the epidemiologic and genomic characteristics of COPD.13 COPDGene enrolled self-identified non-Hispanic White and African-American smokers across the full spectrum of disease severity as defined by the Global initiative for chronic Obstructive Lung Disease (GOLD) spirometric grading system.14 Participants were aged 45 to 80 years at study enrollment and had at least a 10 pack-year lifetime smoking history. COPDGene collects longitudinal data at 5-year intervals; the 10-year study visit is ongoing. Visit 1 and Visit 2 were completed and Visit 3 is ongoing. At each study visit, participants underwent comprehensive phenotyping, which included spirometry, questionnaire assessment, and inspiratory and expiratory chest computed tomography (CT) scans, all of which were done according to a standard procedure with consistent quality control across centers.
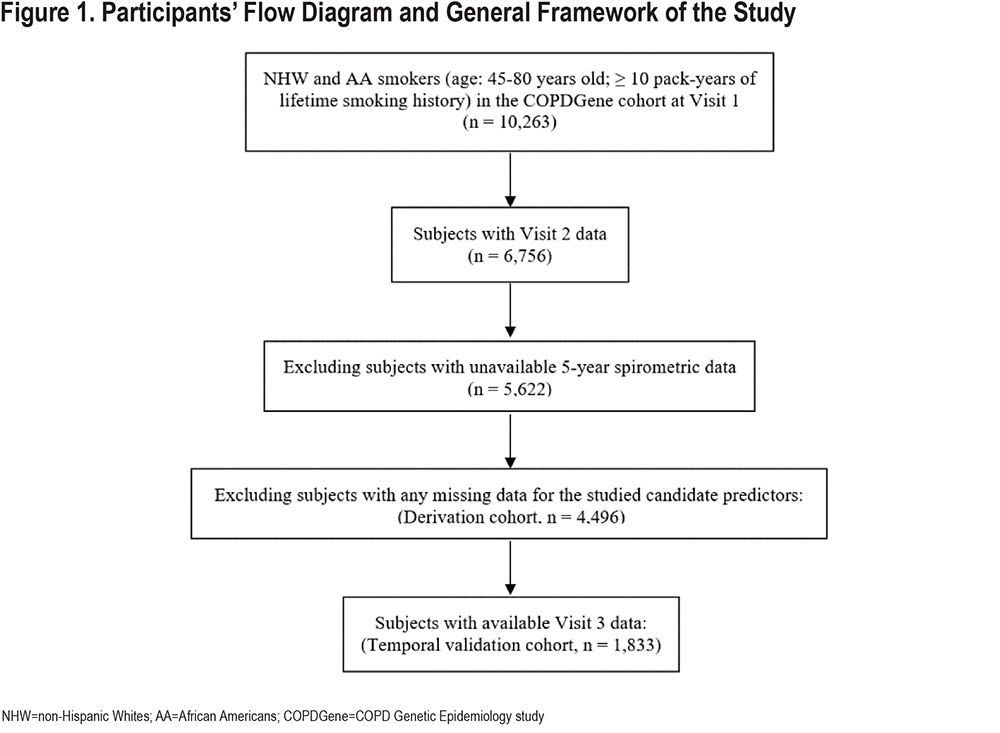
Derivation cohort - COPDGene Study Visit 1 and Visit 2: We analyzed 4496 smokers with complete CT scans and relevant covariate data at the baseline visit (Visit 1) and 5-year follow-up visit (Visit 2) in the COPDGene cohort.
Temporal validation cohort - COPDGene Study Visit 3: During Phase 3 of the COPDGene Study, enrolled participants returned for their 10-year follow-up visit. At the time of this analysis, 1833 smokers had completed their 10-year follow-up visit and had available 10-year spirometric and radiologic data. To predict their outcome values at Year 10 (Visit 3), we entered their 5-year (Visit 2) predictor data into the models trained in the derivation cohort. The FEV1 values for Visit 3 were observed. Our models were trained using only data from Visit 1 and Visit 2, where predictors were at Visit 1 and responses were Visit 2 values or the change in values between Visit 2 and Visit 1. In this setting, cross-validation was used to assess model performance. To provide further temporal validation of our models, we tested our already-trained models (no further parameter fitting) by using Visit 2 values for the predictors. This allowed us to compare the predicted Visit 3 values against the observed Visit 3 values to assess the accuracy of each prediction model in the temporal validation cohort.
The COPDGene study design, participant enrollment, and phenotype measurements have been previously reported13 and additional information is included in the online data supplement.
Outcome Variables
We constructed models to predict annualized follow-up FEV1 and 5-year changes in FEV1 (∆FEV1). ∆FEV1 (mL/year) was calculated by subtracting the Visit 1 value from the Visit 2 value and dividing by the time between Visit 1 and Visit 2. Negative values represent a lower value of the outcome at Visit 2 (i.e., worsening of the disease over the 5-year period with greater loss of FEV1). From the prediction models of ∆FEV1, we also derived the prediction of Visit 2 FEV1 by adding the predicted 5-year change to the observed Visit 1 value.
Feature Selection
Candidate predictors consisted of 46 baseline demographic, clinical, physiologic, and imaging variables that were available in the COPDGene population at Visit 1 and had correlation coefficients of less than 0.90 with the other variables. We set the threshold to 0.9 to ensure that only secondary/redundant features are removed, rather than features with potentially complementing information. To confirm this, we reran our experiments with removal of variables with correlation coefficients ≥0.7 and we compared the performance accuracies.
Training, Testing, and Validation Samples
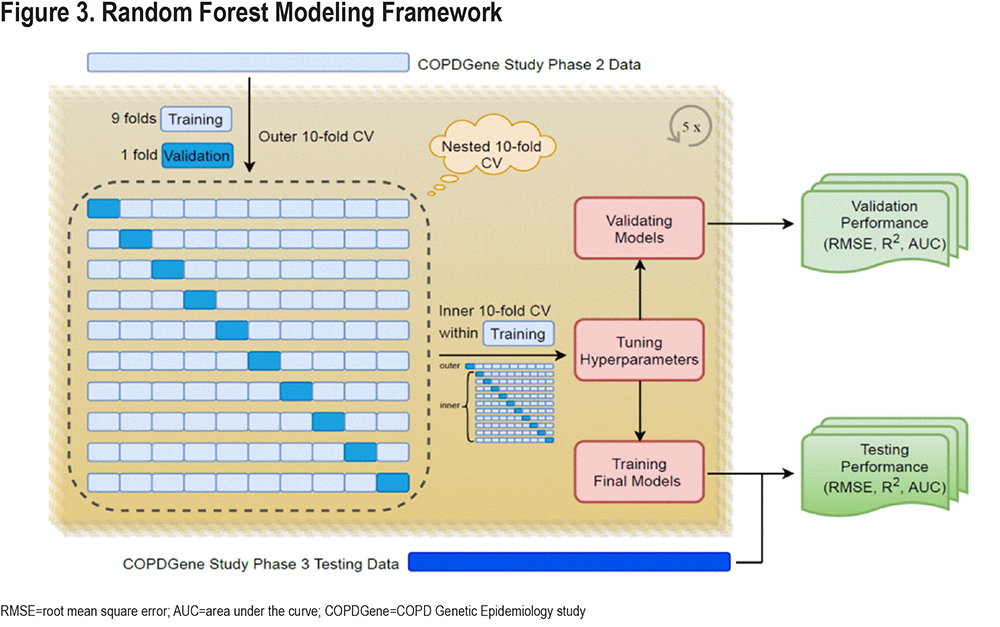
We trained a prediction model for ∆FEV1 in 4496 participants with data from COPDGene Visit 1 and Visit 2 using a nested, 10-fold cross validation procedure. The inner fold of cross validation was used for parameter tuning. In the outer fold, our studied derivation cohort was randomly partitioned into 10 mutually exclusive subsets (folds) of approximately equal size, using nine folds for training and one-fold for testing each time for 10 times. This entire procedure was repeated 5 times to account for the random variability of the partitioning procedure and provide more accurate estimates of the performance. This repeated resampling procedure created an ensemble of 50 models over which we averaged the predictions, and we then validated the performance of this model using data from COPDGene Visit 3 that had not been used in any aspect of the model training process (temporal validation).
Random Forest Supervised Machine Learning
Supervised random forest is an ensemble learning method that predicts outcomes by fitting a series of decision trees and aggregating the results across trees. This method can capture non-linear dependencies and has been shown to perform well for a range of tasks.15 It begins building each tree by randomly selecting participants for the tree with replacements (bootstrap samples). Participants not selected in bootstrapping represent the out-of-bag set. For each bootstrap sample, a decision tree is trained by recursive binary partition of the data until the minimum node size is reached. At each node split, an optimal feature (and its split-point) is identified from a randomly selected subset of features by minimizing a loss measure. The random selection of features reduces the correlation between trees, leading to variance reduction and improved generalization performance. It also allows a moderately informative feature to assert its importance to the prediction. Once an ensemble of trees is grown, the prediction for a new sample is made by aggregating predictions (e.g., averaging for regression and majority vote for classification) from individual trees. In our study, we fixed the number of trees at 500 and tuned the hyperparameters (the bootstrap sampling fraction, the minimal node size and the number of features to use at each split) by minimizing root mean squared error (RMSE) using a nested 10-fold cross-validation within the training data.
Random Forest Variable Importance and Their Effects on the Prediction
We calculated variable importance scores as the aggregated increase in the mean squared errors (IncMSE) of predictions estimated with out-of-bag samples when the values of a given variable are randomly permuted.16,17 The larger the increase in prediction error when permuted, the higher the variable importance score (IncMSE), and the more important the variable is to the prediction. Since the raw permutation importance has better statistical properties, the importance values were not normalized.18 Therefore, they cannot be used to compare variable importance across prediction tasks, but they can be used within the same prediction task to rank variables by their contribution to the accuracy of the final model.
Prediction Performance
We assessed the accuracy of each prediction model using the RMSE and R-squared metrics, indicators of the goodness of fit of a set of predictions to the observed values. For the prediction of ∆FEV1, we also assessed the ability of the models to correctly identify participants in the top quartile of disease progression (i.e., greatest decline in FEV1) as quantified by the areas under the receiver operator characteristic ROC curves (AUC-ROC).
Linear Regression
To compare the performance of random forest to that of a more traditional modeling approach, the same set of predictors was evaluated in linear regression models.
Statistical Analyses
We performed a complete case analysis. Descriptive characteristics were reported respectively as percentages and medians with interquartile ranges for categorical and continuous variables. Variables were analyzed using the t-test for normally distributed variables, the Wilcoxon rank sum test for non-normally distributed variables, and Chi-square tests for categorical variables. To identify differences in the quality of prediction and variable importance in participants with different levels of COPD severity, we also constructed prediction models separately in various GOLD subgroups. All tests of significance were 2-tailed with a significance threshold of P-value<0.05.
Results
Participant Characteristics
In total, 4496 COPDGene participants (median age: 60; 51% men; 73% non-Hispanic Whites) had complete phenotypic data and were included in the analysis. The participant flow diagram is shown in Figure 1.
Characteristics of “Rapid FEV1 Progressors” in COPDGene: To describe the characteristics of participants who were “rapid FEV1 progressors” and test the null hypothesis that there is no systematic difference in patient characteristics between the 2 groups, we examined the characteristics of participants in the top quartile of progression to those in the bottom quartile (Table 1). Compared to participants in the bottom quartile of ∆FEV1, those in the top quartile (rapid FEV1 progressors) had a higher proportion of males with less severe spirometric impairment at baseline but with higher exposure to smoking (pack years and percentage of current smoking), more advanced radiologic disease (total emphysema and gas trapping), more bronchodilator responsiveness, more dyspnea and chronic bronchitis symptoms, and a lower rate of obesity and metabolic syndrome. The many significant P-values support the alternative hypothesis and shed light on the factors that may be associated with or even contribute to the rapid FEV1 progression. The significant differences between the rapid and slow progressors also underpin the clinical relevance of identifying rapid progressors using a prediction model.
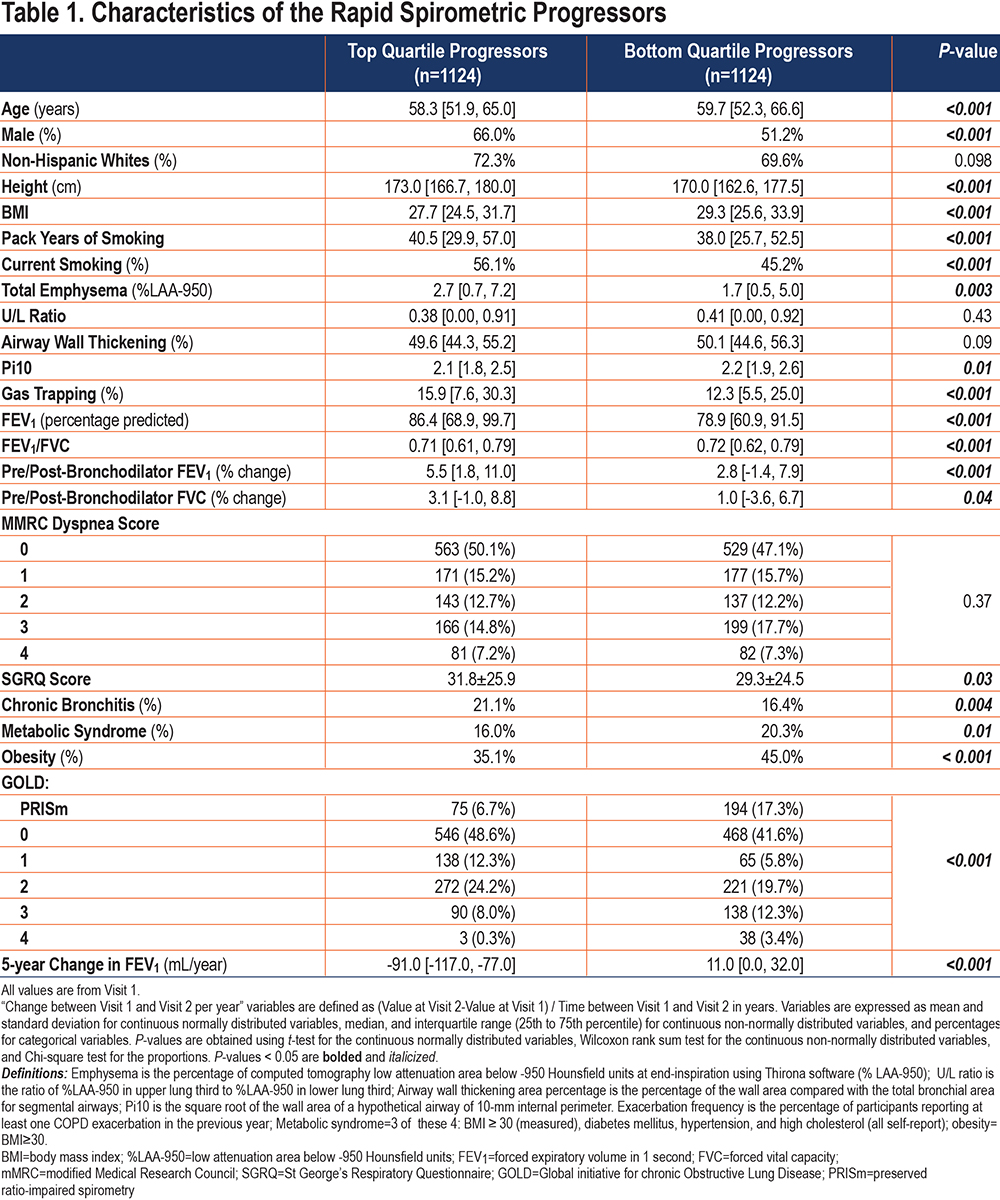
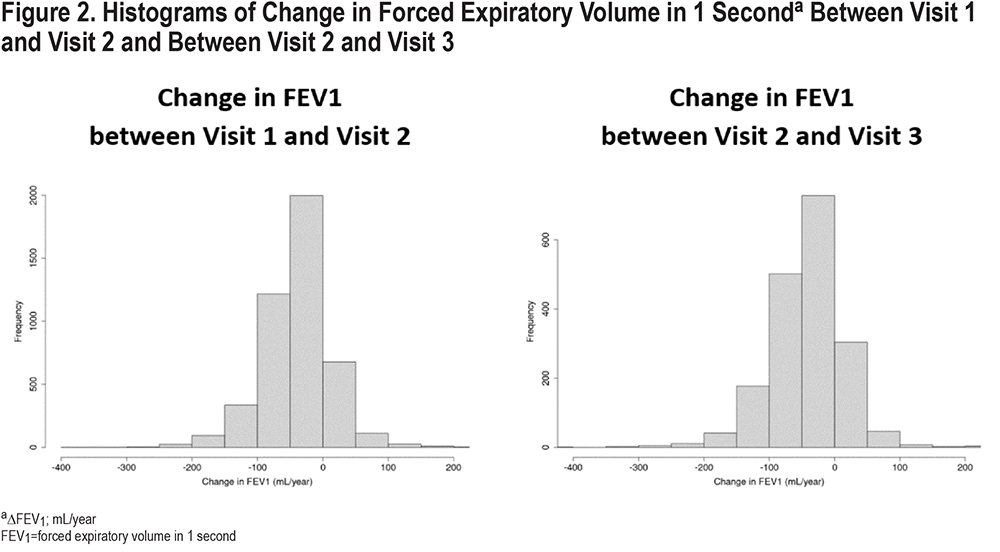
The median change in FEV1 was -37 (interquartile [IQR]: -66, -9)mL/year (Figure 2). Fifty-seven percent of the studied participants had a rate of decline in FEV1 of more than 30 mL/year over the 5-year period and 7% had an increase in FEV1 of more than 30 mL/year. Rapid FEV1 progressors had a median change of -91 mL/year compared to 11mL/year for slow spirometric progressors (Table 1). When assessed according to the severity of airflow limitation, the rate of FEV1 decline was inversely related to the GOLD grade, with medians of ∆FEV1 of -46, -38, -31, -16mL/year for GOLD 1–4, respectively.
Prediction Performance for Follow-up Forced Expiratory Volume in 1 Second and 5-year Change in Forced Expiratory Volume in 1 Second
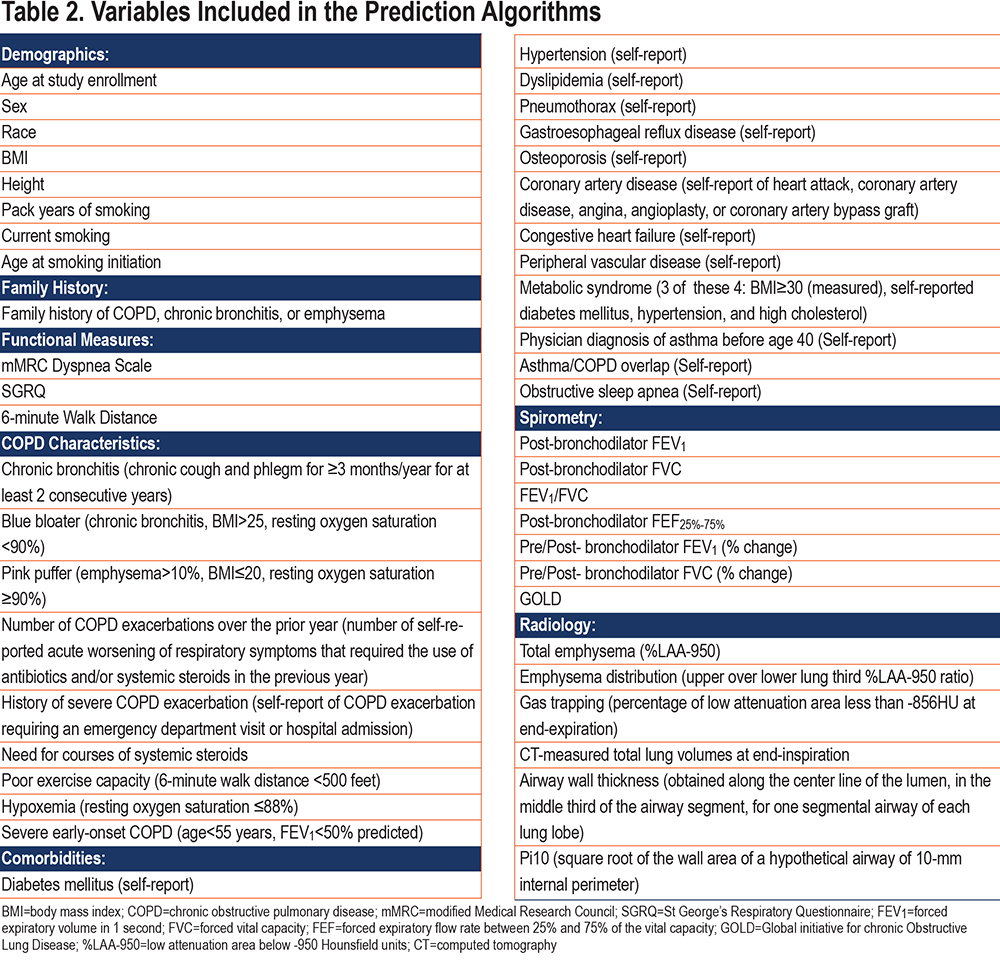
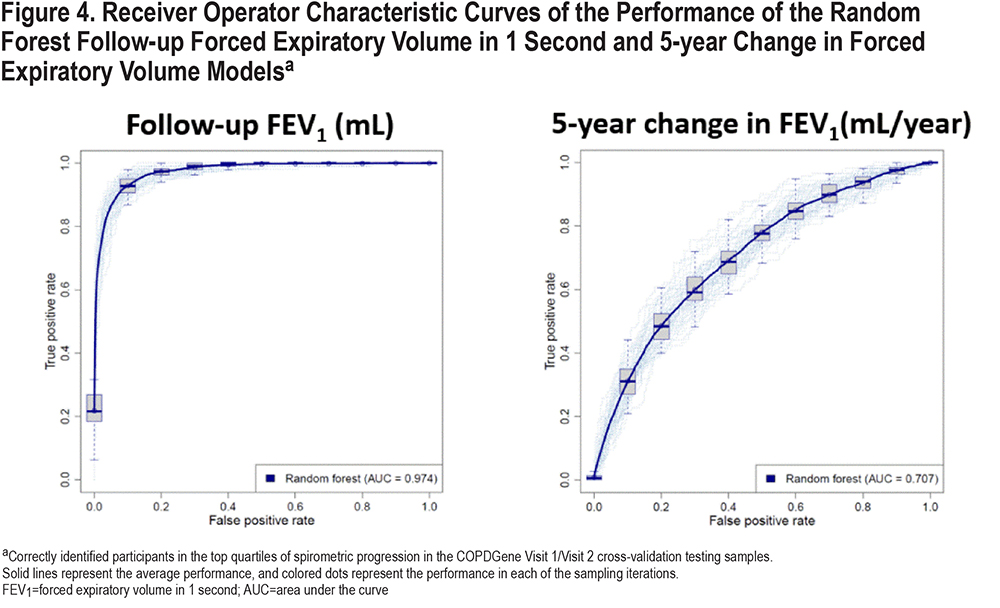
We constructed the prediction models using a nested cross-validation procedure and we assessed the prediction performance in the COPDGene 10-year follow-up visit. A schematic representation of our model is shown in Figure 3. The list of candidate predictors is provided in Table 2. In the cross-validation testing samples, on average, 89.6% of the variance in follow-up FEV1 values were explained and the AUC-ROC curves for the prediction of participants in the top quartile of observed disease progression was 0.97 (Table 3 and Figure 4). This high performance was maintained in the temporal validation with an R-squared value of 0.91 and AUC of 0.98 (Table 3). For the prediction of the change in FEV1 over time (∆FEV1), the average R-squared value was 0.15 and AUC was 0.71 in the testing samples and respectively, 0.10 and 0.70 in the validation cohort.

The random forest model had slightly better performance for the prediction of ∆FEV1 compared to linear regression (Table 3). The percentage of variance explained by random forest versus linear regression was 14.7% versus 12.3%. The indirect approach arithmetically transforms the predictions from modeling change in FEV1 to follow-up FEV1 predictions, and the best follow-up FEV1 prediction is achieved via an indirect approach with random forest modeling change in FEV1. In all cases by all metrics, random forest modeling change in FEV1 leads to the best prediction directly in change in FEV1 and indirectly in follow-up FEV1. These results demonstrate consistently the superiority of random forest versus linear regression and the merit of modeling change in FEV1 compared with modeling follow-up FEV1.
Candidate predictors consisted of variables that were available in the COPDGene population at Visit 1 and had correlation coefficients of less than 0.90 with the other variables. We set the threshold to 0.9 to ensure that only secondary/redundant features are removed, rather than features with potentially complementing information. To confirm this, we reran our experiments with 7 variables removed using a correlation criterion of 0.7 (CT-measured total lung volumes at end-inspiration, FEV1 to forced vital capacity (FVC) ratio, GOLD spirometric grade, airway wall thickness, post-bronchodilator FEV1, sex, and adjusted 15th percentile point (Perc15) density. We found that by setting the correlation threshold to 0.7, the resulting predictive performance decreased, particularly for the follow-up FEV1 (median RMSE increased from 269.71 to 278.60 for follow-up FEV1 and from 46.91 to 47.04 for change in FEV1).
Setting the number of trees to the default of 500 provided a good compromise between performance and computational efficiency in our datasets, as evidenced by the 10-fold cross-validation loss curves with respect to the number of trees shown in Figure 1S in the online supplement.
Analysis of Signal to Noise Ratio for 5-year Change in Forced Expiratory Volume in 1 Second
Changes in spirometric measures are more commonly used endpoints in COPD clinical trials. Predicting future FEV1 values is not the same as predicting the changes of FEV1 over the same period, since the ∆FEV1 over a fixed time period generally contributes a relatively small amount to the overall variance of FEV1 at a given time point. Given the often gradual rate of progression of COPD, 5 years is a relatively short observation period, and one of the concerns is that the signal to noise ratio in our progression variables is insufficient for reliable prediction. To determine the signal-to-noise characteristics of our progression variables, we calculated the expected signal-to-noise ratio using previously published values19 of measurement error for FEV1. An important parameter in these calculations is the extent of correlation in errors between the 2 study measurements. Since empiric data were unavailable, we assumed independence between these errors; therefore, these estimates likely represent a lower bound on the proportion of noise in these measures. We estimated that measurement error accounted for at least 22% of the variance of ∆FEV1 (calculations are included in the supplement). Thus, the theoretical upper bound for prediction performance of ∆FEV1 was 78%.
Important Predictors and Their Effects on Prediction
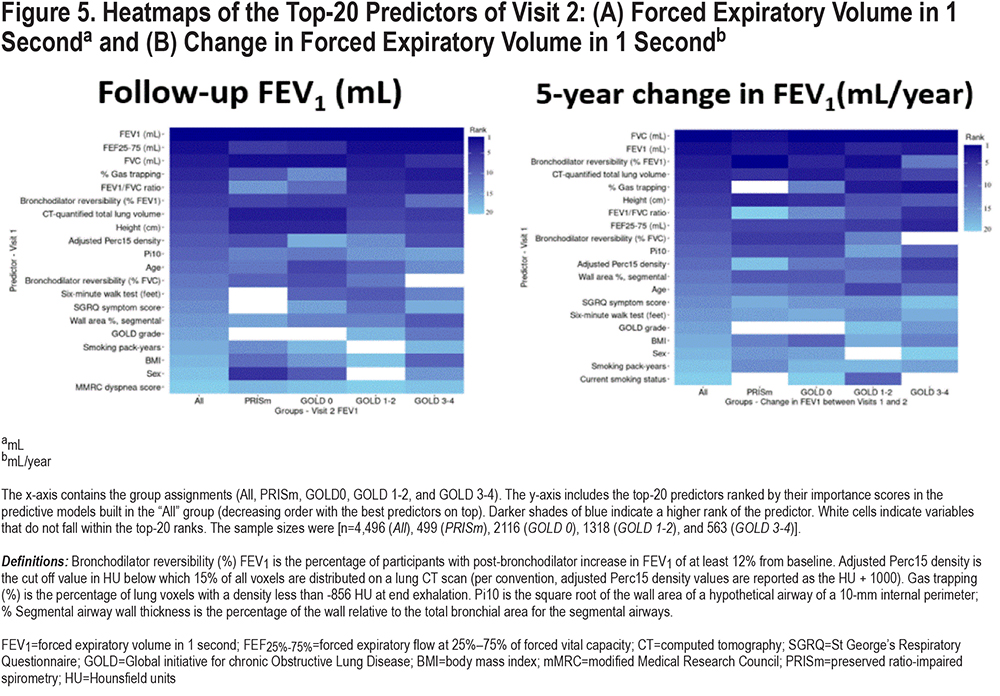
Figure 5 shows the ranking of the top-20 predictors based on their importance scores in the random forest models. Several of the known COPD disease progression risk factors were present as top-ranked risk factors in our models and other new predictors were identified. The most important variables for FEV1 progression included baseline spirometry, CT-measured total lung volume, bronchodilator responsiveness, gas trapping, total emphysema, and smoking exposure. Variables like the number of COPD exacerbations in the prior year, selected comorbidities, and dyspnea scores were of less importance.
Prediction of COPD Progression Stratified by Global Initiative for Chronic Obstructive Lung Disease Grade
To determine whether progression was determined by different variables at different GOLD spirometric grades, we examined the performance of random forest prediction models for pre-specified subgroups of smokers stratified by GOLD grade (n= 4496 [Overall], 499 [preserved ratio-impaired spirometry (PRISm)], 2116 [GOLD 0], 1318 [GOLD 1–2], and 563 [GOLD 3–4]). We observed significant differences in predictive performance across these subgroups. The model performance accuracy was best for GOLD 1–2 and it was harder to achieve accurate prediction in advanced stages of the disease. The area under the ROC curves for the prediction of participants in the top quartile of disease progression was 0.66 (GOLD 0), 0.73 (GOLD 1–2), and 0.58 (GOLD 3–4). The predictors of disease progression were also different by GOLD grade (Figure 5). For instance, bronchodilator responsiveness seems to be less important and emphysema and airway disease more important in the prediction of ∆FEV1 in participants at more advanced stages of the disease.
Effects of Accounting of Smoking Status in Both Baseline and Follow-up Visits on the Prediction Performance
At Visit 1, 47% of the studied participants were current smokers and 53% were former smokers. At Visit 2, 37% of the studied participants were current smokers and 63% were former smokers. At Visit 3, 30.6% of the studied participants were current smokers and 69.4% were former smokers. In terms of change of the smoking status between visits, 35% remained current smokers at Visit 1 and Visit 2 and 50.7% remained former smokers at Visit 1 and Visit 2. A total of 11.9% were current smokers at Visit 1 and former smokers at Visit 2 and 2.2% were former smokers at Visit 1 and current smokers at Visit 2. A total of 27.9% of studied participants remained current smokers at Visit 2 and Visit 3 and 63% remained former smokers at Visit 2 and Visit 3. A total of 6.4% were current smokers at Visit 2 and former smokers at Visit 3 and 2.7% were former smokers at Visit 2 and current smokers at Visit 3. We reran our prediction models adding the smoking status variable at Visit 2 in the derivation cohort (and Visit 3 smoking status for the temporal cohort). No major effect on the prediction performance was noted as shown in Table 1S in the online supplement.
Discussion
This current study showed that the prediction of change in FEV1, which is more relevant for disease progression, is more challenging than predicting the absolute FEV1 level. Our prediction models for ∆FEV1 represent the current state of the art for prediction of prospective change in FEV1. But there is significant room for improvement in future models. The most important predictive variables came from a wide range of clinical, spirometric, and imaging features. Baseline spirometry, CT-measured total lung volumes, and bronchodilator responsiveness dominated the prediction. In addition, the predictive performance and the relative importance of predictors differed by GOLD grade.
Several screening tools are available to identify patients with undiagnosed COPD and to predict outcomes in patients with COPD.1,8,9,20-25 While Zafari et al and Chen et al developed and validated risk models to accurately predict lung function trajectory, 8,9 our study is the first to apply advanced machine learning methods, use an extensive set of phenotypic measurements and comorbidities, predict not only the follow-up values but also the more relevant change variables, and identify the relative importance of the predictors at various stages of the disease. With respect to the outcomes evaluated in these 2 papers, our predictive models gave similar performance for the prediction of future values of FEV1. Our study added the prediction of prospective changes in FEV1 that were not reported in these previously published studies. Predicting the change over time is more challenging than simply predicting the future value, since the change typically represents a small proportion of the overall variance in a given pair of FEV1 measurements separated by 5 years or less. However, it is important to assess the ability of models to predict prospective changes since this is an important outcome for clinical trials.
Given the superiority of non-linear models compared with linear models with regards to exploiting complex relationships and interactions among the risk factors,26 we chose random forest as our primary model due to its flexibility and generalizability, and the fact that the interpretation of decision trees are more natural to clinicians than some of the other black-box models. Despite hundreds of trees, the ensemble method (bagging) and the base learner (decision tree) in random forest are easier to understand and interpret than many other black-box models with more sophisticated ensemble methods (e.g., boosting) or base learners (e.g., kernels, neural networks).27 The similar performance of cross-validation and temporal validation attests to the generalizability of our models rather than overfitting, which would result in poor temporal validation performance compared to cross-validation performance. The sharp performance gap between predicting follow-up FEV1 and (rate of) change in FEV1 seems nonintuitive at first glance. To explain this in other terms, imagine that a predictive model for change in height was developed for a cohort of adults. A model that predicted “height 5 years from baseline” by simply substituting the baseline height value would be very accurate, since there is little to no change in adult height over that timeframe. While FEV1 does change over a 5-year timeframe, the absolute amount of change is usually small relative to baseline FEV1 volumes. Thus, predicting the total FEV1 in 5 years is a much easier (but less clinically relevant) problem than predicting the change in FEV1 over 5 years. The key rationale is that 5 years is a short time period in terms of COPD progression, leading to a high correlation of FEV1 values between 2 visits (therefore, high prediction performance with follow-up FEV1) and a low signal-to-noise ratio in the FEV1 5-year progression measurements (hence, poor prediction performance with change in FEV1). Despite this, there may still be merit in modeling the change in FEV1 even with a short 5-year period, as we found a modest improvement in predicting follow-up FEV1 using models built to predict change in FEV1 that can then be transformed to follow-up FEV1 (median RMSE: 258.87 and 231.38 for follow-up FEV1 at Visit 2 and Visit 3, respectively). This improvement could be attributed to the change in FEV1 models taking into account the uneven time lapse between visits.
Random forests offer superior prediction of disease progression relative to linear regression, and this improved performance stems from the ability of these models to more efficiently capture non-linear interactions between predictors. The predictive accuracy of our models may potentially be further improved by including additional predictors (such as DLCO, pulmonary vascular measures, and relevant molecular biomarkers) and exploring other machine learning algorithms (such as deep learning). At present, these models are not ready for clinical use but could be useful in the design of COPD clinical trials to enrich the study populations by patients who are most likely to experience rapid disease progression and benefit from therapeutic interventions. For clinical use, better performing models that have been more extensively validated in multiple additional and relevant target populations are necessary.
Rapid decline in lung function has previously been associated with a range of factors such as smoking exposure, bronchodilator reversibility, higher baseline FEV1, higher baseline FVC, exacerbations in the prior year, low body mass index (BMI), African American race, female sex, emphysema, upper lobe emphysema predominance, and CT-detected small airway abnormalities.5,6,8,28-33 Our study detected several of these known COPD disease progression risk factors and identified other new predictors for FEV1 decline. Our study is the first, to our knowledge, to demonstrate that the patterns of predictors vary by GOLD spirometric grade. The intriguing variations in the importance of different risk factors depending on the studied subgroup may help inform further exploration of predictive risk factors and future development of new risk prediction algorithms. Compared to participants in the bottom quartile of ∆FEV1, those in the top quartile (rapid FEV1 progressors) had less severe spirometric impairment and more advanced radiologic disease (total emphysema and gas trapping) at baseline. It is possible that the association of less severe spirometric impairment at baseline with more rapid FEV1 progression is an artifact related to the inability to lose sufficient FEV1 at the same rate compared to when disease is more severe (a physiologic floor in FEV1 which, once reached, results in a diminished FEV1 response to additional cigarette exposure). It is also possible that the association between more severe emphysema with more rapid FEV1 decline may represent a “winner’s curse.” However, it is important to note that baseline FEV1 was accounted for in our analyses as this variable was among the predictors in the prediction models. In addition, the fact that our cross-validation and temporal validation performances are similar argues against the presence of large winner’s curse effects.
The relative unimportance of certain traditional risk factors such as COPD exacerbations in the prior year, selected comorbidities, race, and sex in our machine learning predictive models may be consistent with the disparate results from previous studies. For example, although some publications have suggested a significant excess loss of FEV1 for each COPD exacerbation, 29,34,35 others have reported minimal6 or no relationship.36 Such discrepancy may also result from differences in methodology between studies as well as differences in sample size, study duration, study population, and variable definitions. The relative unimportance of certain traditional risk factors in our models may also indicate that, while these risk factors may attain statistical significance in some models, they do not provide much additional predictive value after considering more important risk factors.
Dimensionality and collinearity are important factors to consider in building and interpreting prediction models. While our data has a reasonable dimensionality in respect to the sample size, random forest performs well with high dimensional data.37 Collinearity is more of a challenge for interpreting the feature relevance ratings than the prediction performance. It is worth noting that the permutation-based feature importance scores we utilized in this study capture the marginal importance of a feature; additional approaches for capturing conditional/partial feature importance in the presence of associated features have been proposed.18 However, there is a heuristic component to these diverse feature importance scoring techniques, and there is currently no consensus or clear theoretical underpinning for them. It has been argued that there is a marginal-partial feature importance dimension, and the researcher must determine where he/she falls on this dimension based on his/her perspective on variable importance and the research question under consideration.38
The random forest's tunability of the number of trees hyperparameter has not been thoroughly investigated until recent years. For mean squared error loss in regression (and other loss functions in classification), it has been theoretically proven that increasing the number of trees does not lead to overfitting and that setting it to a computationally feasible large number is more favored than tuning the hyperparameter.39 Setting the number of trees to the default of 500 provided a good compromise between performance and computational efficiency in our datasets.
This study has a number of strengths. Analyses were performed within a well-characterized cohort that included participants at all stages of disease severity. In addition, by focusing on prediction rather than the study of individual risk factors, our results provide useful context regarding the relative importance of specific predictors. By constructing models in participants stratified by GOLD spirometric grade, we demonstrated that patterns of optimal predictors vary by specific disease outcome and GOLD grade. Validation of our findings in the temporal cohort represents another strength of our paper.
Our study also has limitations. We only used 2 measurements of lung function separated by approximately 5 years. The large sample size available helped to overcome some of the inherent challenges in low signal-to-noise ratio with studies of COPD progression over a relatively short period of time. However, with longer follow-up and more measurements in future studies, we will be better able to isolate measurement noise from real disease progression which will result in greater predictive accuracy. Our analysis was based on participants who had completed their second study visit, and it is possible that patients who were lost to follow-up differed from those available for analysis. Many of the patients with airflow obstruction were receiving therapy for their disease. Although no existing pharmacotherapy has been conclusively shown to affect the rates of disease progression, this still may have influenced our results. However, we chose not to include pharmacotherapy data in these analyses in order to reduce biases likely present in patient-reported pharmaco-epidemiologic data.40,41 It is recognized that as the number of potential risk factors increases, the complexity of the models can cause overfitting. We addressed this by appropriate hyperparameter tuning and by evaluating the performance of our predictive models in cross-validation and in the temporal cohort. Lastly, because COPDGene is one of the few available studies with deeply phenotyped participants at all stages of disease severity, extensive clinical, spirometric, and imaging features, and follow-up data, there is currently no other appropriate replication cohort for the analyses performed, and lack of validation in an independent set of participants limits the generalizability of our findings. It will be important for future investigations to validate these findings in independent large cohorts of similarly well-characterized smokers with the same or greater length of follow-up time.
Conclusion
Random forest machine learning in conjunction with deep phenotyping improves the prediction accuracy of COPD progression. The present study improves our ability to identify patients at risk for rapid disease progression, and these models may be useful for the development of targeted disease-modifying therapies.
Acknowledgements
Author contributions: Drs. Boueiz and Castaldi had full access to all the data in the study and take responsibility for the integrity of the data and the accuracy of the data analysis. COPDGene investigators were instrumental in the design and implementation of the COPDGene study and collected and analyzed data cited in this article. All authors have reviewed, approved and endorsed all content and conclusions of this article.
The authors wish to thank the thousands of patients who participated in the COPDGene study over the last 10 years.
COPDGene Investigators - Core Units:
Administrative Center: James D. Crapo, MD (PI); Edwin K. Silverman, MD, PhD (PI); Barry J. Make, MD; Elizabeth A. Regan, MD, PhD
Genetic Analysis Center: Terri H. Beaty, PhD; Peter J. Castaldi, MD, MSc; Michael H. Cho, MD, MPH; Dawn L. DeMeo, MD, MPH; Adel Boueiz, MD, MMSc; Marilyn G. Foreman, MD, MS; Auyon Ghosh, MD; Lystra P. Hayden, MD, MMSc; Craig P. Hersh, MD, MPH; Jacqueline Hetmanski, MS; Brian D. Hobbs, MD, MMSc; John E. Hokanson, MPH, PhD; Wonji Kim, PhD; Nan Laird, PhD; Christoph Lange, PhD; Sharon M. Lutz, PhD; Merry-Lynn McDonald, PhD; Dmitry Prokopenko, PhD; Matthew Moll, MD, MPH; Jarrett Morrow, PhD; Dandi Qiao, PhD; Elizabeth A. Regan, MD, PhD; Aabida Saferali, PhD; Phuwanat Sakornsakolpat, MD; Edwin K. Silverman, MD, PhD; Emily S. Wan, MD; Jeong Yun, MD, MPH
Imaging Center: Juan Pablo Centeno; Jean-Paul Charbonnier, PhD; Harvey O. Coxson, PhD; Craig J. Galban, PhD; MeiLan K. Han, MD, MS; Eric A. Hoffman, Stephen Humphries, PhD; Francine L. Jacobson, MD, MPH; Philip F. Judy, PhD; Ella A. Kazerooni, MD; Alex Kluiber; David A. Lynch, MB; Pietro Nardelli, PhD; John D. Newell, Jr., MD; Aleena Notary; Andrea Oh, MD; Elizabeth A. Regan, MD, PhD; James C. Ross, PhD; Raul San Jose Estepar, PhD; Joyce Schroeder, MD; Jered Sieren; Berend C. Stoel, PhD; Juerg Tschirren, PhD; Edwin Van Beek, MD, PhD; Bram van Ginneken, PhD; Eva van Rikxoort, PhD; Gonzalo Vegas SanchezFerrero, PhD; Lucas Veitel; George R. Washko, MD; Carla G. Wilson, MS
Pulmonary Function Testing Quality Assurance Center, Salt Lake City, Utah: Robert Jensen, PhD
Data Coordinating Center and Biostatistics, National Jewish Health, Denver, Colorado: Douglas Everett, PhD; Jim Crooks, PhD; Katherine Pratte, PhD; Matt Strand, PhD; Carla G. Wilson, MS
Epidemiology Core, University of Colorado Anschutz Medical Campus, Aurora, Colorado: John E. Hokanson, MPH, PhD; Erin Austin, PhD; Gregory Kinney, MPH, PhD; Sharon M. Lutz, PhD; Kendra A. Young, PhD
Mortality Adjudication Core: Surya P. Bhatt, MD; Jessica Bon, MD; Alejandro A. Diaz, MD, MPH; MeiLan K. Han, MD, MS; Barry Make, MD; Susan Murray, ScD; Elizabeth Regan, MD; Xavier Soler, MD; Carla G. Wilson, MS
Biomarker Core: Russell P. Bowler, MD, PhD; Katerina Kechris, PhD; Farnoush BanaeiKashani, PhD
COPDGene Investigators - Clinical Centers:
Ann Arbor VA, Ann Arbor, Michigan: Jeffrey L. Curtis, MD; Perry G. Pernicano, MD
Baylor College of Medicine, Houston, Texas: Nicola Hanania, MD, MS; Mustafa Atik, MD; Aladin Boriek, PhD; Kalpatha Guntupalli, MD; Elizabeth Guy, MD; Amit Parulekar, MD
Brigham and Women’s Hospital, Boston, MA: Dawn L. DeMeo, MD, MPH; Craig Hersh, MD, MPH; Francine L. Jacobson, MD, MPH; George Washko, MD
Columbia University, New York, New York: R. Graham Barr, MD, DrPH; John Austin, MD; Belinda D’Souza, MD; Byron Thomashow, MD
Duke University Medical Center, Durham, North Carolina: Neil MacIntyre, Jr., MD; H. Page McAdams, MD; Lacey Washington, MD
HealthPartners Research Institute, Minneapolis, Minnesota: Charlene McEvoy, MD, MPH; Joseph Tashjian, MD
Johns Hopkins University, Baltimore, Maryland: Robert Wise, MD; Robert Brown, MD; Nadia N. Hansel, MD, MPH; Karen Horton, MD; Allison Lambert, MD, MHS; Nirupama Putcha, MD, MHS
Lundquist Institute for Biomedical Innovation at Harbor UCLA Medical Center, Torrance, California: Richard Casaburi, PhD, MD; Alessandra Adami, PhD; Matthew Budoff, MD; Hans Fischer, MD; Janos Porszasz, MD, PhD; Harry Rossiter, PhD; William Stringer, MD
Michael E. DeBakey VAMC, Houston, Texas: Amir Sharafkhaneh, MD, PhD; Charlie Lan, DO
Minneapolis VA, Minneapolis, Minnesota: Christine Wendt, MD; Brian Bell, MD; Ken M. Kunisaki, MD, MS
Morehouse School of Medicine, Atlanta, Georgia: Eric L. Flenaugh, MD; Hirut Gebrekristos, PhD; Mario Ponce, MD; Silanath Terpenning, MD; Gloria Westney, MD, MS
National Jewish Health, Denver, Colorado: Russell Bowler, MD, PhD; David A. Lynch, MB
Reliant Medical Group, Worcester, MA: Richard Rosiello, MD; David Pace, MD
Temple University, Philadelphia, Pennsylvania: Gerard Criner, MD; David Ciccolella, MD; Francis Cordova, MD; Chandra Dass, MD; Gilbert D’Alonzo, DO; Parag Desai, MD; Michael Jacobs, PharmD; Steven Kelsen, MD, PhD; Victor Kim, MD; A. James Mamary, MD; Nathaniel Marchetti, DO; Aditi Satti, MD; Kartik Shenoy, MD; Robert M. Steiner, MD; Alex Swift, MD; Irene Swift, MD; Maria Elena Vega-Sanchez, MD
University of Alabama, Birmingham, Alabama: Mark Dransfield, MD; William Bailey, MD; Surya P. Bhatt, MD; Anand Iyer, MD; Hrudaya Nath, MD; J. Michael Wells, MD
University of California, San Diego, California: Douglas Conrad, MD; Xavier Soler, MD, PhD; Andrew Yen, MD
University of Iowa, Iowa City, Iowa: Alejandro P. Comellas, MD; Karin F. Hoth, PhD; John Newell, Jr., MD; Brad Thompson, MD
University of Michigan, Ann Arbor, Michigan: MeiLan K. Han, MD, MS; Ella Kazerooni, MD, MS; Wassim Labaki, MD, MS; Craig Galban, PhD; Dharshan Vummidi, MD
University of Minnesota, Minneapolis, Minnesota: Joanne Billings, MD; Abbie Begnaud, MD; Tadashi Allen, MD
University of Pittsburgh, Pittsburgh, Pennsylvania: Frank Sciurba, MD; Jessica Bon, MD; Divay Chandra, MD, MSc; Joel Weissfeld, MD, MPH
University of Texas Health, San Antonio, San Antonio, Texas: Antonio Anzueto, MD; Sandra Adams, MD; Diego Maselli-Caceres, MD; Mario E. Ruiz, MD; Harjinder Singh
Declaration of Interest
Dr. Castaldi reports grants from the National Institutes of Health during the conduct of the study, grants and other from GlaxoSmithKline, and personal fees from Novartis, outside the submitted work. Dr. Silverman reports grants from the National Institutes of Health during the conduct of the study, and grants and other from GlaxoSmithKline, outside the submitted work. All other authors have nothing to disclose.