Running Head: Modeling FEV1 and FEV1/FVC Jointly for COPD
Funding Support: The COPD Genetic Epidemiology (COPDGene®) study is funded by National Heart, Lung, and Blood Institute grants U01 HL089897 and U01 HL089856. The COPDGene® study (NCT00608764) is also supported by the COPD Foundation through contributions made to an Industry Advisory Committee that has included AstraZeneca, Bayer Pharmaceuticals, Boehringer-Ingelheim, Genentech, GlaxoSmithKline, Novartis, Pfizer, and Sunovion.
Date of Acceptance: July 7, 2022 | Published Online Date: July 29, 2022
Abbreviations: chronic obstructive pulmonary disease, COPD; Global initiative for chronic Obstructive Lung Disease, GOLD; forced expiratory volume in 1 second, FEV1; forced vital capacity, FVC; preserved ratio-impaired spirometry, PRISm; computed tomography, CT; COPD Genetic Epidemiology study, COPDGene®; Phase 1 (the baseline visit), P1; functional residual capacity, FRC; total lung capacity, TLC; the square root of wall area of a standardized airway with 10-mm internal lumen perimeter, Pi10; body mass index, BMI; bronchodilator response, BDR; Akaike’s Information Criterion, AIC; upper right, UR; right upper, RU; right down, RD; down right, DR; down left, DL; left down, LD; left up, LU; upper left, UL; Phase 2, P2; Phase 3, P3
Citation: Strand M, Khatiwada A, Baraghoshi D, et al. Predicting COPD progression in current and former smokers using a joint model for forced expiratory volume in 1 second and forced expiratory volume in 1 second to forced vital capacity ratio. Chronic Obstr Pulm Dis. 2022; 9(3): 439-453. doi: http://doi.org/10.15326/jcopdf.2022.0281
Online Supplemental Material: Read Online Supplemental Material (475KB)
Note: An applet to compute predicted values for the model presented in this article can be found at http://aasthakhatiwada.shinyapps.io/software.
Introduction
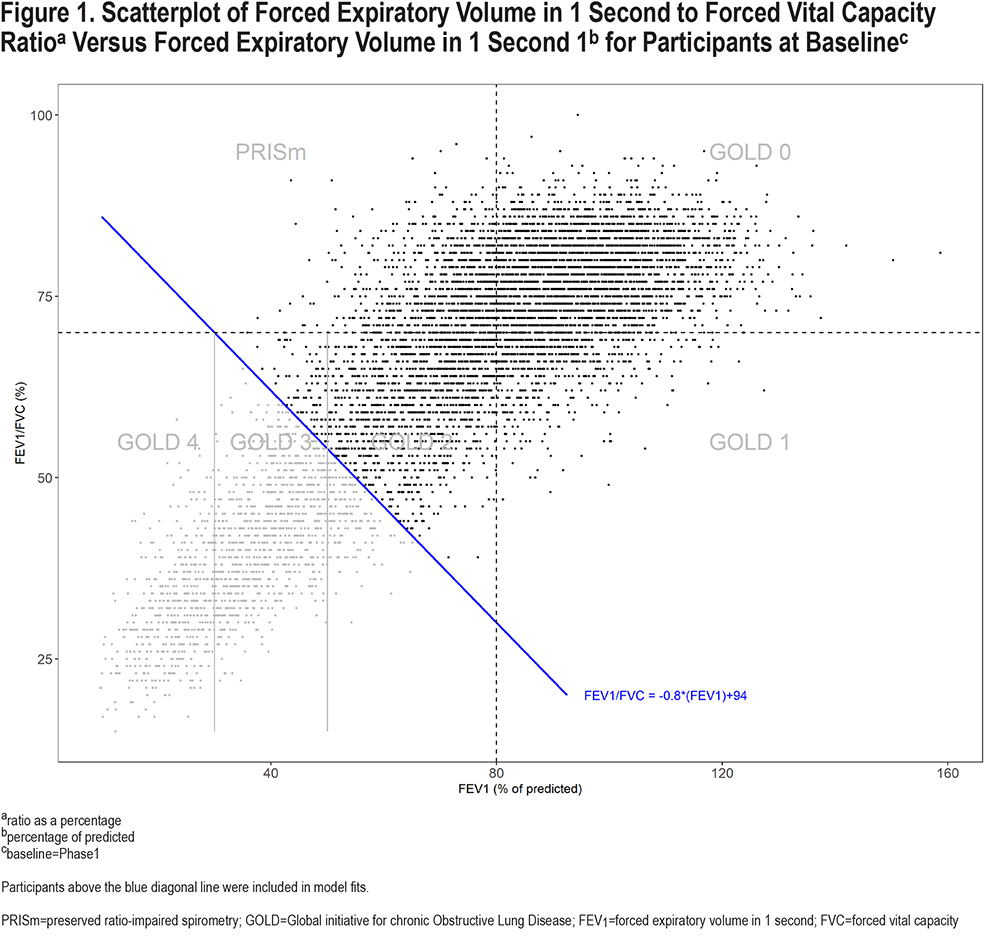
Chronic obstructive pulmonary disease (COPD) has classically been defined and its severity determined using Global initiative for chronic Obstructive Lung Disease (GOLD) criteria based on 2 continuous measures of lung function, forced expiratory volume in 1 second (FEV1) and FEV1 to forced vital capacity (FVC) ratio.1 Standard GOLD COPD spirometric grades involve FEV1/FVC <0.7 and FEV1 groupings based on cut-points at 80%, 50%, and 30% of predicted for GOLD 1-4 stages (see Figure 1). Additionally, individuals with FEV1/FVC ≥0.7 are often classified as GOLD 0 (if FEV1 ≥80 % of predicted) or preserved ratio-impaired spirometry (PRISm) (if FEV1 <80% of predicted). Since individuals are classified into 1 of the 6 groups, based on both FEV1 and FEV1/FVC, it may be beneficial to model them simultaneously.
Changes in lung function vary greatly across individuals with COPD; some experience greater declines while others do not. Understanding baseline characteristics that can predict the progression of disease in smokers is important, as it may allow for timely therapeutic intervention, particularly for individuals at risk of rapid progression or progression from non-COPD to COPD. Previous studies have focused on the development of prediction models individually for FEV1 or FEV1/FVC.2-8 Although these measures of lung function are related, they provide different information in terms of presence of disease and its severity. While FEV1/FVC has typically been used to simply classify individuals as having COPD or not, severity of disease has been primarily evaluated using FEV1. Here, we present a model for FEV1 and FEV1/FVC that can be used to predict joint changes in these outcomes after 5 and 10 years based on a set of baseline demographic, computed tomography (CT), behavioral, and symptom predictors. This model provides prediction of joint change in FEV1 and FEV1/FVC, which can then also be used to predict future GOLD classifications. To our knowledge, our prediction model is the first joint model that utilizes both FEV1 and FEV1/FVC to predict longitudinal clinical outcomes. We hypothesize that the proposed model will lead to improved inference for predicting changes in FEV1 and FEV1/FVC for those with or at risk for COPD.
Methods
The Cohort
The COPD Genetic Epidemiology (COPDGene®) cohort was established in 2007–2012, enrolling 10,198 smokers with and without COPD. Individuals were enrolled at 21 clinical centers under study protocols that were approved by each center’s institutional review boards. All participants provided written informed consent to participate in the study. Study details have been published previously.9
Participants in this analysis included PRISm, GOLD 0, 1 and a subset of GOLD 2–3 individuals. Specifically, individuals above the diagonal in the scatterplot of FEV1/FVC versus FEV1 (post-bronchodilator) in Figure 1 were included; GOLD categorizations were defined at baseline, i.e., Phase 1 (P1), unless noted otherwise. All individuals in GOLD 4 and some in GOLD 2–3 were excluded since the focus was on predicting disease progression for those who had not already substantially progressed by the baseline time point. Compared to the GOLD group boundaries that are incongruent with the direction of correlation between FEV1 and FEV1/FVC, the diagonal line shown in the figure provides a more natural break between healthier and less healthy individuals with respect to FEV1 and FEV1/FVC. The boundary was chosen to be perpendicular to the direction of the cloud of points and intersects both horizontal and vertical GOLD-defining dashed lines at 30%. Other diagonal lines could also be considered for inclusion/exclusion, such as one intersecting horizontal and vertical GOLD-defining lines at 50%. However, this would remove a substantial number of participants from analysis that are not within GOLD 3–4 classification. Similarly, moving the line down would begin to add more GOLD 3–4 participants who have more advanced disease.
Measuring Outcomes
FEV1 was measured in percentage of predicted, where the reference group used for calculations was the COPDGene non-smoking cohort (641 records; correlation between predicted and observed values: r=0.994). Using percentage of predicted FEV1 allowed for easy comparisons involving GOLD classifications. FEV1/FVC used raw values of each variable in the ratio (not percentage of predicted), but the number was expressed as a percentage (i.e., [FEV1/FVC] x100) so that the 2 outcomes were both expressed as percentages. Although this transformation is not essential for modeling, it allowed for easier interpretation for quantities such as Euclidean distance and angle, discussed next. The COPDGene nonsmoking cohort was used for reference equations for FEV1 because use of the standard Hankinson equations10 led to a predictive model in which age was a significant predictor, demonstrating an unexpected protective effect of aging. The COPDGene-referenced data did not exhibit this, suggesting that the nonsmoking cohort may reflect a more representative reference group for our study.
Modeling Outcomes
The term “joint model” here is used to indicate a model that simultaneously fits FEV1 change and FEV1/FVC change, accomplished technically by considering them as repeated (or multiple) measures on participants in the linear mixed model,11 rather than as a bivariate outcome. The term joint model often refers to one that combines a survival model joined with a continuous outcome model. However, here we consider 2 outcomes that are both continuous and approximately normally distributed. Our joint model allows for separate variance estimates for each outcome as well as a covariance between them. The 2 outcomes per participant are accounted for by including type as a predictor, plus interaction terms between type and other predictors in the model. Each participant has 2 records used in the model, 1 associated with type=1 (for FEV1/FVC) and 1 associated with type=0 (for FEV1). This modeling approach can be used even if the outcomes have different units, although interpretation of a joint vector is easier if the units are the same. The joint model takes into account the positive correlation between FEV1 and FEV1/FVC (see Figure 1), leading to more accurate inference for modeling magnitude and direction of lung function changes. Our model actually involves changes in FEV1 and changes in FEV1/FVC, which are also positively correlated.
Predictors of Progression
There were 46 predictors that were initially examined, including symptom, exacerbation, comorbidity, CT, demographic, lung function, genetic, and exercise variables (see Appendix A in the online supplement for the complete list). The primary continuous predictors in the final model included the following: level of emphysema, defined as the percentage of low attenuation areas less than a threshold of -950 Hounsfield units on CT scan (% emphysema); functional residual capacity (FRC), the volume remaining in the lungs after a normal, passive exhalation (estimated by chest CT);12,13 the ratio of FVC to total lung capacity (TLC), the latter measured by CT, which indicates obstructive lung disease;14 the square root of wall area of a standardized airway with 10-mm internal lumen perimeter (Pi10), a measure of airway wall thickening from CT;15 and body mass index (BMI) measured in kg/m2. There were also 3 binary predictors: smoking status (current/former), chronic bronchitis (presence/absence), and bronchodilator response (BDR), defined to be 1 if either FEV1 or FVC increased by at least 0.2 liters and 12% from pre- to post-test, and 0 otherwise. The CT metrics were calculated using Thirona software (Thirona, the Netherlands).
Model Selection and Framework
There were 3 basic stages to model selection. In step 1, automated stepwise selection methods were used to screen 46 variables in univariate models for FEV1 and FEV1/FVC. In step 2, a linear mixed model was fit using the variables selected in screening, plus interaction terms to account for the joint outcome (by including the type predictor to indicate whether the associated outcome was FEV1 or FEV1/FVC), and interaction terms to allow changes to depend on baseline FEV1 and FEV1/FVC. Terms were removed from the models using backward selection, starting with higher-order terms, until the optimal Akaike’s Information Criterion (AIC) was reached. In step 3, terms were (re)tested for inclusion in the model, including interactions between core predictors, based on AIC. Appendix B in the online supplement contains more detail on the model selection process.
An unstructured error covariance structure was included to account for the 2 outcome measures on participants (FEV1 change and FEV1/FVC change), allowing for separate variances by outcome and a correlation between the outcomes. A random intercept for study center was also included to account for correlation in responses between participants within centers.
Summarizing Results
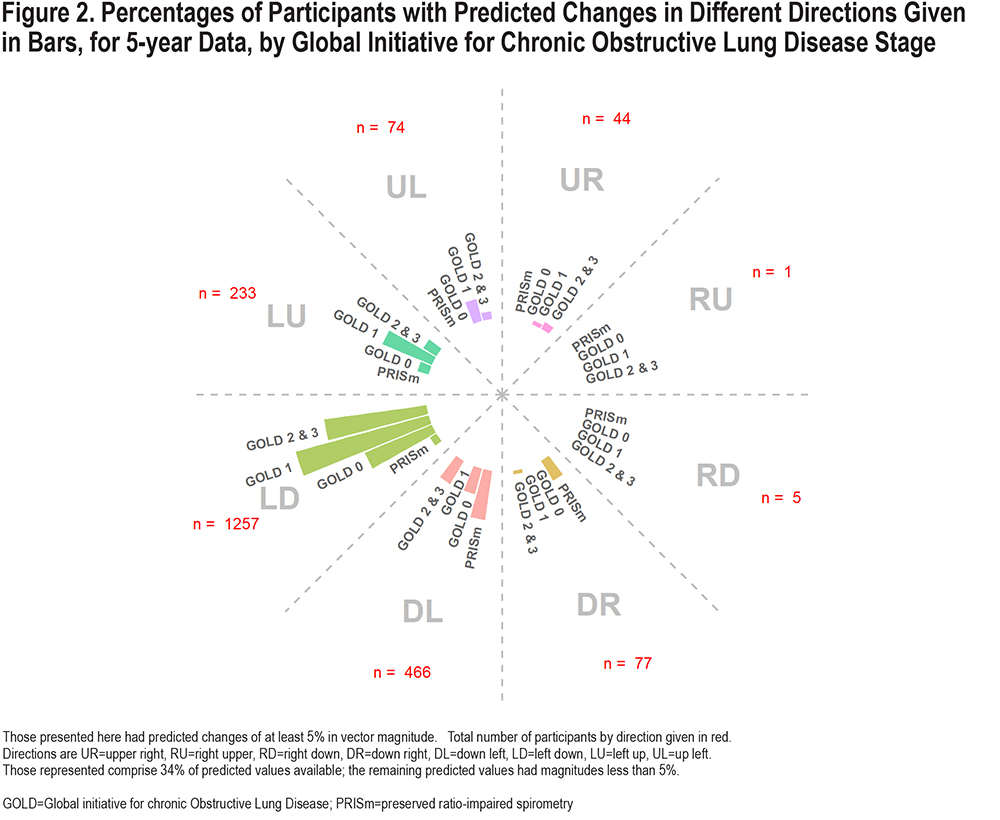
Results were characterized by magnitude and direction of change in FEV1 and FEV1/FVC using a transformation of the original variables. Magnitude was summarized using Euclidean distance (the straight length between 2 points in 2-dimensional space defined by FEV1/FVC change on one axis and FEV1 on the other), and angle was determined using the arc-tangent function. More detail, including calculation of variances associated with predicted magnitude and direction are included in Appendix C in the online supplement. Due to the complexity of the model, results were summarized by grouping joint predicted values by direction and magnitude categories, separately for 5- and 10-year models. The following categories were used for visual display of grouped predicted vectors with magnitude16 of at least 5%: upper right (UR), right upper (RU), right down (RD), down right (DR), down left (DL), left down (LD), left up (LU) and up left (UL), as shown in Figure 2 (for 5-year changes). LD movement was associated with losses in both FEV1 and FEV1/FVC, but slightly more for FEV1, whereas DL also has losses in both, but slightly more for FEV1/FVC. Those with predicted magnitudes <5% (any direction) were not plotted but included in Tables S1 and S2 in the online supplement.
Results
Sample Sizes and Correlations
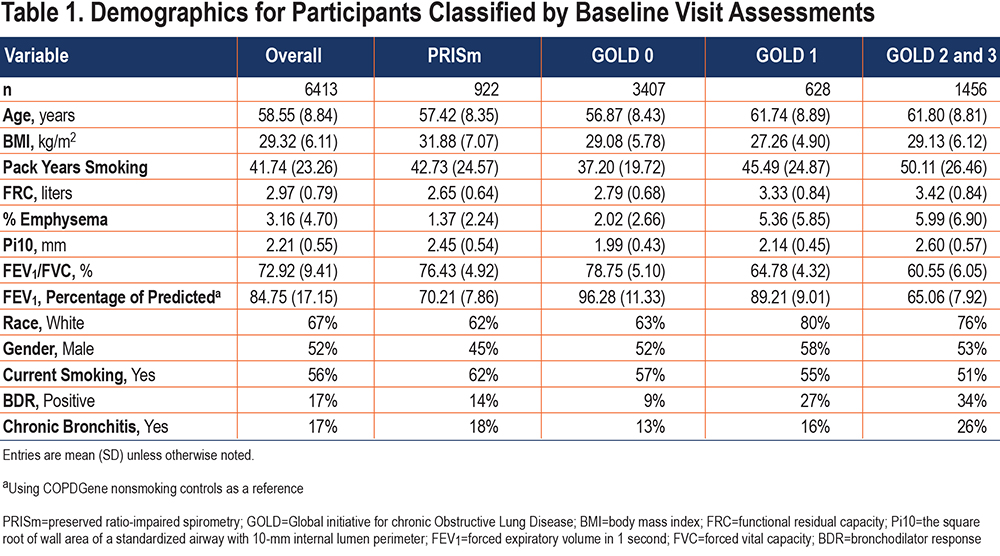
Among the original 10,198 study participants enrolled in COPDGene, 7990 had available baseline data for analysis; of these, 6413 were above the diagonal (Figure 1), which comprises the cohort for analysis. Table 1 shows a demographic summary of these participants. There were 3864 participants available for the 5-year model fit, and 1415 available for the 10-year model fit; the sample sizes were reduced due to loss to follow-up for spirometry at Phase 2 (P2) (approximately 5 years after baseline, or P1) or Phase 3 (P3) (approximately 10 years after baseline). Predicted values were determined for the 6413 participants regardless of whether spirometry measures were available at P2 or P3, since all that is required to predict outcomes is the complete set of baseline predictors. The correlation between change in FEV1/FVC and change in FEV1 for the cohort was r=0.39 for 5-year data and 0.43 for 10-year data.
Summary of Model Fits
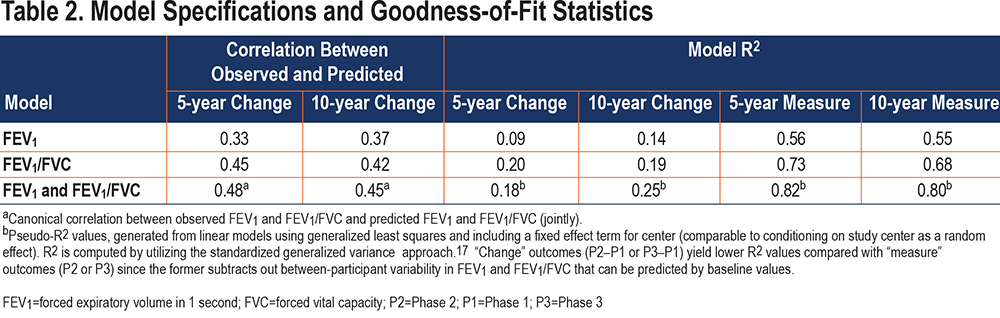
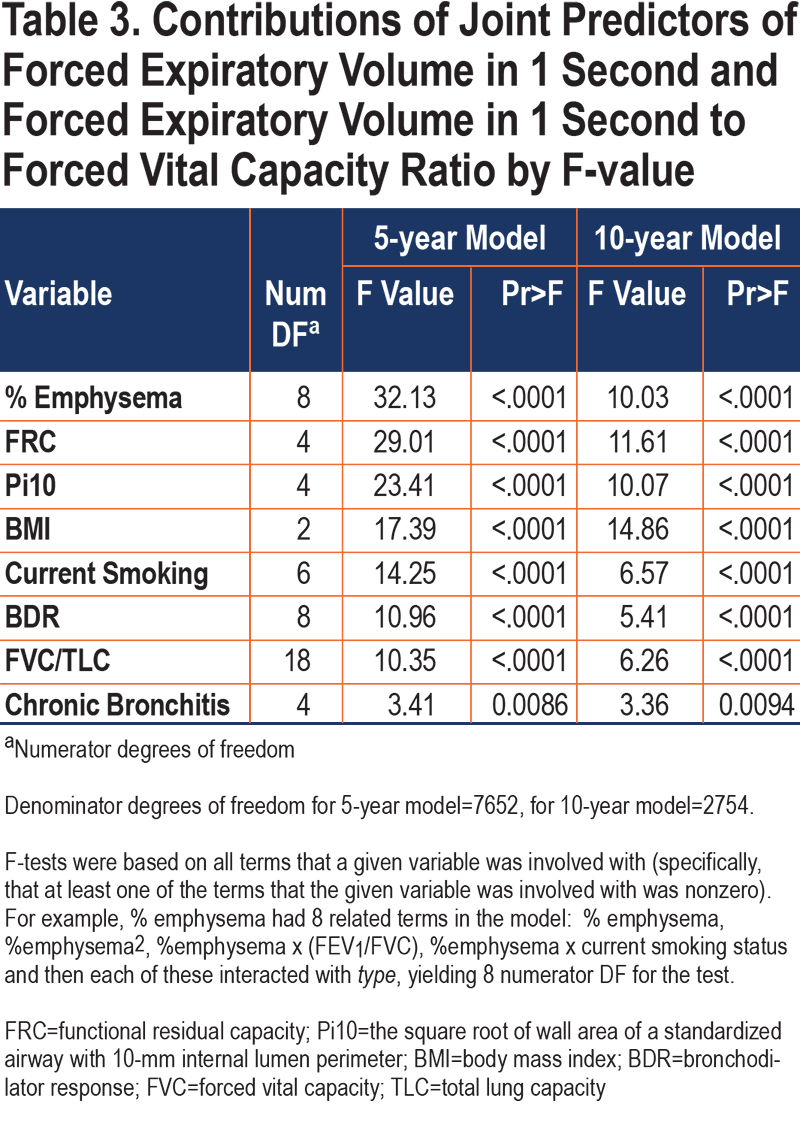
Fitted models of 3864 participants demonstrated that after 5 years, GOLD 0 and GOLD 2–3 participants generally had losses in both FEV1 and FEV1/FVC, while PRISm participants tended to primarily lose FEV1/FVC, and GOLD 1 primarily lost FEV1. However, by 10 years, some expected loss in FEV1 was observed for PRISm participants and FEV1/FVC loss for GOLD 1 participants (based on 1415 participants). Generally, direction and magnitude of progression depended on baseline values of FEV1 and FEV1/FVC as well as specific participant characteristics. Initial regression fits of individual outcomes (FEV1 change and FEV1/FVC change) using stepwise selection yielded goodness-of-fit measures17 shown in Table 2. Also included in this table are goodness-of-fit measures for the joint models. Pseudo R2 values for change-score models were 0.18 and 0.25 for the 5- and 10-year model fits, respectively, while they were at or above 0.80 for visit-specific outcome models (see Discussion for more detail). The relative strengths of the core predictors in the joint models are shown in Table 3. The results show that % emphysema, FRC, Pi10, and BMI were strong predictors of 5-year change, but also relatively strong in 10-year models, with BMI notably consistent between time frames. FVC/TLC, current smoking status, and BDR were strong in 5-year models but somewhat less so in 10-year models, while chronic bronchitis had a smaller but consistent contribution for the 5- and 10-year models. Some differences could be affected by the types of terms in the model for a given predictor (e.g., polynomial or certain interactions), which is reflected in the numerator degrees of freedom (DF). Model-based correlation between changes in FEV1 and changes in FEV1/FVC were 0.41 and 0.46 for 5- and 10-year models, slightly higher than those derived based on descriptive statistics. Appendix D in the online supplement shows parameter estimates for predictors in both 5- and 10-year change models.
Summarizing Predicted Values
Figure 2 shows the distribution of predicted values of 5-year change by direction, for those with predicted changes of at least 5% for the FEV1 and FEV1/FVC joint vector, stratified by GOLD group (see Figure S1 in the online supplement for 10-year change graph). As an example, the joint vector for a participant with predicted losses of 3% in FEV1 and 4% in FEV1/FVC would have a vector length equal to the square root of 3%2 + 4%2, or 5%, based on Euclidean distance. The majority of the predicted values with a change of at least 5% move to the left and down (LD), indicating an expected loss in both FEV1 and FEV1/FVC. (Both outcomes have percentage units, although FEV1 naturally has greater variability, which may explain why the greater expected change is with respect to FEV1 rather than FEV1/FVC.) Those in GOLD 1 and 2–3 have the highest percentage with expected changes of at least 5% moving left and down.
Figures S2 and S3 in the online supplement show a summary of the distribution of predicted values using density plots, overall and stratified by GOLD group, respectively. A value at the origin represents no predicted change in FEV1/FVC (y-axis) and FEV1 (x-axis). Both panels show that the center of the distributions are in the lower-left quadrants, showing some predicted losses in both FEV1 and FEV1/FVC. However, tails of the distribution do extend back into positive values for either FEV1 (lower right quadrant), FEV1/FVC (upper left quadrant), or both (upper right quadrant), suggesting that improvement for some participants is possible. Greater variability in predicted values is apparent in the distribution for 10-year predicted values, more noticeably for FEV1.
Factors Associated with Progression
Figure 3 demonstrates factors associated with predicted directional movement in FEV1 and FEV1/FVC for 5-year data; Figure S4 in the online supplement shows similar graphs for 10-year data. These plots show average participant z-scores for each variable at baseline, by predicted direction and GOLD groups; z-scores were used to allow for meaningful comparisons between variables. The graphed data are simply baseline data, classified based on directions of predicted outcomes derived from the linear mixed model fits. Bars extending away from the circle indicate greater than average baseline values for the associated variables (the longer the bar, the greater the average z-score), while those pointing back towards the circle origin reflect less than average values for the associated variables (i.e., negative z-scores). The z-scores were determined based on overall averages for the cohort. Those with predicted changes of at least 5% in magnitude (per 5 years) were included so that characteristics of those with higher expected progression could be identified, which correspond to one-third and one-fifth of the cohort for 5- and 10-year changes, respectively. (Average predicted magnitude of change was greater for 10-year data than 5-year data, but not after standardizing per 5 years.) Although not graphed, characteristics of participants with predicted vectors less than 5% in length are shown in Tables S1 and S2 in the online supplement.
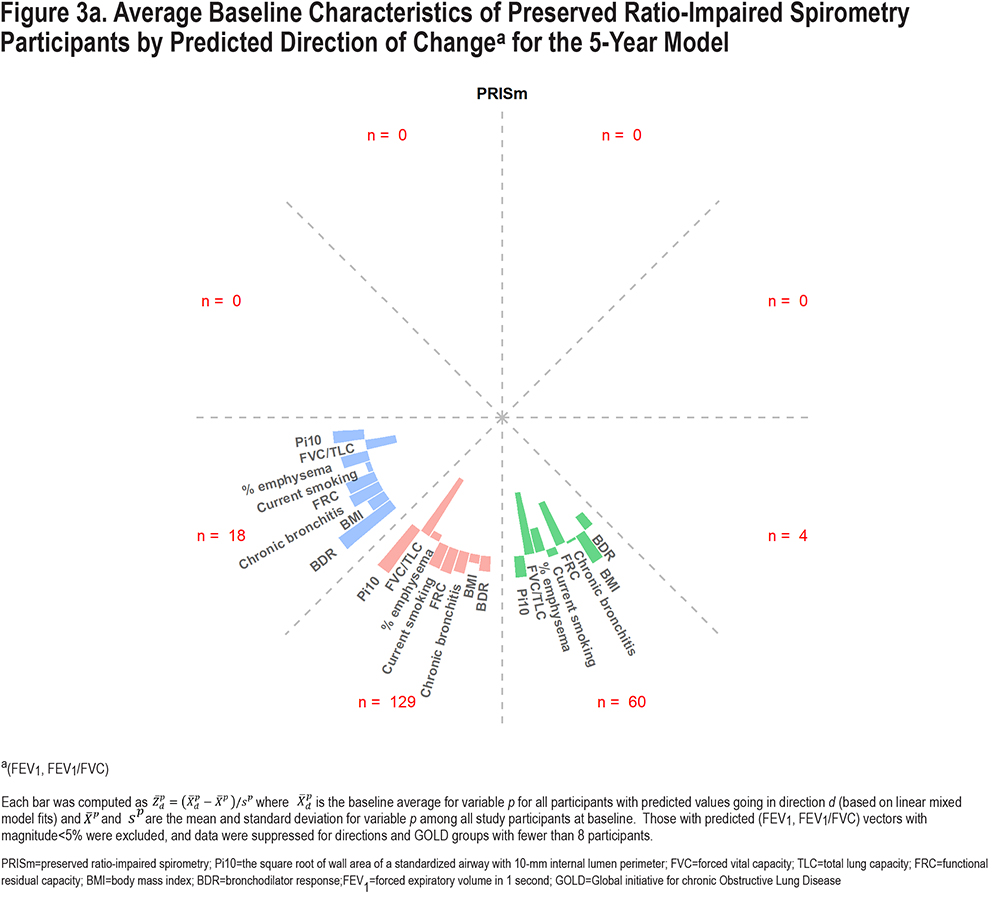
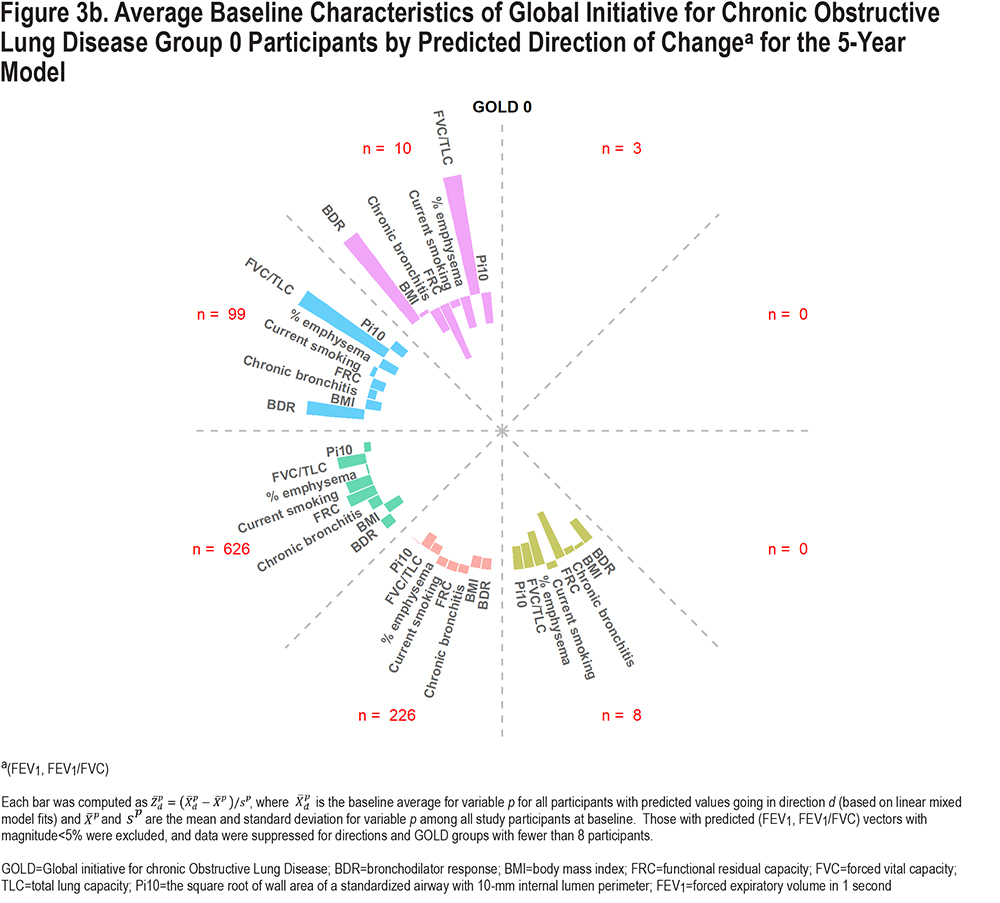
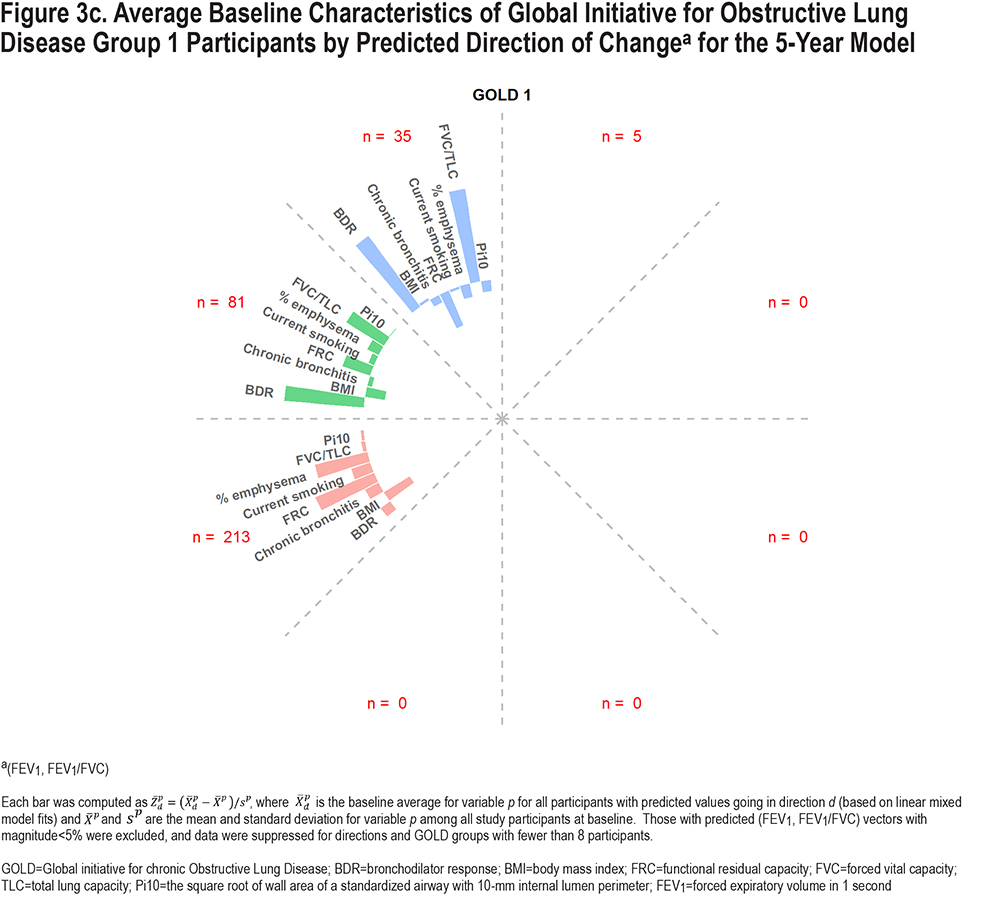
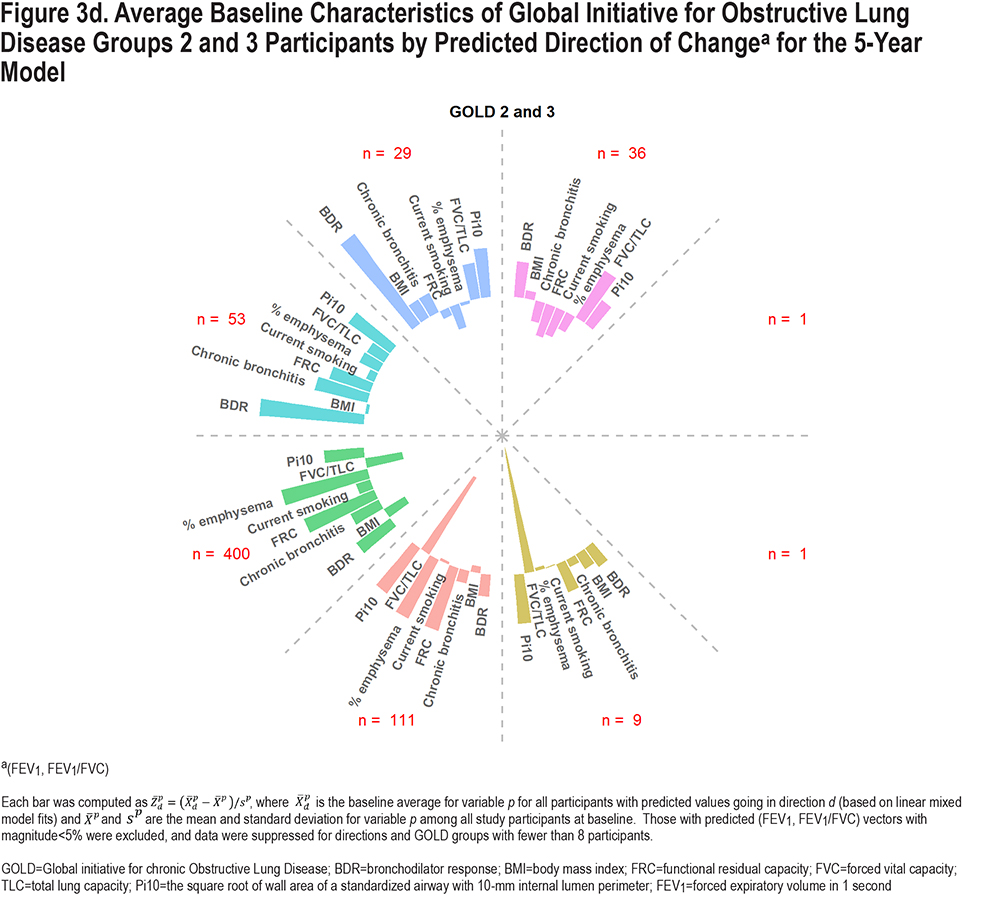
Overall, there are some common characteristics shown in the graphs in Figure 3. Those expected to lose FEV1/FVC (downward movement in graph) had lower baseline FVC/TLC, particularly for PRISm and GOLD 2–3, while predicted upward movement was associated with higher baseline FVC/TLC, particularly for GOLD 0 and 1. Greater predicted losses in FEV1 (movement left) but increases in FEV1/FVC were associated with higher baseline BDR rate. Predicted losses in FEV1 were associated with higher current smoking rates. The impact of % emphysema and FRC was more noticeable for GOLD 1 and GOLD 2–3, where those predicted to move left and down had higher baseline averages. Higher Pi10 and chronic bronchitis rates were associated with more predicted losses in FEV1 and FEV1/FVC for PRISm and GOLD 2–3. Higher BMI was associated with less pulmonary decline; GOLD 0–3 participants with lower BMI generally had greater predicted losses in FEV1 and FEV1/FVC, while PRISm participants with predicted increases in FEV1 had relatively high BMI. Expected movement down and to the right is not expected for GOLD 1 since they have relatively high FEV1 but relatively low FEV1/FVC at baseline (i.e., they are already in the lower right with respect to Figure 1). Similarly, predicted changes to the upper left are not expected for PRISm. Patterns shown in Figure S4 in the online supplement for 10-year predicted changes are similar, although directions represented were fewer and more concentrated.
As described earlier, predicted values were converted to magnitude and angle for each participant, for both 5- and 10-year models. Table S3 in the online supplement demonstrates these predicted values for 4 participants, along with baseline characteristics as well as observed and predicted changes for FEV1 and FEV1/FVC. Participant 1 started in GOLD 1 and had a high predicted loss in FEV1 but lower for FEV1/FVC, resulting in low angles (13.5° and 8° for 5 and 10 years, respectively), with predicted magnitudes above 5% for both time frames. Participants 2 and 4 had smaller predicted changes over time for both FEV1 and FEV1/FVC. Participant 3 had higher predicted loss in FEV1/FVC than FEV1 at 5 years (angle=72.4°), but relatively equal predicted losses by 10 years (angle=50.3°), with magnitudes surpassing 5% by 10 years. Table S4 in the online supplement shows average vector length (magnitude) and angles for 5- and 10-year models for the entire cohort, and then by GOLD classification. Groups with the largest predicted changes were in GOLD 1 and 2. Average angle for predicted vectors was low for GOLD 1 (reflecting more expected FEV1 loss than FEV1/FVC), and higher for PRISm (reflecting more expected FEV1/FVC loss than FEV1). GOLD 0 had relatively equal predicted losses in FEV1 and FEV1/FVC, reflected by the average angle of 44° for 10-year changes.
Tables S5 and S6 show movement in the GOLD groups after 5 years and 10 years, based on both observed changes and predicted changes in FEV1 and FEV1/FVC. The higher percentages for off-diagonal entries for observed changes reflect the inherent variability in spirometry measures. The predicted changes iron out some of this variability, leading to fewer participants with predicted movement backwards, e.g., from GOLD 1 to GOLD 0. While the majority of participants are not predicted to change GOLD classification over 10 years, 2% to 6% are expected to move from each of GOLD 0 to GOLD 1, PRISm to GOLD 2, and GOLD 1 to GOLD 2. Note that while multiple measurements are necessary for observed changes, predicted changes can be calculated for participants with only baseline data using the fitted model, which explains why more data are available for the latter.
Discussion
The proposed model allows for joint inference for changes in FEV1 and FEV1/FVC. Up to this point, prediction models have been developed for one outcome or the other, but not both simultaneously, to our knowledge. Our proposed model allows for joint inference, but results for one outcome or the other can also be derived from this model; results presented here suggest that such derived models are at least as good as those based on fully univariate models. However, one of the clear benefits of the joint model is that inference for magnitude and direction of joint change will be improved over those built upon univariate models, since these transformed outcomes involve both outcomes simultaneously, and they are correlated. Specifically, estimates are expected to be more accurate and confidence intervals shorter with the joint model approach.
Understanding baseline characteristics that predict changes in FEV1 and/or FEV1/FVC is important, as these 2 variables are used to jointly characterize the severity of COPD. Knowledge of specific characteristics will help clinicians know who to target for potential therapeutic intervention. As participants have specific starting points in defined GOLD groups, the models allow us to determine whether the predicted changes will move them between categories, although the actual predicted values themselves retain the most information. These models provide only one type of predicted information and can be combined with other predictive models to help clinicians and patients manage their health and understand who is at greater risk for progression of disease. The results could also be used as a first step to help elucidate understanding of disease subtypes. Although the model was not designed to determine impact of modifying participant behavior, it is possible that results here will motivate patients to modify certain behaviors (e.g., to quit smoking).
Some limitations of this work are that in practice, not all predictors may be available to calculate predicted values for participants and CT variables may be based on different algorithms. It is possible that another set of predictors will be found to be more optimal for other cohorts. Different model selection techniques may yield different results. For example, LASSO regression tends to select predictors more stringently. In some respects, the work here may be foundational. The methods demonstrated could be applied similarly for models with other participants, predictors, and outcomes. Another limitation of the work is that model estimates could be impacted by those lost to follow-up, particularly for the 10-year change data. However, we did find that the average baseline age of those used to fit the 5-year model was 59.22 years, compared with 58.74 years for those used to fit the 10-year model, suggesting age had minimal impact on loss to follow-up. We applied inverse weighting and multiple imputation techniques to longitudinal models for FEV1, 6-minute walk distance, and symptom scores (see Ragland et al)18 and found progression estimates to be similar to those without them. However, we found that participants who died after P2 tended to have greater health declines between P1 and P2 in the aforementioned outcomes, relative to those still alive after P2. Importantly, our models have allowed interactions between smoking status and time, allowing unique progression estimates by current/former status, which help to minimize impact of differential dropout due to this factor.
Goodness-of-fit measures presented here ranged from 0.18 to 0.25 for joint outcome changes between visits, and between 0.80 and 0.82 for visit-specific outcomes (P2 or P3) that use the baseline measure as a predictor. Change scores are naturally relatively more difficult to predict than the visit-specific outcomes, since they subtract out between-participant variability that can be predicted by the baseline FEV1. Bouiez et al7 also demonstrate this in their analysis, where R2 values for change ranged from 0.10 to 0.15 for change in FEV1 (over 5 years), and 0.90 for a future FEV1 value (0.91 for a temporal validation cohort). Chen et al5 presented predictive models for a future FEV1 value that yielded similar R2 values (between 0.79 and 0.91 for main study and validation cohorts) and for FEV1/FVC less than lower limit of normal (C-statistic of 0.76 for the main study). Their study involved the Framingham Offspring Cohort to examine those at risk of developing COPD. Participants had longer follow-up (average follow-up of 20 years) and predictors included demographics as well as measures from blood samples. One likely reason for lower R2 values in our study (considering prediction of future FEV1) was due to the restricted cohort we considered that removed those below the diagonal in Figure 1, and thus spanning a smaller scale of measures for both FEV1 and FEV1/FVC. There may also be predictive benefit to using model selection techniques with random forests rather than standard regression approaches. For purposes of this analysis, we wanted to retain a limited set of concrete predictors with specific coefficients; although future efforts may consider other model selection techniques such as those based on machine learning.
The models presented here suggest a protective effect of higher BMI; those in PRISm who were predicted to have improvements in FEV1 had higher than average BMI, and those in other groups had predicted losses in FEV1 with below average BMI. Cachexia (related to low BMI) has been recognized as a potential cause for increased mortality risk among COPD patients,19 although the impact of higher BMI on lung function in COPD has not been reported until more recently. Sun et al20 showed that even relatively high BMI was associated with less reduction in FEV1 through meta-analysis. In survival models, we also showed that higher BMI was associated with lower mortality risk until relatively high values (after adjusting for negative health effects of BMI via predictors such as 6-minute walk distance).21 One possible explanation for this potential protective effect was reported by Ora et al22 who observed a larger inspiratory capacity and lower operating lung volumes in obese COPD compared with normal weight FEV1 matched participants. In addition, Taher et al23 showed that mild-to-moderate obesity can result in chest wall strapping and hence, reduced pulmonary compliance and improved airflow, thus, partially offsetting the loss of elastic recoil due to emphysema.
For CT metrics, Fortis et al14 showed that lower FVC/TLC was associated with more obstruction as measured by FEV1/FVC. Higher FRC is indicative of air trapping.12 Increased airway wall thickening, as measured by Pi10, may result in narrower airway lumen and hence airflow obstruction as measured by FEV1 and FEV1/FVC. Based on these findings, it is not surprising that lower FVC/TLC and higher Pi10 and FRC are associated with greater predicted losses in lung function. Our results show how these CT metrics, along with % emphysema, are associated with FEV1 and FEV1/FVC. Losses in both FEV1 and FEV1/FVC were apparent for those with higher baseline emphysema, mainly for GOLD 1–3 groups; FVC/TLC was mainly associated with losses in FEV1/FVC; increased Pi10 and FRC were associated with losses in both FEV1 and FEV1/FVC, mainly for PRISm and GOLD 2–3 participants. Among other variables, current smoking was associated with greater losses in FEV1 (relative to former smokers), and BDR was associated with greater predicted losses in FEV1, but improvement in FEV1/FVC. The latter may be partially explained by more air trapping with greater airflow obstruction and hence, a decreased operative FVC (pseudo-restriction). Chronic bronchitis appeared to be more related to FEV1/FVC than FEV1.
Predicted values are not expected to be perfect measures of change for individuals. However, there are some benefits of focusing on predicted changes rather than observed changes for individuals. First, they help to address the high variability that is inherent to spirometry measurements by estimating expected (or average values) using a set of baseline predictors. Second, predicted values can be obtained for individuals with no follow-up measurements; once the model is fit using observed changes from available individuals, predicted changes can be estimated for any individual with baseline data.
Acknowledgements
Author contributions: MS was involved in the conception and design of the study, data analysis, authorship and editing; MS and AK were involved in development of analytical tools related to the statistical model; AK, DB, DL, AE, AB, ES, ER, and SB assisted in manuscript editing and writing; JC was involved with study conception and project oversight. All authors significantly contributed to the intellectual content of the article and gave final approval of the version to be published.
The authors wish to thank the thousands of patients who participated in the COPDGene® study over the last 10 or more years.
Declaration of Interest
MS, AK, DB, DL, ER, JC, EA, and AB have no declarations. EKS declares grant support from GlaxoSmithKline and Bayer over the past 3 years. SPB has served on advisory boards for Boehringer Ingelheim and Sanofi-Regeneron and received fees for continuing medical education from Integrity CE.