Running Head: Improving Identification of AATD in COPD
Funding Support: This study was supported by Grifols Shared Services of North America, Inc.
Date of Acceptance: November 19, 2024 | Publication Online Date: December 4, 2024
Abbreviations: AAT=alpha-1 antitrypsin; AATD=alpha-1 antitrypsin deficiency; COPD=chronic obstructive pulmonary disease; SERPINA1=Serpin family A member 1; RWD=real-world data; EHR=electronic health records; ICD-9/10=International Classification of Diseases, Ninth and Tenths Revisions; XGBOOST=extreme gradient boosting; AUC=area under the curve; ROC=receiver operating characteristic; SHAP=Shapley additive explanations
Citation: Pfeffer DN, Dhakne R, El Massad O, et al. Improving the likelihood of identifying alpha-1 antitrypsin deficiency among patients with COPD: a novel predictive model using real-world data. Chronic Obstr Pulm Dis. 2025; 12(1): 1-11. doi: http://doi.org/10.15326/jcopdf.2023.0491
Online Supplemental Material: Read Online Supplemental Material (429KB)
Note: A portion of this work was presented as an abstract at the CHEST 2022 Annual Meeting in Nashville, Tennessee.
Introduction
Alpha-1 antitrypsin deficiency (AATD) is an autosomal, codominant genetic disorder characterized by low serum protein levels of the protease inhibitor alpha-1 antitrypsin (AAT), resulting in an increased risk of chronic obstructive pulmonary disease (COPD), bronchiectasis, and/or liver disease.1-3 AATD typically presents in individuals who inherited 2 disease-associated variant alleles of the gene that encodes AAT, serpin family A member 1 (SERPINA1), with over 200 variations associated with altered protein production, folding, or glycosylation.4 Notably, patients with AATD-associated COPD have higher rates of AATD-related comorbidities (i.e., pulmonary heart disease, chronic liver disease, cirrhosis, and liver transplantation) than patients with non-AATD COPD.5 Therefore, the ability to distinguish AATD-associated COPD from non-AATD COPD would help to more efficiently identify patients for confirmatory genetic testing, as well as those who may derive benefit from AATD-specific therapies and earlier treatment.
The estimated prevalence of AATD is 1% to 3% of patients with COPD, however, AATD is under recognized, with approximately 90% to 95% of patients remaining undiagnosed.1,2,6,7 Brantly et al suggested that targeting tests for symptomatic patients with bronchiectasis or cryptogenic liver disease and family members of known AATD patients would yield a higher detection rate.1 Current guideline recommendations from the American Thoracic Society, the European Respiratory Society, and the Alpha-1 Foundation advocate that all COPD patients be tested for AATD.8,9 Despite these universal guidelines and that AATD testing can be conveniently administered free of charge to patients in home self-test kits, a large majority of COPD patients do not undergo genetic testing.8,9 This lack of testing is primarily driven by the low detection rates (1 in 100) observed when testing broad COPD populations. As a result, individuals with AATD frequently experience prolonged delays to diagnosis (estimated range: 5 to 8 years) from the onset of their COPD symptoms.6 This delay in diagnosis may result in significant disease exacerbations and progression, as well as shorter overall and transplant-free survival time.10-12 Therefore, along with more opportunities to be tested, additional strategies are needed to improve the accuracy of identifying AATD-positive patients within COPD populations, to improve detection rates, and to minimize delays in diagnosis. This model is one such strategy.
Augmentation therapy involves infusion of human plasma-derived AAT and is currently the only AATD-specific pharmacological intervention.13 However, there are many other benefits to establishing an AATD diagnosis that relate to smoking cessation, and avoidance of obesity, that may slow disease progression.14-16 Among patients with the most severe form of AATD, augmentation therapy is associated with decreased mortality risk, as well as reduced rates of lung density loss and emphysema progression.17-21
Developing computer models to assist in diagnosing AATD patients has been hampered by the small number of AATD-diagnosed patients in available real-world data (RWD).22,23 Recent attempts are aided by 2 important developments that help overcome this limitation. One is the advent of big data where the size and comprehensiveness of patient records and databases have grown.24 A second advancement has been in the use of machine learning programs for developing models. Notably, machine learning-based models have found recent success in predicting readmission after hospitalization for COPD, and predicting outcomes of AATD-associated liver disease.25,26 To aid in the detection of AATD-positive patients in the general COPD population, this study developed a novel, predictive model that uses both RWD and machine learning algorithms. Individuals identified by use of this model might be candidates for lifestyle modification, AATD-related therapy, and/or clinical trials of novel therapies.
Methods
Data Sources and Patient Selection
In this study, U.S. open claims data and electronic health records (EHR) were utilized to identify AATD-positive and AATD-negative patients with COPD using diagnosis codes, treatments prescribed, and laboratory tests. EVERSANA®’s EHR and open-claims payer databases were linked via Datavant Tokenization to extract the model population. EVERSANA®’s EHR represents approximately 115 million U.S. patients from >2000 outpatient clinics and 50 hospitals running >30 different EHR software solutions between 2014 and 2022. Open-claims payer data (i.e., sourced from providers) were extracted from the Symphony Health IDV®, a health care database that integrates deidentified data from physician practices, pharmacies, and hospitals for over 280 million active unique patients (2018–2022) in the United States across commercial, Medicare, and Medicaid plans.
The model’s initial population included patients with ≥1 COPD diagnosis code. Of these patients, those who met ≥1 of the following criteria were considered AATD positive: (1) ≥2 AATD diagnosis codes in claims, (2) an AATD diagnosis code in the HER, (3) a positive laboratory test for AATD, or (4) the use of an AATD-related medication (i.e., augmentation therapy). A positive laboratory test for AATD was defined as having an abnormal serum AAT level (i.e., <90mg/dL) in the EHR and/or a confirmatory genotype test of the SERPINA1 gene. Conversely, AATD-negative status was determined by a negative laboratory test for AATD. Together, the AATD-positive and AATD-negative groups constituted the final evaluable population. This population was then randomly divided, with 75% used to train the model and the remaining 25% to test and confirm the model.
Feature Selection
Potential predictor features (i.e., multivariate, nonlinear features), that are shared between the AATD-positive and AATD-negative groups, were used to build a predictive model. These features included common International Classification of Diseases (ICD), Ninth and Tenth Revisions diagnosis codes (ICD-9/ICD-10), treatments grouped by generic name, and common laboratory tests grouped by component type. The results of the laboratory tests were grouped as follows: (1) low (i.e., bottom third of the expected range); (2) medium (i.e., middle third of the expected range); (3) high (i.e., upper third of the expected range); and (4) abnormal (i.e., any result that was abnormally higher or lower than the expected range). AAT levels were excluded as a laboratory feature since the model was built with the assumption that AAT laboratory values would not consistently be available. All features included in the predictive model were binary (i.e., if a patient had a diagnosis/treatment/laboratory result, the feature would be assigned a value of 1; otherwise, the value was 0), with the exception of age (continuous feature).
Predictive Model Development
A predictive model (predicting AATD positivity) was trained using the randomly selected training population (75% of the dataset) and extreme gradient boosting (XGBoost), a machine learning technique.27 This technique sequentially builds multiple decision trees, which allows for error corrections in a stepwise and gradual manner (i.e., the errors in early trees are corrected in trees that are generated later). The boosted decision trees generally minimize the errors of the previous trees by using a gradient descent algorithm. XGBoost further enhances gradient-boosted decision trees by adding regularization terms on the final weights. Regularization terms help the model to prevent overfitting, learn to handle sparse data, and provide general optimizations to decrease the time required to train a model. Over 500 features were incorporated into the present model, and more than 20 models were run using different samples and exclusion rules, to optimize the model’s predictive power. The performance of the final model was assessed in the randomly selected testing population (25% of the dataset) by examining the area under the curve (AUC) of the receiver operating characteristic (ROC; true positive rate versus false positive rate) curve.
Assessment of Feature Importance
The features found to be most important in the predictive model were first identified using the default XGBoost feature importance scoring, which is based on the average information gain across all splits (decisions in the tree) in which the feature was used. The Shapley additive explanations (SHAP) approach was utilized to quantify the contribution of each feature in correctly predicting whether a patient was AATD-positive or AATD-negative.28,29 The SHAP analysis was performed using the TreeExplainer method on the produced XGBoost model.
Results
Cohort Definition and Demographics
A total of 10,449,445 patients with ≥1 COPD code were identified in the combined open claims and EHR datasets. Of these, 2902 patients were excluded from analysis, as they were classified as AATD-positive but had a negative test result. From the remaining 10,446,543 patients, 13,585 AATD-positive patients (0.1% of the cohort) and 7796 AATD-negative patients were analyzed (Figure 1).
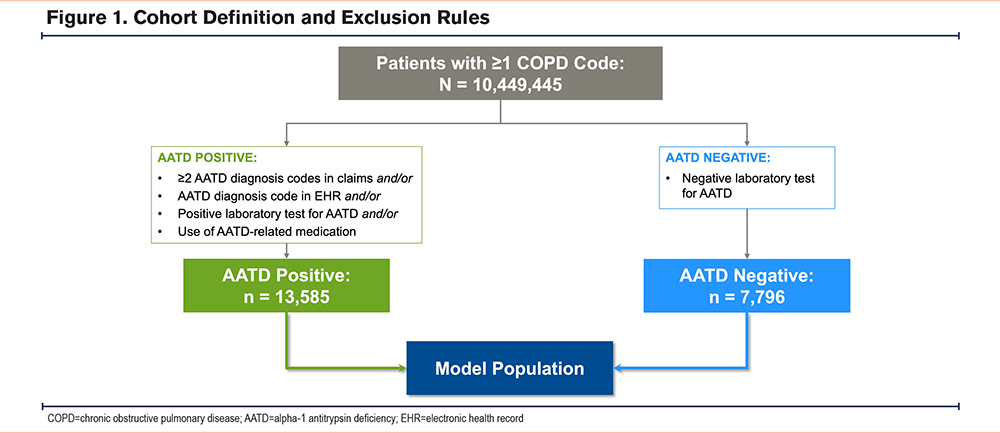
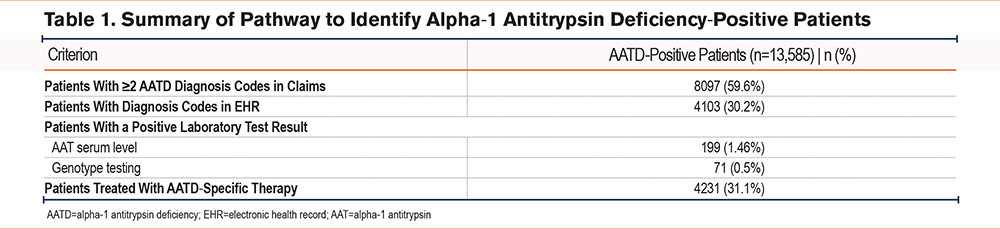
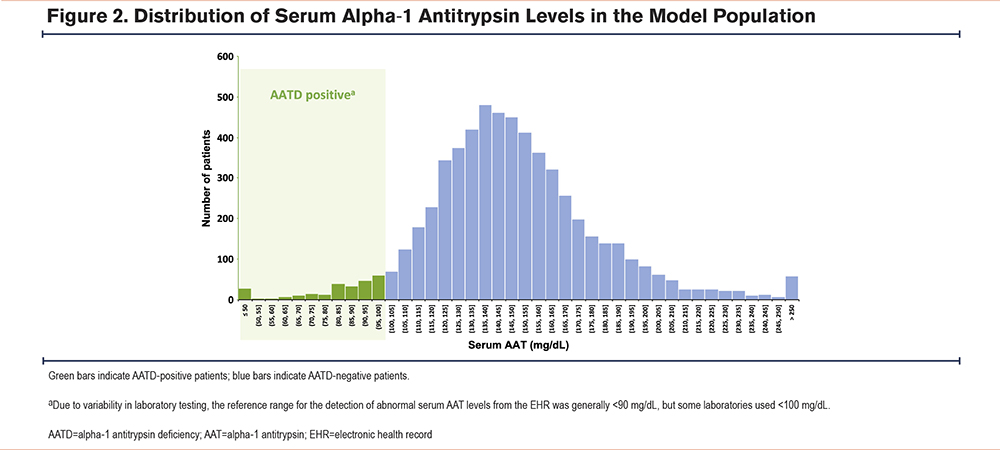
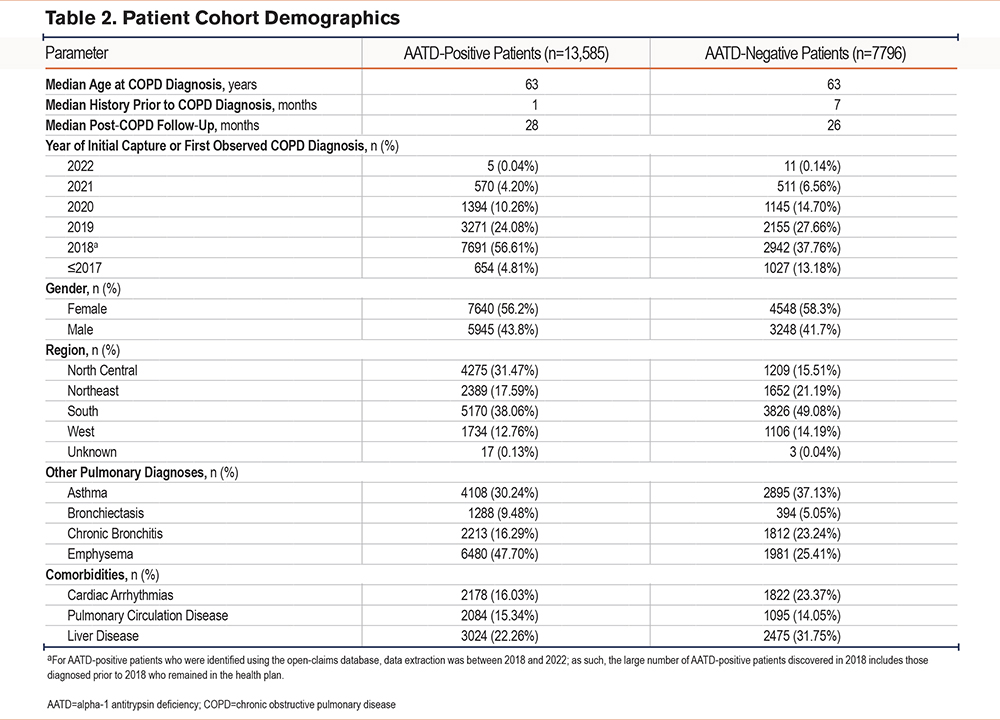
Among the AATD-positive cohort (Table 1), most patients were identified using ICD diagnosis codes, with a subset identified based on low serum AAT levels (i.e., generally <90mg/dL, although some laboratories used a reference threshold of <100mg/dL for abnormally low serum AAT levels) (Figure 2). Nearly one-third (31.1%) of patients had received an AATD-specific medication. Cohort demographics are summarized in Table 2. In both groups, the median age at COPD diagnosis was 63 years and more than half were female (AATD-positive: 56.2%; AATD-negative: 58.3%). The median recorded patient history prior to a COPD diagnosis was 1 and 7 months in the AATD-positive and AATD-negative groups, respectively; both cohorts had a similar median post-COPD follow-up time (AATD-positive: 28 months; AATD-negative: 26 months). Many of the patients (40% to 50%) were located within the southern region of the United States at diagnosis. Compared with the AATD-negative group, patients in the AATD-positive group had higher rates of bronchiectasis and emphysema, but lower rates of asthma and chronic bronchitis. Further, higher rates of cardiac arrhythmias and liver disease were observed in the AATD-negative group compared with the AATD-positive group. The latter may reflect the exclusion of the estimated 3.2% of patients with AATD who have independent liver involvement (i.e., without obstructive lung disease),30 given the present model exclusively focuses on COPD patients.
Feature Importance
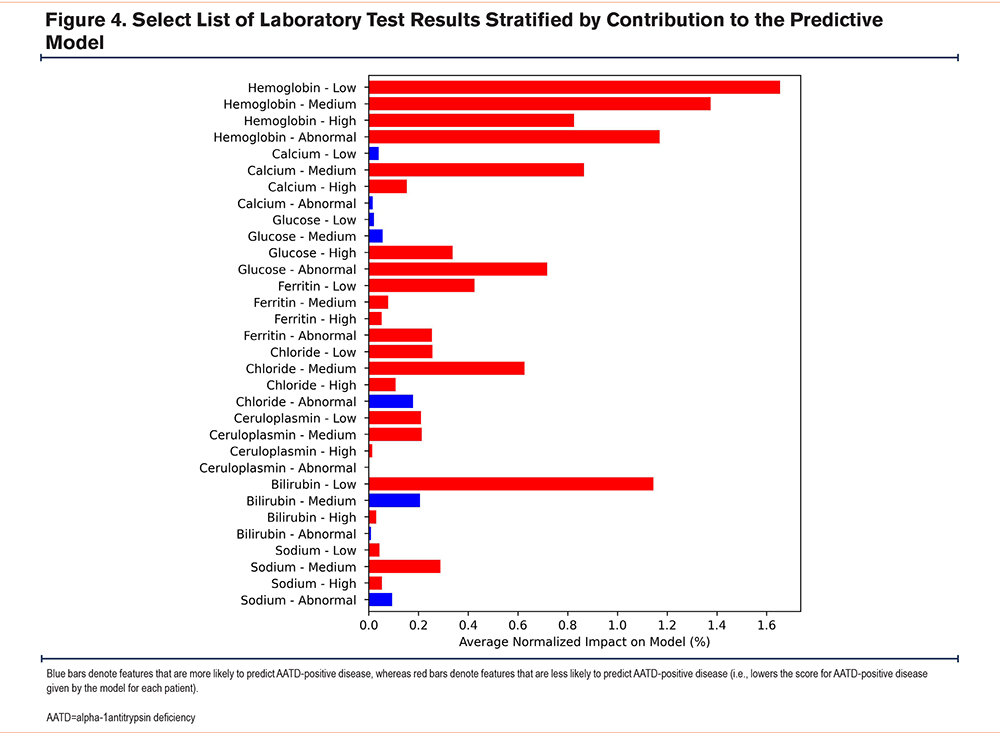
Among the >500 features included in the initial predictive model, the inclusion of non-AATD−related laboratory test results was critical for model prediction (Supplementary Figure 1 in the online supplement). First, among laboratory test results, key predictors of a positive or negative AATD diagnosis included calcium, glucose, hemoglobin, ferritin, and bilirubin levels. Normal calcium levels and low bilirubin levels were indicators of being AATD negative. Abnormal or high glucose levels were associated with being AATD negative, whereas, low or normal glucose levels had a small positive impact on predicting AATD-positive cases. In order to further characterize the impact of these features in distinguishing AATD-positive or -negative cases, SHAP values were estimated to identify each individual feature’s magnitude and direction on the predictive model.
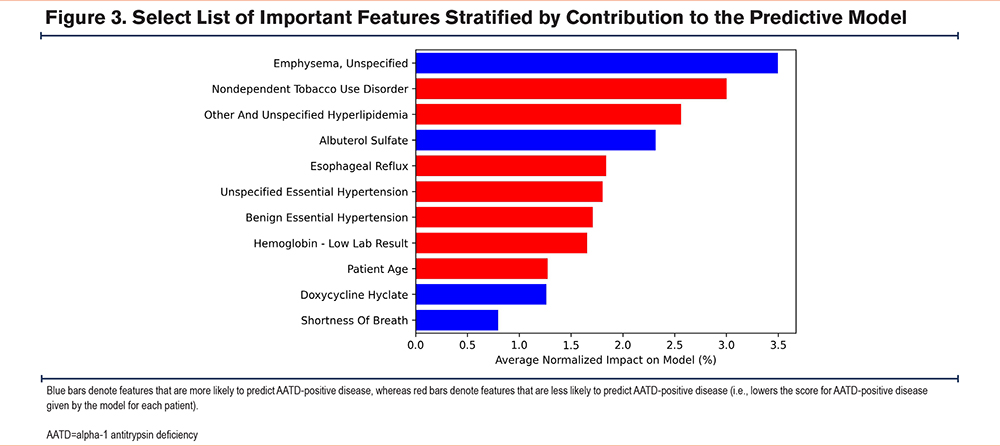
The features most likely to predict AATD cases included having emphysema, shortness of breath, as well as the use of albuterol sulfate and doxycycline hyclate (Figure 3). Features that were less likely to predict AATD-positive disease included hyperlipidemia, hypertension, esophageal reflux, low hemoglobin levels (i.e., bottom third of the expected range), smoking-related features, and older age (Figure 3).
Secondly, for laboratory features, the values were split into tertiles (i.e., low, medium, and high within the expected range) and abnormal (i.e., outside the expected range). Combining abnormally high or low patients into a single category resulted in a small degree of information loss relative to the use of a separate group for each, although this likely had a negligible impact on the overall model results. Of the top laboratory results included in the model, hemoglobin, ferritin, and the hemogram/platelets/differential panel were less likely to be associated with being AATD positive, regardless of whether the values were within the expected range (low, medium, high, or abnormal). Ceruloplasmin showed a similar pattern, with the exception of the abnormal ceruloplasmin group (Figure 4). Having normal chloride levels was a good indicator of being AATD negative.
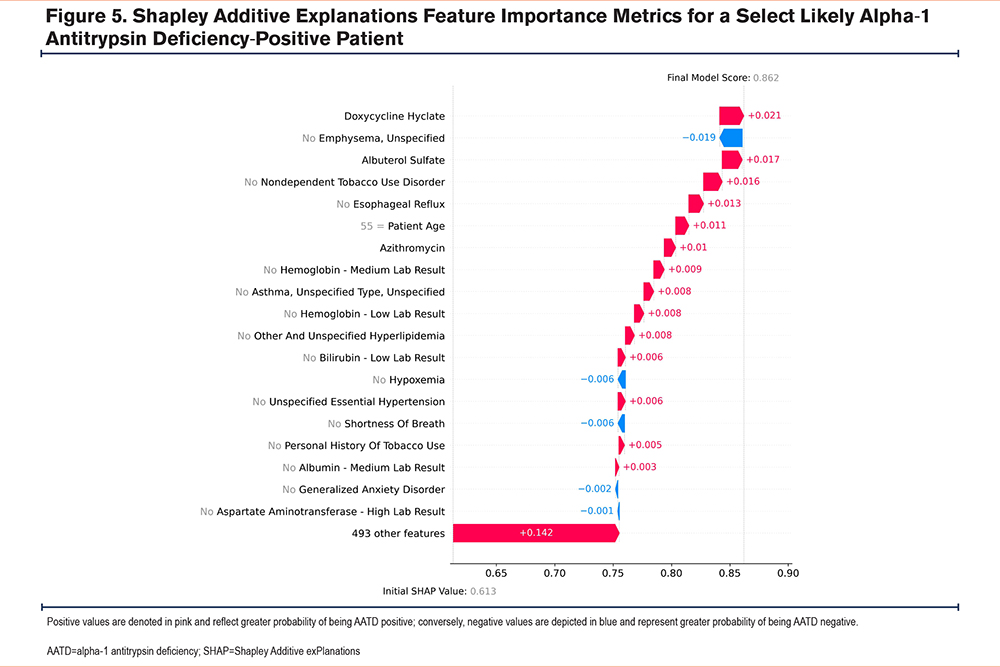
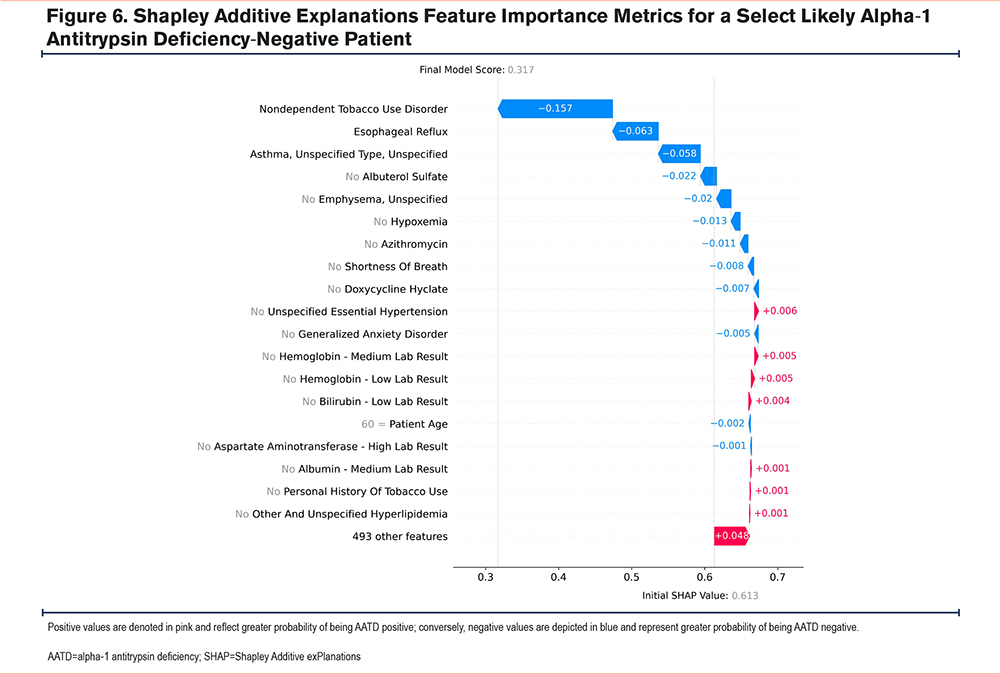
Cumulatively, these findings highlight the model’s complexity, as there are multiple paths (i.e., trees) that a feature could take when predicting AATD-positive or -negative status, owing to the complex interactions between the model’s features. For example, an AATD-negative patient could have a hemoglobin level that is within the lower third of the expected range in combination with a specific set of features, whereas, an AATD-positive patient could have a similar hemoglobin level but in combination with a different set of features (Figure 5 and Figure 6). Lastly, as the model assesses multiple features simultaneously, features that are correlated with each other (e.g., age and cardiovascular comorbidities, given their greater prevalence with increasing age) may be used as a proxy for these other features.
Performance of the Predictive Model
In this study, the final model was quite accurate in predicting known AATD-positive and AATD-negative patients. The final model had a combined AUC -ROC curve of 0.9, indicating high predictive power for an AATD diagnosis (Supplementary Figure 2 in the online supplement). The model’s sensitivity and specificity varied based on the chosen threshold. When a threshold of 0.49 was set, the sensitivity and specificity were both 0.82, meaning that 82% of AATD-positive patients would be correctly identified, but simultaneously, 18% of AATD-negative patients would be incorrectly classified as AATD positive. Increasing the threshold to 0.68 reduced the sensitivity to 0.68 while increasing the specificity to 0.93 (i.e., 68% of AATD-positive patients would be correctly labeled, and 7% would be incorrectly labeled as AATD positive). Based on the current model performance, to identify one patient with confirmed AATD, subsequent confirmatory testing would be needed for 25 individuals categorized as likely AATD-positive patients (assuming a conservative 1% prevalence of AATD among patients with COPD). This is much better than the current 1 in 100 detection rate in real-world clinical settings.1
Discussion
AATD is an underdiagnosed disease, even among COPD patients and the resulting delays in diagnosis and proper treatment lead to an increased risk of long-term complications and exacerbations.21,22 In fact, these data showed that of approximately 10.5 million COPD patients, only 21,381 had been tested. While this could be an artifact of the data and limitations in its collection and retention, the apparent lack of testing is notable. This study demonstrated that predictive modeling using RWD from EHRs and open-claims databases based on machine learning techniques can improve predictive likelihood of AATD among COPD patients. Our model yielded high predictive power for an AATD diagnosis with an AUC-ROC curve of 0.9. Given these results, the next step will be to run the model in real-world population demonstration projects. If validated, health care practitioners could then target individual patients who could benefit from AATD therapy, family testing of at-risk individuals, or lifestyle modifications (e.g., smoking cessation for lung disease and weight loss for liver disease).14-16
This model used common patient features that are almost universally collected at the patient level, as identified through ICD codes, generic drug names, and lab components. Features that were among the top predictive features for classifying AATD-positive patients included symptoms and comorbidities like shortness of breath and emphysema,31 as well as medications for COPD-related symptoms (albuterol sulfate and doxycycline).32,33 In contrast, nondependent tobacco use disorder, hypertension, and older age were features associated with a greater likelihood of not having AATD. In a systematic literature review by Miravitlles et al, exposure to tobacco smoke was shown to impact the severity of lung disease among patients with AATD.31 In one study, AATD patients with COPD had lower rates of cardiovascular and related comorbidities (e.g., hypertension) compared to patients with COPD alone.34 Another study reported higher rates of chronic pulmonary heart disease in COPD patients with AATD.5 Further, features that may impact disease progression/prognosis among AATD-positive patients with COPD may not necessarily be key features in identifying AATD-positive patients from a broader population of patients with COPD. In other words, diagnostic associations may differ from features that may drive AATD progression.
In rare diseases, ROC curves for positive and negative predictive value require additional considerations when these diagnostic algorithms are transitioned to clinical practice. The current model generated 82% specificity and 82% sensitivity at a threshold of 0.49. Assuming 1% of patients with COPD have AATD, for every 1000 patients suggested by the algorithm, an 82% capture would find 8 out of 10 individuals with AATD. However, 18% of the patients without AATD (990 patients) would require 178 negative tests. Therefore, the algorithm would improve testing yields from 1% to 4.3% (i.e., 8/[178+8]). Therefore, higher specificity at the cost of lower sensitivity is important in rare disease testing. The value of predictive models is the ability to make decisions that complement the capability of any hospital system. Further, the ability to find carrier genotypes would identify families in which further genetic testing could occur for COPD or individuals with liver disease.
As opposed to prior strategies that identified potential AATD-positive patients using electronic medical records and electronic patient messages data,22 our model included non-AATD−specific lab test results, and some turned out to be critical predictors of being AATD positive. However, not all laboratory tests were found useful. Some, like normal bilirubin, abnormal sodium, abnormal chloride, and medium glucose, were only moderately predictive of being AATD positive. Interestingly, there were several laboratory test-features that were less predictive of being AATD positive regardless of their level (i.e., hemoglobin, ferritin, and ceruloplasmin). The reason that some laboratory tests were included in the final model, while others were not, is also nuanced. Bilirubin levels that were within the lower third of the expected range were associated with being AATD negative. One would reason that this finding may reflect differences in subtle liver disease in adults with or without AATD. However, there is likely no impact on calcium levels from AATD lung or liver disease. The care providers ordering these tests ordered them for a reason that might have included having a complicated patient who needed a comprehensive metabolic panel. Therefore, the model reflects both objective and subjective aspects of the health care practitioner’s mindset and the health care systems in which they live.
There are limitations to this project. There is no large, real-world database in which the AATD genetic status of all participants is known. Further, the present model was solely informed by data obtained from patients with COPD. The exclusion of patients with AATD who have independent liver involvement may have contributed to the lower rates of liver disease among AATD-positive individuals and could reduce the generalizability of results to the minority of patients without apparent lung involvement. Therefore, there are inherent biases associated with the prediction of AATD patients with comorbid COPD.
Additionally, the current algorithm was designed to find carriers of one variant allele. Although ICD-10 codes are available for carrier status individuals, they are rarely used and cannot improve this limitation. Some of the ICD codes used for the project will have been placed by health care providers for genetic testing that ultimately showed normal genetics. Others would be placed to identify carriers in the medical record, a useful endeavor to remind clinicians of the increased risk of lung and liver disease associated with the carrier state. Because other symptomatic individuals with lung or liver disease can reside in these families, cascade testing can follow recognition of an AAT carrier. Lastly, most patients were first captured during 2018–2019 (n = 16,329), with relatively few captured during 2020–2022 (n = 3636), with the latter time period potentially reflecting lower rates of testing or medical visits during the COVID-19 pandemic.
Conclusions
The use of predictive modeling based on machine learning algorithms and RWD shows promise in assisting physicians in identifying COPD patients who may be at high risk of having AATD. It holds promise for identifying which COPD patients are good candidates for genetic testing. In turn, reducing the number of genetic tests required to identify an AATD patient will reduce the duration of the undiagnosed disease journey. Ultimately, identifying at-risk patients earlier through targeted testing can result in slowing disease progression and improved genetic testing in the remainder of the family. External validation of this model is warranted to assess its generalizability to other real-world settings including among non-COPD populations.
Acknowledgements
Author contributions: All named authors meet the International Committee of Medical Journal Editors criteria for authorship: all had full access to all the data, take responsibility for the study’s integrity and accuracy of analyses, and have given their approval for its publication. All authors participated in and contributed to study design, data interpretation, and manuscript review and preparation. Data development and analyses were primarily performed by authors associated with the Department of Data and Analytics at Eversana.
Data sharing statement: The individual, de-identified participant data are available from Eversana. The statistical analysis plan is provided in the text. Additional information can be obtained from the corresponding author upon reasonable request.
Joshua Gauci and Neeti Vashi (Eversana) are acknowledged for medical writing assistance.
Declaration of Interests
CS has grants paid to the Medical University of South Carolina from Dicerna, Grifols, Krystal, and Takeda and is a consultant to AstraZeneca, Vertex, and Wave Life Sciences for alpha-1 antitrypsin deficiency. He is a medical director at AlphaNet. MCR, TA, and MC are employees of Grifols, SSNA, Inc. RD, OEL, DP, and PS are current or former employees of Eversana Life Sciences, Inc.