Running Head: Diagnosing Type 2 Inflammation in COPD
Funding Support: This work was funded by an institutional grant from Amgen (RGB and IZB).
Date of Acceptance: July 21, 2025 | Published Online: August 6, 2025
Abbreviations: 6MWD=6-minute walk distance; Abs=absolute; BEC=blood eosinophil count; BMI=body mass index; CAT=COPD Assessment Test; CBC=complete blood count; CDC=cell differential counts; CI=confidence interval; COPD=chronic obstructive pulmonary disease; CRP=C-reactive protein; CT=computer tomography; ECOPDs=exacerbations of COPD; Eos=eosinophil; ESR=erythrocyte sedimentation rate; FACS=fluorescence-activated cell sorting; FEV1=forced expiratory volume in 1 second; FVC=forced vital capacity; GOLD=Global initiative for chronic Obstructive Lung Disease; ICC=interclass correlation coefficient; ICS=inhaled corticosteroids; IFN=interferon; IL=interleukin; IL-13RA1=interleukin 12 receptor, alpha 1; IQR=interquartile range; mMRC=modified Medical Research Council dyspnea scale; Ne=neutrophil; Ne/Ly=neutrophil to lymphocyte ratio; SD=standard deviation; SGRQ=St George’s Respiratory Questionnaire; SpE%=sputum eosinophil percentage; TNF=tumor necrosis factor; UCLA=University of California, Los Angeles; WBC=white blood cell
Citation: LeMaster WB, Ingersoll SA, Phee H, et al. Diagnosing type 2 inflammation in COPD: comparison of blood and sputum eosinophil assessment in the University of California, Los Angeles COPD phenotyping study. Chronic Obstr Pulm Dis. 2025; 12(5): 368-379. doi: http://doi.org/10.15326/jcopdf.2024.0599
Online Supplemental Material: Read Online Supplemental Material (313KB)
Introduction
Cell biomarkers provide a means of understanding the underlying mechanisms in chronic obstructive pulmonary disease (COPD), potentially predict disease progression, and thereby, modify diagnostic and therapeutic approaches.1 A subset of COPD patients has increased absolute blood eosinophil counts (BEC),2 which has been associated with an increased risk of exacerbations3 and a favorable clinical response to treatment with inhaled corticosteroids (ICS).4These data led to the inclusion of this biomarker as a relevant endpoint in clinical trials5 and a therapeutic algorithm in COPD management.6 Recently, a biologic agent targeting type 2 inflammation was approved for treating COPD patients with elevated eosinophils.7 Despite this, the nuances of using eosinophils to guide therapy and predict clinical outcomes have remained controversial. Several large cohort studies that have evaluated blood eosinophilia concerning COPD outcomes have revealed discordant results. In an analysis by Hastie et al,8 blood eosinophils alone were not a reliable biomarker for COPD severity or exacerbation risk, and a high sputum eosinophil percentage (SpE%) was a better biomarker than BEC to identify a patient subgroup with more severe disease, more frequent exacerbations, and increased emphysema on quantitative computer tomography (CT) imaging.9
Analyzing data from the COPD Phenotyping Study,10-13 we sought to evaluate the biomarker profile and clinical characteristics of patients diagnosed with eosinophilic COPD using BEC≥300 cells/μL and SpE%≥2% as criteria and to evaluate differences between these 2 biomarkers and their clinical implications.
Methods
The COPD Phenotyping Study was a prospective, observational cohort study performed at the University of California, Los Angeles (UCLA) in partnership with Amgen (Thousand Oaks, California).10-13 Participants, enrolled from 2016–2019, were ≥40 and ≤80 years of age, had a smoking history of ≥10 pack years, and a clinical diagnosis of COPD. Clinical stability was defined by being on a stable medication regimen without exacerbations of COPD (ECOPDs) for ≥3 months before enrollment. Participants were excluded if they had asthma, pulmonary parenchymal disease, or had taken oral corticosteroids within 2 weeks before enrollment. The study was comprised of 3 visits. At the baseline Visit 1 (V1) and 3-month follow-up Visit 2 (V2), a detailed medical history was obtained, blood and sputum specimens were collected, pulmonary function was assessed by postbronchodilator spirometry following American Thoracic Society guidelines,14 functional exercise capacity was tested by the 6-minute walk test, dyspnea was assessed using the modified Medical Research Council (mMRC) dyspnea scale,15 respiratory symptoms were assessed with the COPD Assessment Test (CAT),16 and health-related quality of life was assessed with the St George’s Respiratory Questionnaire (SGRQ).17 All enrolled participants, including those in Global initiative for chronic Obstructive Lung Disease (GOLD)6 stage 0 as determined by postbronchodilator spirometry, were included in the main analysis. One year after the baseline visit, a third visit (V3) consisted of a phone interview to capture symptoms and COPD exacerbation episodes within the year after enrollment in the study. All participants consented to participate in the study, which was approved by the UCLA Office for the Protection of Research Subjects (Institutional Review Board #14-000748).
Blood and Sputum Sample Collection and Processing
Venous blood sampling and spontaneous sputum sample collection were attempted in all enrolled participants. If spontaneous sputum collection was not feasible, patients with forced expiratory volume in 1 second (FEV1) ≥1.2 liters on spirometry underwent sputum induction by inhalation of nebulized 3% saline solution after pretreatment with albuterol. Collected specimens were split and processed within 2 hours at UCLA or stored on ice and sent to Amgen Thousand Oaks.
Eosinophils were assessed by cell differential counts (CDC) performed at UCLA using manual microscopic assessment for sputum and automated (Sysmex XN-3000, Sysmex Corporation; Kobe, Japan) for blood. Supernatants were collected and stored at -80°C and later analyzed at UCLA using Human Luminex® Discovery Assay (LXSAHM-15, Bio-Techne; Minneapolis, Minnesota). Samples for fluorescence-activated cell sorting (FACS) were cryopreserved and shipped to Amgen for analysis. Immune cell populations were identified by gating on live, single CD45+ cells. Eosinophils were further characterized within this population by gating on CD66b+ and CD16-/Siglec-8+ subpopulations.
Exacerbation Cohort
As a separate arm of this study, we recruited participants who, in addition to the main cohort inclusion criteria, also had a current severe ECOPD requiring an emergency department visit or hospitalization at UCLA. These COPD patients were enrolled in the study within 24 hours of initial admission to the hospital. All participants in this arm of the study were expected to return for a follow-up in-person visit 3 months after the ECOPD at a self-reported baseline state. Inflammatory biomarkers were compared within this cohort during the exacerbation of COPD and afterward when clinically stable, and values during these episodes were also compared to those in the main steady-state cohort.
Statistical Analysis
To characterize eosinophilic inflammation, we used an absolute BEC≥300 cells/μL as a blood-based and SpE%≥2% of sputum cells as a sputum-based cut-off.18 We compared participant characteristics with and without an eosinophilic phenotype with standard bivariate tests of significance. To determine repeatability of continuous parameters, we used the interclass correlation coefficient (ICC),19 and to assess the agreement of categorical data, we used Cohen’s Kappa statistics (𝜅).20 Because of non-normal distribution patterns, we evaluated the correlation between variables using Spearman’s rank correlation coefficient (rho [𝜌]). To assess the association of COPD eosinophilic phenotype with clinical outcomes, we used a multivariable-adjusted linear regression model for continuous and a logistic regression model for binary parameters.
Results
Cohort Characteristics
We enrolled 107 participants who completed V1. In-person follow-up visits at 3 months after enrollment were completed by 85% (N=91) of participants, and 66% (N=71) of enrolled participants completed the 1-year phone follow-up visit.
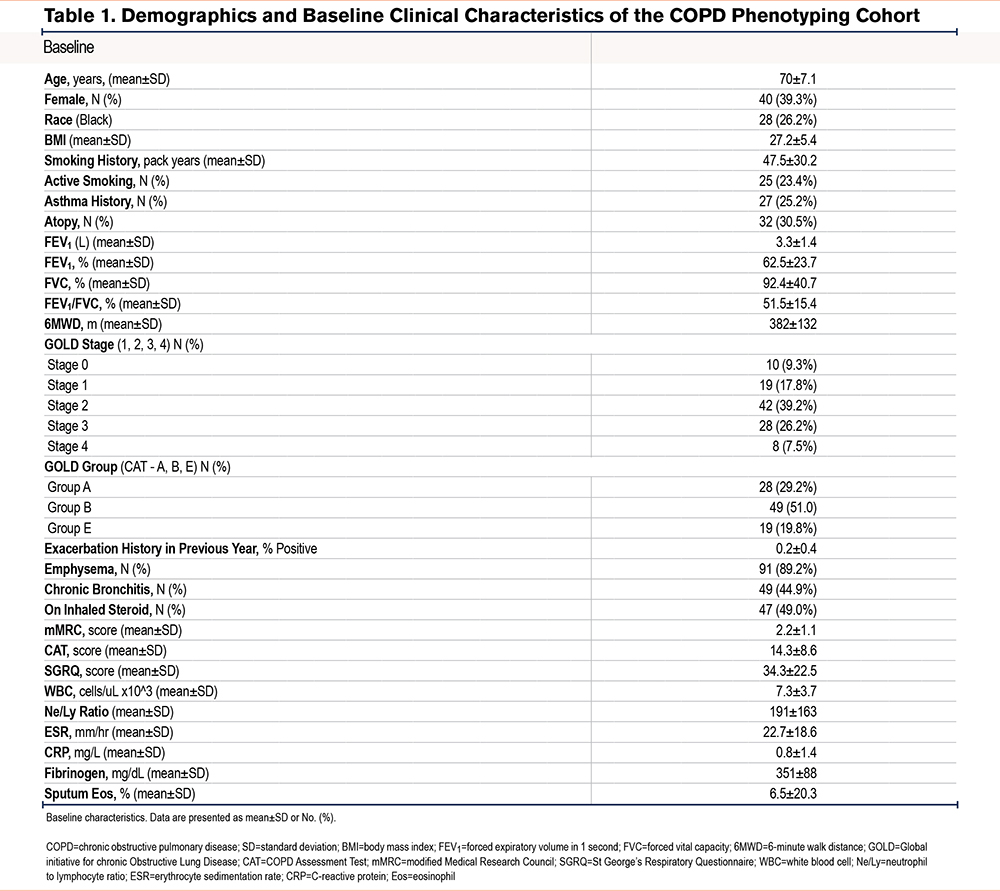
As presented in Table 1, participants with available BEC (N=107) were 70.0±7.1 (mean±standard deviation) years old and were predominantly White males. Based on postbronchodilator spirometry, enrolled participants had moderate obstruction (percentage predicted FEV1: 62.5±23.7) on average, and 10 (9%) were participants who had smoked tobacco and were at risk for COPD (GOLD 0). In comparison, 51% and 20% of those with COPD were GOLD Group B and E, respectively. Of 91 participants with available CT scans, 89% had emphysema. On review of prescribed medications, only 9% were using an ICS at baseline, and none reported chronic use of oral corticosteroids.
Collection of Specimens
In contrast to the blood specimens collected in all but one participant at V1 and all participants at the 3-month follow-up visit, spontaneous sputum collection yielded an adequate specimen in only 61% of all attempts at V1 and 67% of all attempts (a maximum of 2 for those who completed both in-person visits). Among those who had completed both visits and had sputum analysis, 14% could not provide sputum specimens at both visits.
Repeatability
The between-visit absolute BEC values correlated well (𝜌=0.67, p<0.01) and demonstrated moderate reliability for both absolute BEC (ICC=0.71) and percentage blood eosinophils (ICC=0.72). In contrast, sputum eosinophil analysis showed poor correlation (𝜌=0.22, P=0.22) and poor reliability (ICC =0.36) between the 2 visits.
Classification as an eosinophilic phenotype based on BEC≥300 cells/μL at V1 and V2 showed substantial between-visit agreement (91% agreement, 𝜅=0.64). Evaluating other clinically used BEC thresholds, classification as an eosinophilic phenotype based on BEC≥150 cells/μL showed moderate between-visit agreement (78% agreement, 𝜅=0.57), and the classification as low-eosinophilic COPD, using a threshold of ≤100 cells/μL, showed poor agreement between visits (69% agreement, 𝜅=0.3). Classification as an eosinophilic phenotype, defined by ≥2% sputum eosinophils, showed poor agreement between the 2 visits (agreement 66.7%, 𝜅=0.14).
Methods of Specimen Analysis
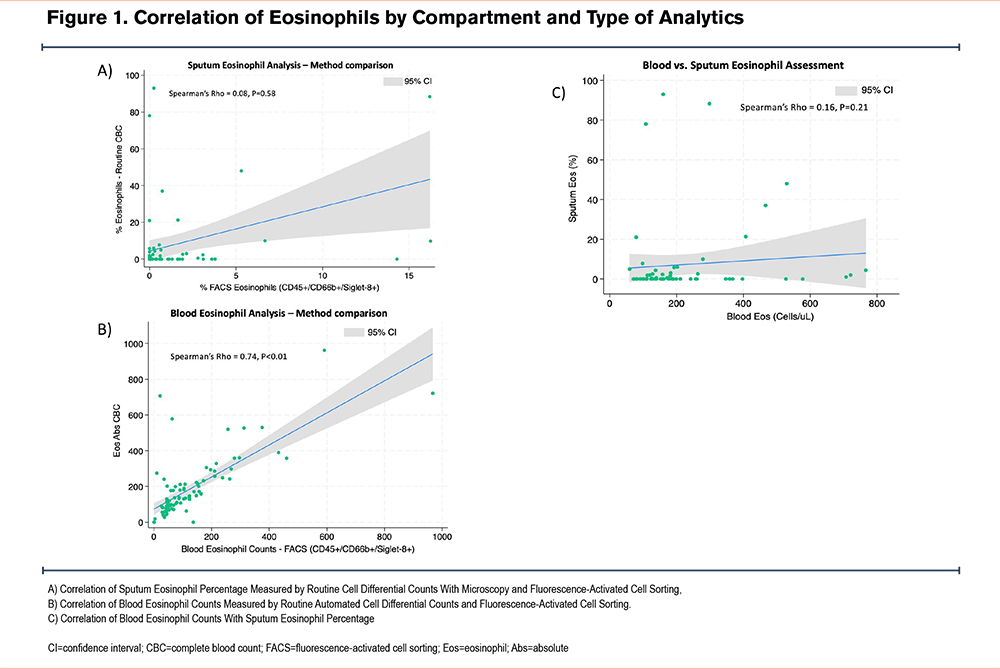
To evaluate the accuracy of the methodology for determining eosinophil counts, we compared CDC to the gold standard based on FACS. We analyzed all available sputum specimens from 63 participants. While there was a strong correlation between the 2 methods for blood specimen analysis (𝜌=0.74, p<0.01), the correlation between the sputum analysis methods was poor (𝜌=0.008, P=0.58) (Figure 1a-b).
Correlation Between Specimen Types
BEC at V1 correlated poorly with SpE% (𝜌=0.13, P=0.39). Comparing the maximum values obtained at either visit, BECmax had slightly better, but also poor, correlation with SpE%max (𝜌=0.16, P=0.21) (Figure 1c).
Blood Eosinophil Testing
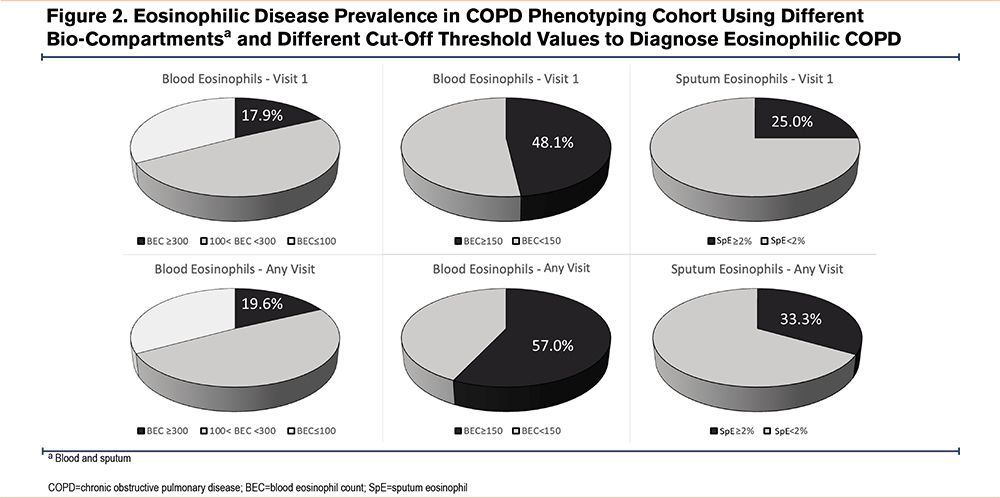
Median BEC of 144 (interquartile range [IQR]: 86–221) cell/μL and a median percentage of 2.3% (IQR: 1.4–3.3) of total white blood cell (WBC) counts. As presented in Figure 2, when high-BEC stratification is based on ≥300 cells/μL, the prevalence of the high eosinophilic phenotype was 17.9% at V1, or 19.6% if the BEC≥300 cells/μL was captured at either V1 or V2, or 10.1% if this threshold was reached consistently at all available samplings. BEC≥150 cells/μL was more prevalent, with 48.1% of participants at V1 and 57.0% of participants based on any of the 2 visits. BEC≤100 cells/μL was present in 33% of participants at V1, 45.8% if any of the visits were considered, or 17.6% if consistently BEC≤100 cells/μL.
Sputum Eosinophil Testing
The average SpE% was 6.5±20.3 for total sputum cell counts. Using a cut-off of 2% to define eosinophilic COPD at V1, 25% of participants could be classified as having the eosinophilic phenotype, and this number increased to 33.3% if SpE% was ≥2% at any of the 2 visits at which sputum was sampled (including individuals who had only 1 and those who had 2 sputum specimens available for analysis).
Agreement Between Bio-Compartment Assessments in Determining Eosinophilic Disease
When comparing BEC≥300 cells/μL with SpE%≥2 to determine eosinophilic COPD, only 5 (8%) participants satisfied both criteria, a finding that did not allow this approach to be evaluated for association with clinical outcomes. Blood and sputum-based criteria showed poor agreement (agreement 64.5%, 0.10). Agreement between blood and sputum SpE%≥2 criteria was only fair if once the blood eosinophil criterion was lowered to BEC≥150 cells/μL at all available visits (agreement 67.2%, 𝜅=0.25).
Characteristics of Eosinophilic COPD Based on Blood Eosinophil Counts
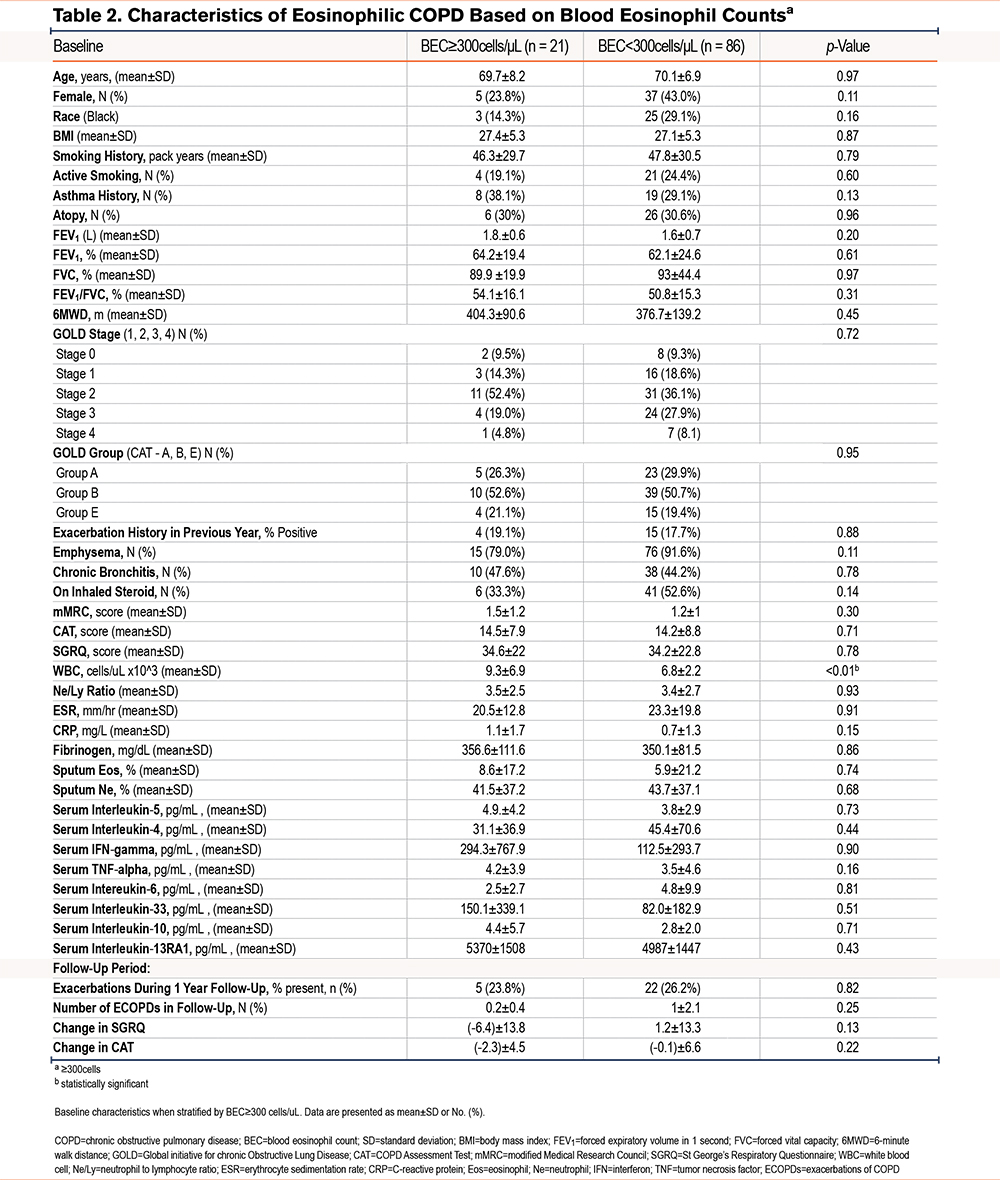
Compared to participants with BEC<300 cells/μL, those with BEC ≥300 cells/μL had a higher WBC count (9.3±6.9 versus 6.8±2.2 cells/μL, p<0.01) but did not differ in other clinical characteristics, including historic ECOPDs (Table 2). Participants with BEC ≥150 cells/μL at the baseline visit, compared to those with lower BEC, reported a history of asthma more often (35.5% versus 16.4%, p=0.03), and also had higher total leukocyte counts (7.9±6.7 ×10³ cells/μL versus 6.7±2.5 ×10³ cells/μL, p=0.02) (Supplemental Table 1 in the online supplement).
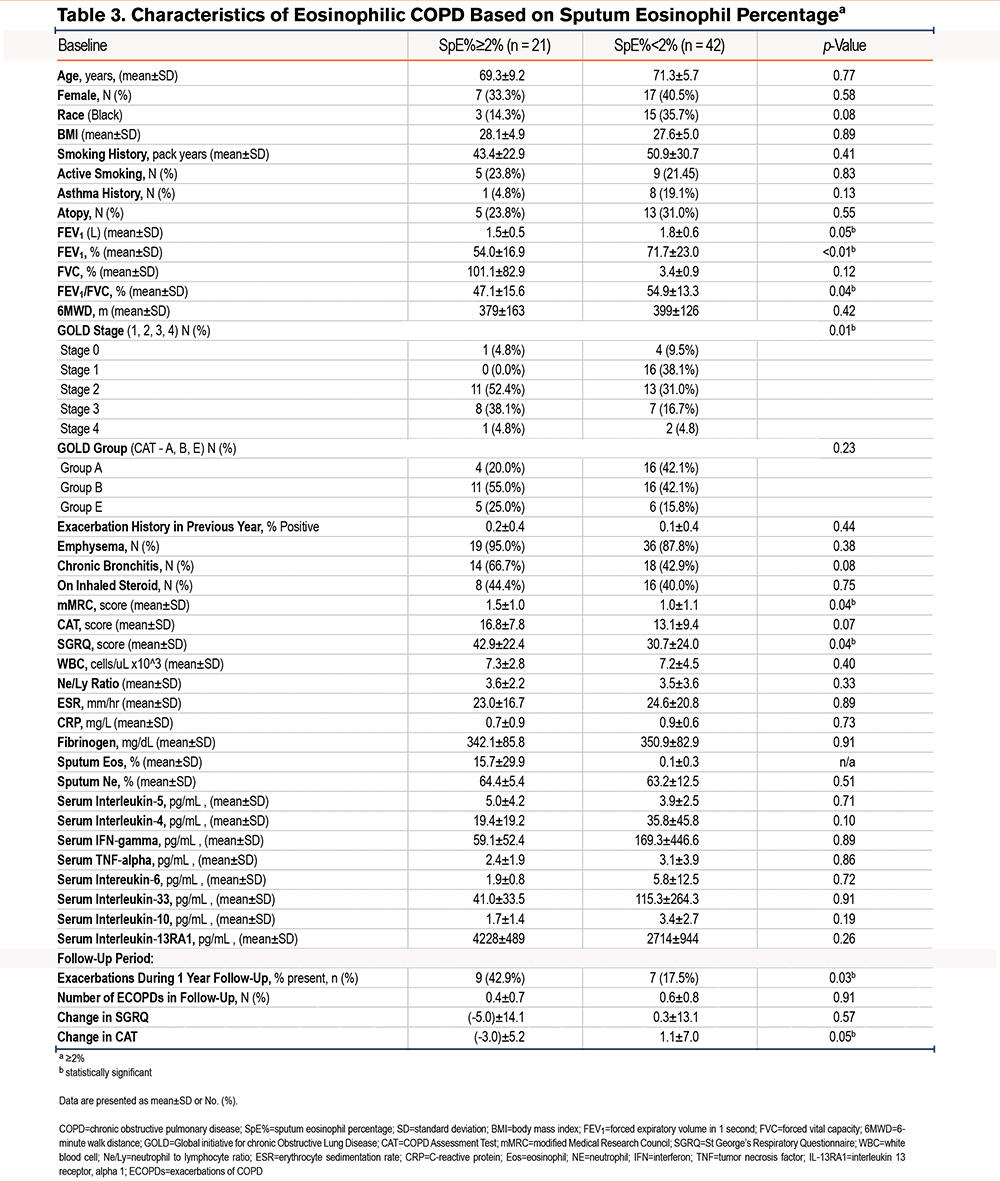
Characteristics of Eosinophilic COPD Based on Sputum Eosinophil Percentage ≥2%
Compared to participants with low sputum eosinophils, those with SpE%≥2 (n=21) had a lower postbronchodilator percentage predicted FEV1 (54.0±16.9% versus 71.7±23.0%, p=0.002) and lower FEV1 to forced vital capacity ratio, had a more advanced COPD GOLD spirometric grade, and were more symptomatic with a higher mMRC score (1.5±1.0 versus 1.0±1.1, p=0.04) and a higher SGRQ score (42.9±22.4 versus 30.7±24.0, p=0.04). More participants in the SpE≥2% group had severe or very severe (spirometric grades 3 and 4) COPD compared to those with SpE% <2% (42.9% versus 21.5%, p=0.01). In a multivariable analysis adjusted for age, sex, race, height, smoking status, and a lifetime smoking exposure history, participants with SPE%≥2% had a lower postbronchodilator percentage predicted FEV1 (coefficient: -0.23, p=0.04) but did not have more past (1 year before enrollment), or prospective exacerbations over the following year (Table 3). In a subanalysis limited to only participants with sputum eosinophilia and spirometry-proven COPD (GOLD 1–4), we found similar, lower FEV1 percentage predicted in comparison to those with SpE%<2 (coefficient: -0.07, p<0.01)
Blood Eosinophils and Clinical Risk Stratification
Older participants (age ≥65) had a higher BEC than younger participants (200±160 versus 152±172 cells/μL, p=0.03), and nominally higher BEC was seen in males (p=0.13), non-Black participants (p=0.09), and former smokers (p=0.25). Those who had ECOPDs in the year before enrollment, compared to those who had not, had only a nominally higher BEC (200±128 versus 190±171 cells/μL, p=0.35).
Participants with sputum eosinophilia (SpE%≥2) had nominally higher BEC (254±203 versus 167±127, p=0.24) compared to those with lower SpE%. There was no BEC difference between participants receiving versus those not receiving an ICS, regardless of whether or not they had either emphysema or chronic bronchitis, nor was there a difference between symptomatic (mMRC ≥2 or CAT ≥10) and nonsymptomatic individuals. No difference in BEC was seen when comparing those with high versus normal values of C-reactive protein (CRP) (p=0.87), sedimentation rate (p=0.71), or fibrinogen (p=0.42). There was no difference in BEC between those with or without previous exacerbations (in the year before enrollment). In contrast, those with an exacerbation during the follow-up period had lower BEC at the entry visit (145±120 versus 211±177, p=0.04).
Participants with a history of asthma had a higher BEC than those without (225±135 versus 179±170 cells/μL, p=0.02). However, neither BEC≥300 cells/μL nor SPE%≥2% was associated with asthma history. In contrast, having low BEC ≤100 cells/μL at V1 was associated with a less prevalent history of asthma (14.8% versus 39.2%, p<0.02). There was no association between atopy and BEC. Similarly, we found no evidence that the highest SpE% from the 2 visits correlated with a history of asthma or atopy, nor did those with SpE%≥2 have a history of asthma or atopy more often than those with SpE%<2.
Relationship With Inhaled Corticosteroid Use and Smoking Status
Of the participants who reported using maintenance inhaled medication, 49 (47%) used an ICS. Compared to those not using an ICS, they had only modestly lower values of BECmax (189±129 versus 246±199 cells/μL, p=0.26) or SpE%max (5.5±18.2% versus 6.5±16.5%, p=0.99).
Compared to participants who formerly smoked, those who currently smoked tobacco had similar SpE%max (12.9±30.9% versus 5.6±15.2%, p=0.96) and BECmax (225±191 versus 224±168 cells/μL, p=0.71).
Blood Eosinophil Count During Exacerbations
We recruited 13 participants during exacerbations of their COPD. They were 70.8±6.1 years old, were comprised of slightly more females (53.8%), and were predominantly White (76.9%); 57.1% of these participants were currently smoking with a heavy tobacco use history (49.5±39.9 pack years), and 36.4% had a history of asthma and atopy. Their postbronchodilator percentage predicted FEV1 was 57.3±11.6, and 11.1% were on an ICS (Supplemental Table 2 in the online supplement).
Comparing the biomarker values during an ECOPD to values in the clinically stable state of the same individuals 3 months later, BEC values were similar: 101±109 cells/μL versus 102±29.2 cells/μL. In contrast, peripheral blood neutrophils during ECOPDs were higher (80.3±12.3% versus 69.7±7.6%, p<0.01) compared to values 3 months later. While the low number of participants in this substudy did not allow for meaningful statistical analysis, inflammatory markers were nominally higher during ECOPDs compared to the stable state 3 months later (WBC: 12.4±5.0 ×10³ versus 5.9±2.0 ×10³ cells/μL and CRP: 5.8±9.7 versus 4.4±2.2mg/L). In an unadjusted sensitivity analysis comparing the levels of inflammatory markers during ECOPDs in the exacerbation cohort and their levels at steady state of the main COPD cohort, exacerbations were associated with higher levels of WBC, neutrophil percentage, CRP, and fibrinogen (Supplemental Table 3 in the online supplement).
Eosinophil Status and Inflammatory Markers
Multi-analyte Luminex testing found minimal correlation between blood eosinophil status and levels of serum cytokines, particularly interleukin (IL)-4, IL-5, and tumor necrosis factor (TNF)α. Specifically, when comparing participants with BEC≥300 cells/μL to those with BEC<300 cells/μL, we found no significant correlation with levels of IL-5, IL-4, or IL-13 receptor, alpha 1 (IL-13RA1) but noted a mild nominal trend toward higher TNFα concentrations in sera of the higher BEC group (4.2±3.9pg/mL versus 3.5±4.6pg/mL, p=0.16). Likewise, when comparing participants with SpE%≥2 to those with fewer eosinophils, there were no differences in IL-5, TNFα, IL-4, or IL-13RA1 (Tables 2 and 3).
Discussion
Eosinophil measurement has become a recommended routine in the COPD assessment.21 The relationships between eosinophilia, exacerbations, and responsiveness to ICSs have been well established.22 However, it seems there is more to be understood about the role of eosinophils in the airway inflammation of COPD.23 We conducted a single-center, observational study that aimed to better understand the role of biomarkers in clinical phenotyping of participants with current and former tobacco smoking with or at risk for COPD. In this analysis, we investigated the nuances of eosinophil assessment in routine care and explored the clinical repercussions of different methods of diagnosing the eosinophilic COPD phenotype. We showed significant heterogeneity in the identification of eosinophilic COPD stemming from how one defines and measures eosinophilia, including whether to use blood or sputum, the assay technique, cutoff thresholds, and whether one requires repeated samplings for assessment of consistency of the measured values.
Several findings from our analysis merit discussion. The prevalence of eosinophilic COPD as a clinical manifestation of type 2 inflammation24 ranged in our study from 17.9% to 57.0%, depending on the method used for assessing the eosinophilic phenotype. This finding suggests that the technical differences in its assessment can significantly impact variability in the diagnostic criteria for the eosinophilic COPD phenotype (20%–40%).25 On the other hand, the low-eosinophilic population, defined by BEC≤100 cells/μL, was more prevalent in our analysis than the eosinophilic phenotype. It has been shown that BEC≤100cells/μL carries risks of worsened clinical outcomes,26 underscoring the importance of additional research focused on our understanding of non-type 2 immune responses in COPD and precision medicine approaches in these patients.
While the percentage of blood eosinophils can also be used,7,27-29various cut-off values of absolute BEC have been used to diagnose the eosinophilic phenotype in COPD.21,30 BEC analysis is readily available and repeatable, with automated CDC assessment being adequate, but its association with clinical outcomes was limited in our study, supporting previously published data.8 Compared to blood eosinophilia, sputum eosinophilia has been reported to be a better marker of the eosinophilic COPD phenotype8,9and has been associated with a history of exacerbations, lower FEV1, lower exercise capacity, greater symptoms, and poorer quality of life in COPD individuals.2,3,31,32 In the SubPopulations InteRmediate Outcome Measures In COPD Study cohort, high concentrations of sputum eosinophils were a better biomarker than high concentrations of blood eosinophils for identifying a patient subgroup with more severe disease, more frequent exacerbations, and increased emphysema.8 Recognizing the limitation of our smaller cohort, our results aligned with these findings, suggesting that SpE%≥2 has greater sensitivity to identify a clinically sicker population of patients compared to blood analysis. Unfortunately, however, sputum analysis in our cohort showed relatively poor repeatability, with many participants demonstrating discordance in SpE% between 2 visits 3 months apart. Moreover, sputum eosinophils are not readily accessible, and a large portion of individuals with COPD are incapable of producing adequate sputum. In our study, approximately a third of individuals could not provide an adequate spontaneous sputum specimen after one (39.3%) or up-to-2 sampling attempts (32.7%) despite adequate hydration.
Repeating laboratory testing twice over 3 months in a steady state of disease, but using the same threshold for eosinophilia for sputum and blood, led to an increased prevalence of eosinophilic COPD by up to 9% over the initial prevalence based on the baseline assessment (Figure 2). Understanding how to interpret variable lab results is of significant relevance, as shown in the Evaluation of COPD Longitudinally to Identify Predictive Surrogate Endpoints study, in which 49% of study participants had only intermittent elevations of SpE%, and the stability of eosinophil counts was significantly lower in patients with COPD than in controls.23,33 Despite acknowledging the suboptimal repeatability of BEC, especially when higher BEC thresholds are used, current guidelines do not leave clear recommendations on how many blood results should be considered when determining the presence of eosinophilic inflammation in COPD.6
The lab methodology of specimen processing was relevant in our study. In contrast to flow cytometry, which can be considered the gold standard for assessment of eosinophils in sputum,34 routine CDC tends to underestimate percentages of these cells in the sputum. This may not necessarily be inherent to the sputum bio-compartment but could be a consequence of the presence of cellular debris and dead cells, as well as the opinion of the interpreter. While this finding should not suggest that more complex and expensive flow cytometry should be routinely used, it calls attention to the fact that many factors can influence sputum WBC analysis.
This analysis has some limitations. We chose to use cut-off values rather than to consider eosinophils as a continuous variable since categorical data with defined cut-points allows for a better prediction of clinical outcomes with knowledge of sensitivity and specificity.2 This approach was also chosen from the practical standpoint, acknowledging the wide use of cut-off values to determine recommended therapeutic approaches.6 Our cohort is relatively small and was not powered to determine significant associations with major clinical outcomes over an extended period. However, our use of a second in-person visit 3 months after enrollment and a 1-year follow-up over the phone provided us with the opportunity to assess the stability of eosinophilic biomarkers despite the inadequacy of our study design for evaluating long-term longitudinal outcomes. Some strengths include a well-described, longitudinally followed cohort of individuals with or at risk for COPD. All individuals were evaluated twice over a short period, offering a unique chance to assess repeatability of multiple measures. We extended the sputum analysis beyond routine cell count to compare the latter with flow cytometric analysis and evaluated both cross-sectional and longitudinal clinical outcomes. While not the only study longitudinally comparing blood and sputum, our analysis adds to the current knowledge about the methods used to determine eosinophilic COPD.
Conclusions
Both blood and sputum eosinophil counts offer helpful information in identifying type-2 eosinophilic inflammation. Nevertheless, our data demonstrate that relatively small differences in the methodology of diagnosing the eosinophilic COPD phenotype may have significant repercussions not only on the designation of a COPD phenotype as “eosinophilic,” but also on guiding therapeutic decisions. From the practical standpoint, further research focused on standardizing the clinical interpretation of eosinophilia is needed.
Acknowledgements
Author contributions: WBL, RGB, DPT, CBC, HP, JAB, VP, JEP, and IZB contributed to the conception and design of the study. SAI, RW, JB, JAB, VP, and TB assisted with the acquisition of data. WBL, RW, RGB, and IZB provided statistical analysis support. WBL, RW, and IZB were the primary composers of the manuscript. All authors contributed to the data interpretation as well as to the editing and final approval of the manuscript.
The authors would like to express gratitude to Amgen and the UCLA Clinical Center for Clinical and Translational Research for the extensive ancillary support provided.
Declaration of Interests
SAI, HP, and JEP were employees at Amgen during their contribution to the manuscript. RGB and IZB received institutional grant funding from Amgen for this manuscript. RGB has received institutional grants from the National Institutes of Health (NIH), the University of California Office of the President and the Veterans Administration and has received personal fees from DynaMed, 2ndMD, Chiesi, Optum, Pri-Med, and Aneszi Ozmon, Ltd. DPT has received institutional grants from the NIH and the COPD Foundation and has received personal fees from Merck/Prometheus. CBC has received institutional grants from the COPD Foundation and the NIH, has served as a Scientific Advisor for AstraZeneca, and has received personal fees from GlaxoSmithKline, Chulalongkorn University, NUVAIRA, Horizon Therapeutics, MGC Diagnostics, Chiesi, Herbalife Nutrition Institute, Respiree, Aer Therapeutics, Genentech, RS Biotherapeutics, and Verona. IZB has received institutional grants from Theravance and Viatris, Aerogen, the Alpha-1 Foundation, the Johnny Carson Foundation, and Takeda and has received consulting fees from AztraZeneca, Sanofi/Regeneron, Grifols, Verona Pharma, Inhibrx, Takeda, Genentech, Aerogen, and Theravance and Viatris. WBL, RW, JB, JAB, VP, and TB have no conflicts of interest to declare.